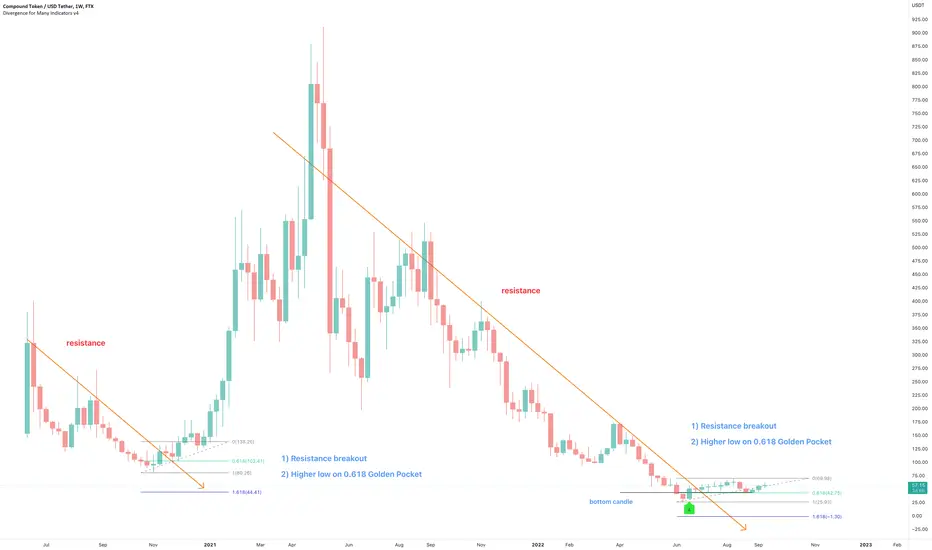
On the above 1-week chart price action has corrected 95% since May 2021. A number of reasons now exist to be bullish, including:
1) A strong buy signal prints (not shown). If you want to see, just ask.
2) Price action, RSI and MFI resistance breakouts.
3) Regular bullish divergence.
4) Everything that was said above is also true for the BTC pair.
5) Price action prints the higher low on the golden pocket following point #2. Look left!
Is it possible price action falls further? Sure.
Is it probable? No.
Ww
Type: trade
Risk: <=6% of portfolio
Timeframe: Don’t know.
Return: $800 / 1400%
Stop loss: None
บันทึก
Do you see the 2-day DOJI candle printing on the 2-day/50-day SMA?? Closes today.การซื้อขายยังคงดำเนินอยู่
Did you see the candle that has printed on the two week chart? Fantastic.What does this candle mean?
youtube.com/watch?v=H3ZBDIsF0is
บันทึก
This is a 2-day chart. The two moving averages shown (on separate time frames) saw a crazy jump in price action once they crossed. A particular give away is the curved bottom.Let's come back to this place in 90 days to see if history repeated itself.
การซื้อขายยังคงดำเนินอยู่
Did you see what printed on the 3-day chart?What happened just at the beginning of this month has not happened since January 7-10th, 2021. Price action roared up 450% after that.
การนำเสนอที่เกี่ยวข้อง
คำจำกัดสิทธิ์ความรับผิดชอบ
ข้อมูลและบทความไม่ได้มีวัตถุประสงค์เพื่อก่อให้เกิดกิจกรรมทางการเงิน, การลงทุน, การซื้อขาย, ข้อเสนอแนะ หรือคำแนะนำประเภทอื่น ๆ ที่ให้หรือรับรองโดย TradingView อ่านเพิ่มเติมที่ ข้อกำหนดการใช้งาน
การนำเสนอที่เกี่ยวข้อง
คำจำกัดสิทธิ์ความรับผิดชอบ
ข้อมูลและบทความไม่ได้มีวัตถุประสงค์เพื่อก่อให้เกิดกิจกรรมทางการเงิน, การลงทุน, การซื้อขาย, ข้อเสนอแนะ หรือคำแนะนำประเภทอื่น ๆ ที่ให้หรือรับรองโดย TradingView อ่านเพิ่มเติมที่ ข้อกำหนดการใช้งาน