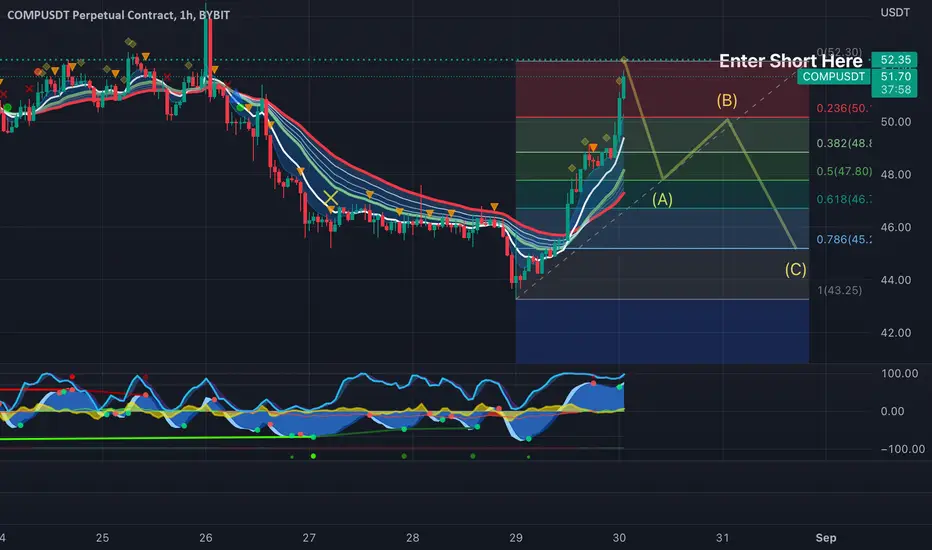
COMP is about to hit its resistance and these are the targets for its corrective move. I have the ABC correction aligned with fib levels. I expect COMP to retrace based on other indicators I see on the higher time frames. The RSI and Momentum have been over extended for quite awhile. I don't see it breaking its resistance like that.
This chart based off of The Elliot Wave Theory, Fibonacci, EMA’s, MacD , RSI , Momentum, and resistance/support zones combined with patterns.
This chart based off of The Elliot Wave Theory, Fibonacci, EMA’s, MacD , RSI , Momentum, and resistance/support zones combined with patterns.
บันทึก
Trade closed for a 12% profit. ✅คำจำกัดสิทธิ์ความรับผิดชอบ
ข้อมูลและบทความไม่ได้มีวัตถุประสงค์เพื่อก่อให้เกิดกิจกรรมทางการเงิน, การลงทุน, การซื้อขาย, ข้อเสนอแนะ หรือคำแนะนำประเภทอื่น ๆ ที่ให้หรือรับรองโดย TradingView อ่านเพิ่มเติมที่ ข้อกำหนดการใช้งาน
คำจำกัดสิทธิ์ความรับผิดชอบ
ข้อมูลและบทความไม่ได้มีวัตถุประสงค์เพื่อก่อให้เกิดกิจกรรมทางการเงิน, การลงทุน, การซื้อขาย, ข้อเสนอแนะ หรือคำแนะนำประเภทอื่น ๆ ที่ให้หรือรับรองโดย TradingView อ่านเพิ่มเติมที่ ข้อกำหนดการใช้งาน