🔎 Multi-Timeframe (MTF) & Higher Timeframe (HTF) Analysis
HTF (Yearly, Half-Yearly, Quarterly): All showing UP trend, with strong demand zones.
HTF Avg Demand: ~₹990 (Proximal 1077 – Distal 902).
Stock is trading well above HTF demand, confirming bullish structure.
MTF (Monthly, Weekly, Daily): All UP with demand zones clustered around 1328–1350.
MTF Avg Demand: ~₹1276 (Proximal 1352 – Distal 1200).
Current trade setup aligns with MTF demand zone entry.
ITF (240m, 180m, 60m): All showing UP, clustered demand around 1233–1326.
Suggests short-term confirmation of entry levels.
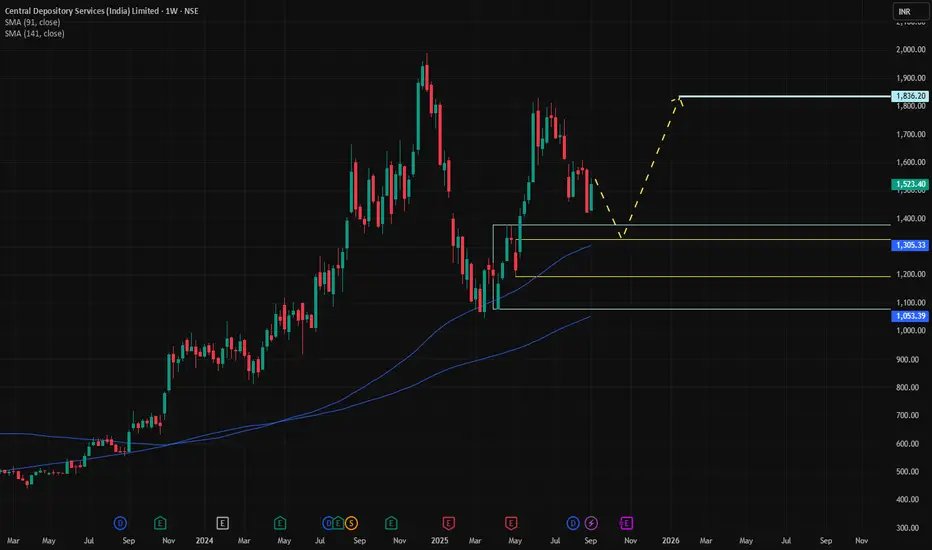
✅ Conclusion: All timeframes confirm bullish bias; demand zones are well aligned around 1328–1350, supporting long trade setup.
🎯 Trade Plan (Swing Position)
Entry Price: ₹1328
Stop Loss (SL): ₹1194
Target Price (TP): ₹1834 (aligns with last swing high ₹1832)
Risk/Reward (RR): ~3.77x (Net RR: 3.55 after costs) – excellent setup
💰 Position & Risk
Quantity: 500 shares
Total Buy Value: ₹6,64,000
Risk: ₹134 per share → ₹67,000 (≈10% of position)
Reward: ₹506 per share → ₹2,53,000 gross profit
Brokerage & Charges (0.49%): ₹3,255
Net Profit (if TP hit): ₹2,49,745
Net Loss (if SL hit): ~₹70,255
📊 Leverage (MTF Capital)
Self Capital: ₹4,31,600
Broker Funding: ₹2,32,400
Interest (4 months @ 9.69% p.a.): ~₹13,750
➡️ Net Profit after Funding Cost: ₹2,35,995
➡️ Real ROI (4 months): ~102% on own capital
⚖️ Trade Evaluation
✅ Strong alignment across HTF, MTF, ITF (all UP).
✅ Entry sits at fresh MTF demand, aligning with structure.
✅ High RR >3.5x with realistic swing target.
✅ Funding cost minimal compared to potential ROI.
⚠️ Risks:
SL at ₹1194 sits below strong MTF/ITF demand; must hold above this level.
Sharp market-wide correction may breach support zones.
Execution discipline critical — avoid averaging below SL.
👉 In short, this is a high-probability swing trade setup with favorable reward vs risk. If CDSL sustains above 1328–1350, your plan is well-positioned for a breakout toward 1830+.
HTF (Yearly, Half-Yearly, Quarterly): All showing UP trend, with strong demand zones.
HTF Avg Demand: ~₹990 (Proximal 1077 – Distal 902).
Stock is trading well above HTF demand, confirming bullish structure.
MTF (Monthly, Weekly, Daily): All UP with demand zones clustered around 1328–1350.
MTF Avg Demand: ~₹1276 (Proximal 1352 – Distal 1200).
Current trade setup aligns with MTF demand zone entry.
ITF (240m, 180m, 60m): All showing UP, clustered demand around 1233–1326.
Suggests short-term confirmation of entry levels.
✅ Conclusion: All timeframes confirm bullish bias; demand zones are well aligned around 1328–1350, supporting long trade setup.
🎯 Trade Plan (Swing Position)
Entry Price: ₹1328
Stop Loss (SL): ₹1194
Target Price (TP): ₹1834 (aligns with last swing high ₹1832)
Risk/Reward (RR): ~3.77x (Net RR: 3.55 after costs) – excellent setup
💰 Position & Risk
Quantity: 500 shares
Total Buy Value: ₹6,64,000
Risk: ₹134 per share → ₹67,000 (≈10% of position)
Reward: ₹506 per share → ₹2,53,000 gross profit
Brokerage & Charges (0.49%): ₹3,255
Net Profit (if TP hit): ₹2,49,745
Net Loss (if SL hit): ~₹70,255
📊 Leverage (MTF Capital)
Self Capital: ₹4,31,600
Broker Funding: ₹2,32,400
Interest (4 months @ 9.69% p.a.): ~₹13,750
➡️ Net Profit after Funding Cost: ₹2,35,995
➡️ Real ROI (4 months): ~102% on own capital
⚖️ Trade Evaluation
✅ Strong alignment across HTF, MTF, ITF (all UP).
✅ Entry sits at fresh MTF demand, aligning with structure.
✅ High RR >3.5x with realistic swing target.
✅ Funding cost minimal compared to potential ROI.
⚠️ Risks:
SL at ₹1194 sits below strong MTF/ITF demand; must hold above this level.
Sharp market-wide correction may breach support zones.
Execution discipline critical — avoid averaging below SL.
👉 In short, this is a high-probability swing trade setup with favorable reward vs risk. If CDSL sustains above 1328–1350, your plan is well-positioned for a breakout toward 1830+.
คำจำกัดสิทธิ์ความรับผิดชอบ
ข้อมูลและบทความไม่ได้มีวัตถุประสงค์เพื่อก่อให้เกิดกิจกรรมทางการเงิน, การลงทุน, การซื้อขาย, ข้อเสนอแนะ หรือคำแนะนำประเภทอื่น ๆ ที่ให้หรือรับรองโดย TradingView อ่านเพิ่มเติมที่ ข้อกำหนดการใช้งาน
คำจำกัดสิทธิ์ความรับผิดชอบ
ข้อมูลและบทความไม่ได้มีวัตถุประสงค์เพื่อก่อให้เกิดกิจกรรมทางการเงิน, การลงทุน, การซื้อขาย, ข้อเสนอแนะ หรือคำแนะนำประเภทอื่น ๆ ที่ให้หรือรับรองโดย TradingView อ่านเพิ่มเติมที่ ข้อกำหนดการใช้งาน