BTC 8H chart - bullish fibonacci pullback zones for resersal
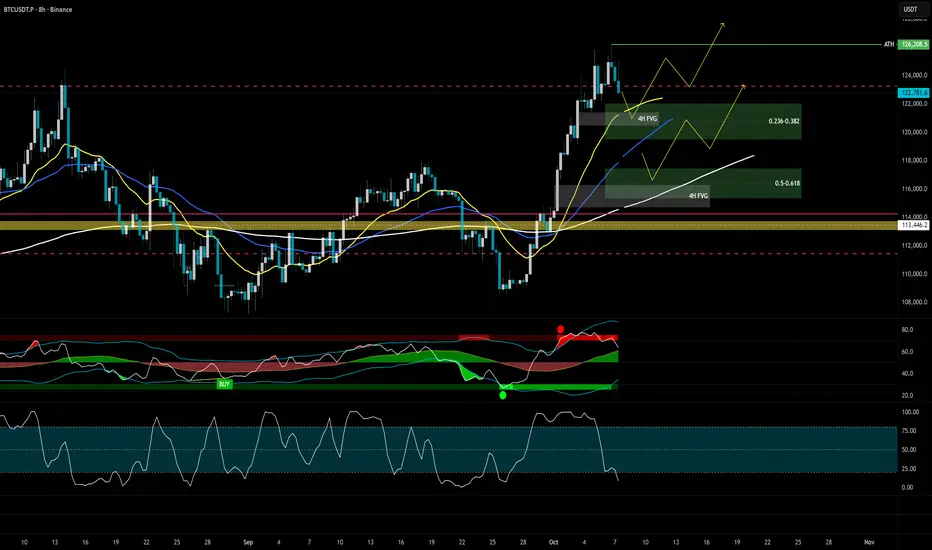
I have high probability two scenarios in mind approx. 4-8% pullback.
Notice lower oscillator indicator, Stoch RSI on 8H already starting to build momentum at the bottom zone.
Might take couple of days to consolidate in those levels.
Crypto grandpa sharing charts & setups. Free TA, zero fluff.
Not financial advice — still two feet above ground.
Follow me here and on Twitter X. Thanks!
Not financial advice — still two feet above ground.
Follow me here and on Twitter X. Thanks!
คำจำกัดสิทธิ์ความรับผิดชอบ
ข้อมูลและบทความไม่ได้มีวัตถุประสงค์เพื่อก่อให้เกิดกิจกรรมทางการเงิน, การลงทุน, การซื้อขาย, ข้อเสนอแนะ หรือคำแนะนำประเภทอื่น ๆ ที่ให้หรือรับรองโดย TradingView อ่านเพิ่มเติมที่ ข้อกำหนดการใช้งาน