Bitcoin: Potential Triangle Break Out To Mid 11K Resistance.
Bitcoin is developing a new swing trade long signal in a location that is less than ideal. Since the broader trend is BULLISH, we are open to the trade idea because overall probability still favors a bullish breakout.
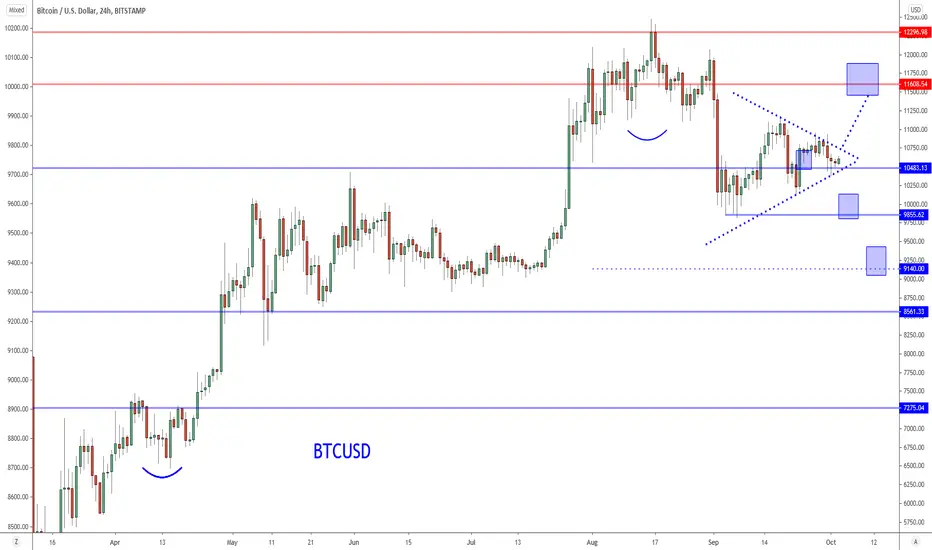
Recent price action has established a consolidation which is a series of lower highs and higher lows (also known as a triangle). These chart structures often serve as trend continuation patterns, so in this context, a bullish break out is favored.
Will the breakout occur on the next leg? And how far can it reasonably run?
The recent sell off attempt has gone nowhere which means there are most likely a new population of shorts that can drive this market to the 11,600 resistance on the next squeeze. There needs to be a solid catalyst, and it can come from a variety of sources: strong stock market, news specific to the space, or even a run for safety (like Gold).
The catalyst serves as a motivation for NEW buyers to jump in. It doesn't matter why they jump in, what matters is that they do it. In other words, chasing news will not help you, that is what the herd is for. Our job as pragmatic traders is to evaluate the evidence that buyers are buying and confirm there is enough to justify taking a risk relative to the potential reward. That's IT.
There's enough information on a candlestick chart to make such a determination (no oscillators required). Here is part of the trade idea that we may share:
Buy STOP: 10,675
Target 1: 11,375
The stop loss order and other two targets will be shared privately. This info may also change somewhat depending on how price unfolds over the next couple of hours.
A break out of the current consolidation can take price back to the 11,600 to 12,300 resistance zone or higher. We will use this zone as one area to measure potential profit targets.
What makes this location less than ideal? Price is in the middle of the consolidation which can be interpreted as only a 50% probability of the trade going our way (compared to a broad failed low or double bottom).
I hope you find my analysis helpful, please let me know if you have any questions in the comment section and I will do my best to answer them.
บันทึก
Target 1 has been reached at 11,375 after 6 days (700 point profit).Our risk is now reduced by 1/3 with 2 more targets to go.
At this point we often suggest raising the stop loss order to break even which will make this trade risk free. IF price retraces back to the entry, the outcome will still be profitable (because we locked in 1/3).
The 11,600 to 12,300 resistance zone is now in play (thank you shorts!). If momentum continues, this zone can be cleared. The triangle break out has now established another higher low formation, which is likely to lead to a higher high.
From here we just let the market work.
I hosted ICTC 2025: whitebit.com/m/ICTC-2025
Try Trade Scanner Pro for FREE: bit.ly/TSCPRO
LIVE Day Trades: youtube.com/@marcpmarkets.signals
Watch Full Trade Scanner Pro Tutorial: youtu.be/fdFLhLnqM9A
Try Trade Scanner Pro for FREE: bit.ly/TSCPRO
LIVE Day Trades: youtube.com/@marcpmarkets.signals
Watch Full Trade Scanner Pro Tutorial: youtu.be/fdFLhLnqM9A
คำจำกัดสิทธิ์ความรับผิดชอบ
ข้อมูลและบทความไม่ได้มีวัตถุประสงค์เพื่อก่อให้เกิดกิจกรรมทางการเงิน, การลงทุน, การซื้อขาย, ข้อเสนอแนะ หรือคำแนะนำประเภทอื่น ๆ ที่ให้หรือรับรองโดย TradingView อ่านเพิ่มเติมที่ ข้อกำหนดการใช้งาน