Hello all, Happy Saturday! Today I want to cover about today's potential volatility that could occur in the market. Now, let's do the technical analysis.
Whenever it comes to the weekend, usually the price will have an extra volatility due to the closes on the CME daily candle in the next 2 days and a potential addition volume from the retail traders. With this potential of much volatility, there will be a lot of faking out moves in the market as well. Wick fishing, squeeze are those thing that usually occur between Saturday and Sunday.
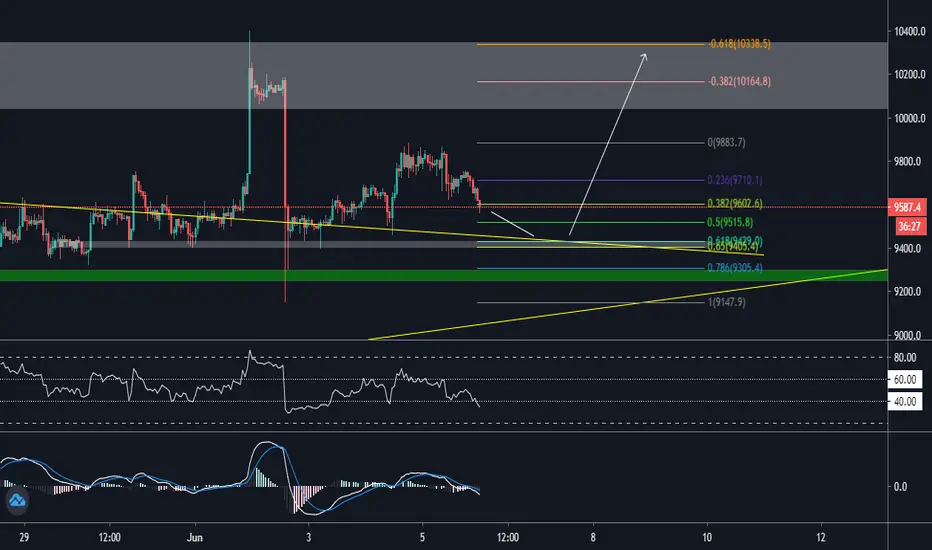
Now let's look at the RSI as one of my favorite volume indicator which in the lower time frame is now breaching the lower limit of the neutral zone and entering the bearish zone as well. I'm pretty sure that the bears will try to push the price lower to make the RSI trends at the oversold region. Similar action at the MACD histogram too, both the histogram and the trend lines are trending slight below the 0 level.
Based on the price action, the above statement is in align with the potential correction to the golden pocket zone which has the confluence with the previous broken resistance trend line of the contracting triangle (around $9400). In this case, I will assume a bounce after the price touches this region because this support region is the strong level for intraday level. I will expect the price bounces and head back to the interim swing high which is having an alignment with the -.618 fibonacci retracement as the ideal short term target as well.
Huge volatility incoming, just be cautious!
Whenever it comes to the weekend, usually the price will have an extra volatility due to the closes on the CME daily candle in the next 2 days and a potential addition volume from the retail traders. With this potential of much volatility, there will be a lot of faking out moves in the market as well. Wick fishing, squeeze are those thing that usually occur between Saturday and Sunday.
Now let's look at the RSI as one of my favorite volume indicator which in the lower time frame is now breaching the lower limit of the neutral zone and entering the bearish zone as well. I'm pretty sure that the bears will try to push the price lower to make the RSI trends at the oversold region. Similar action at the MACD histogram too, both the histogram and the trend lines are trending slight below the 0 level.
Based on the price action, the above statement is in align with the potential correction to the golden pocket zone which has the confluence with the previous broken resistance trend line of the contracting triangle (around $9400). In this case, I will assume a bounce after the price touches this region because this support region is the strong level for intraday level. I will expect the price bounces and head back to the interim swing high which is having an alignment with the -.618 fibonacci retracement as the ideal short term target as well.
Huge volatility incoming, just be cautious!
การนำเสนอที่เกี่ยวข้อง
คำจำกัดสิทธิ์ความรับผิดชอบ
ข้อมูลและบทความไม่ได้มีวัตถุประสงค์เพื่อก่อให้เกิดกิจกรรมทางการเงิน, การลงทุน, การซื้อขาย, ข้อเสนอแนะ หรือคำแนะนำประเภทอื่น ๆ ที่ให้หรือรับรองโดย TradingView อ่านเพิ่มเติมที่ ข้อกำหนดการใช้งาน
การนำเสนอที่เกี่ยวข้อง
คำจำกัดสิทธิ์ความรับผิดชอบ
ข้อมูลและบทความไม่ได้มีวัตถุประสงค์เพื่อก่อให้เกิดกิจกรรมทางการเงิน, การลงทุน, การซื้อขาย, ข้อเสนอแนะ หรือคำแนะนำประเภทอื่น ๆ ที่ให้หรือรับรองโดย TradingView อ่านเพิ่มเติมที่ ข้อกำหนดการใช้งาน