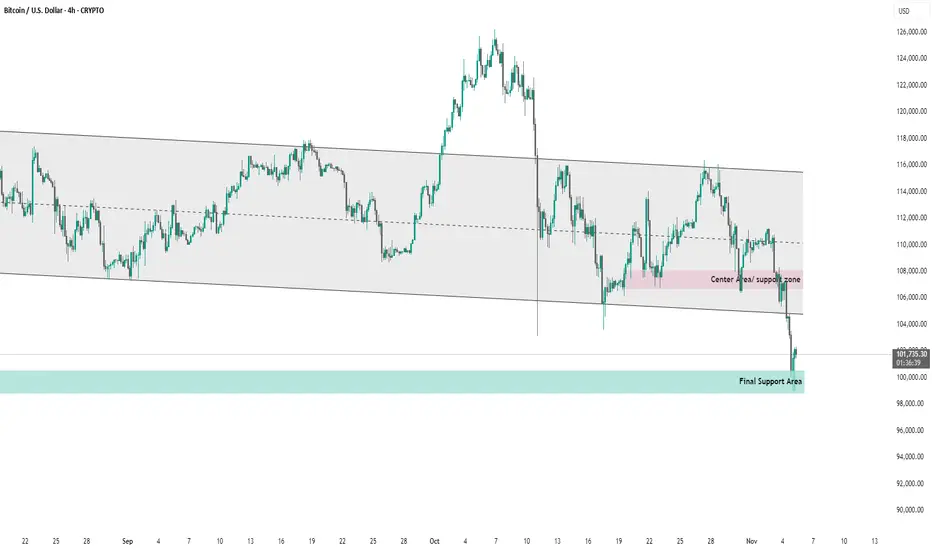
This chart shows Bitcoin (BTC/USD) price action on the 4-hour timeframe within a descending channel.
The price has consistently respected the upper and lower bounds of the channel, indicating a prevailing downtrend.
A center area/support zone around $107,000–$109,000 acted as interim support but has recently been broken.
The price has now reached the final support area near $100,000–$101,000, which is currently being tested.
If this final support fails, it could signal a continuation of the bearish trend; otherwise, a bounce from this level might lead to a short-term retracement toward the mid-channel zone.
Overall, the chart highlights a critical support test within a broader bearish structure.
การนำเสนอที่เกี่ยวข้อง
คำจำกัดสิทธิ์ความรับผิดชอบ
ข้อมูลและบทความไม่ได้มีวัตถุประสงค์เพื่อก่อให้เกิดกิจกรรมทางการเงิน, การลงทุน, การซื้อขาย, ข้อเสนอแนะ หรือคำแนะนำประเภทอื่น ๆ ที่ให้หรือรับรองโดย TradingView อ่านเพิ่มเติมใน ข้อกำหนดการใช้งาน
การนำเสนอที่เกี่ยวข้อง
คำจำกัดสิทธิ์ความรับผิดชอบ
ข้อมูลและบทความไม่ได้มีวัตถุประสงค์เพื่อก่อให้เกิดกิจกรรมทางการเงิน, การลงทุน, การซื้อขาย, ข้อเสนอแนะ หรือคำแนะนำประเภทอื่น ๆ ที่ให้หรือรับรองโดย TradingView อ่านเพิ่มเติมใน ข้อกำหนดการใช้งาน