Breakout from Falling Channel with Strong Reversal in BSE Ltd
 BSE
BSE
📈Pattern & Setup:
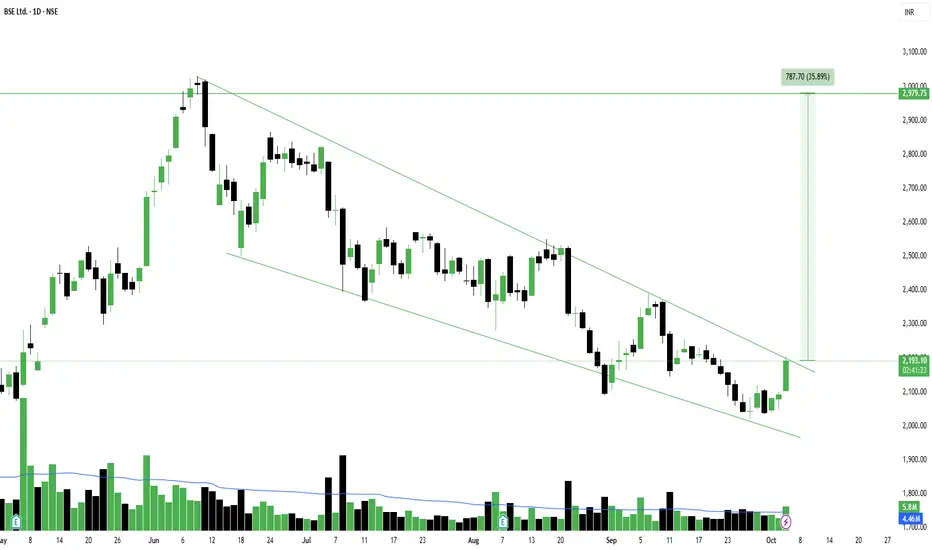
The stock has broken out from a well-defined falling channel pattern on the daily chart after a multi-week correction. This type of setup often signals the end of a profit-booking phase and the start of a new bullish swing.
The breakout candle is strong and backed by a noticeable rise in volume — a clear sign of buying interest returning at lower levels. The prior downtrend also shows tapering volume, confirming selling exhaustion.
📝 Trade Plan:
Entry: Current levels (2,180–2,200) look ideal for early breakout entry.
🚩Stop-Loss: 2,050 (below the channel’s lower support).
🎯Targets:
Target 1 → 2,550 (intermediate resistance zone).
Target 2 → 2,980 (measured move of the falling channel breakout, around 35% potential upside).
💡Pyramiding Strategy:
1. Enter first lot around 2,180–2,200.
2. Add above 2,350 once breakout continuation confirms, trail SL to 2,150.
3. Add final lot above 2,550, trail SL to 2,350.
Stay with the trend as long as price sustains above 2,100.
🧠Logic Behind Selecting this Trade:
This setup showcases a **classic falling channel breakout** — where price consolidates in a downward sloping pattern, forming lower highs and lows, then breaks out sharply with volume. The breakout candle indicates strong accumulation after a long decline, hinting at a potential reversal phase.
A sustained move above 2,350 would further confirm momentum strength and could push the stock towards 3,000 levels.
Keep Learning. Keep Earning.
Let's grow together 📚🎯
🔴Disclaimer:
This is not an investment advice. Always do your own due diligence before making any trading or investment decision.
📈Pattern & Setup:
The stock has broken out from a well-defined falling channel pattern on the daily chart after a multi-week correction. This type of setup often signals the end of a profit-booking phase and the start of a new bullish swing.
The breakout candle is strong and backed by a noticeable rise in volume — a clear sign of buying interest returning at lower levels. The prior downtrend also shows tapering volume, confirming selling exhaustion.
📝 Trade Plan:
Entry: Current levels (2,180–2,200) look ideal for early breakout entry.
🚩Stop-Loss: 2,050 (below the channel’s lower support).
🎯Targets:
Target 1 → 2,550 (intermediate resistance zone).
Target 2 → 2,980 (measured move of the falling channel breakout, around 35% potential upside).
💡Pyramiding Strategy:
1. Enter first lot around 2,180–2,200.
2. Add above 2,350 once breakout continuation confirms, trail SL to 2,150.
3. Add final lot above 2,550, trail SL to 2,350.
Stay with the trend as long as price sustains above 2,100.
🧠Logic Behind Selecting this Trade:
This setup showcases a **classic falling channel breakout** — where price consolidates in a downward sloping pattern, forming lower highs and lows, then breaks out sharply with volume. The breakout candle indicates strong accumulation after a long decline, hinting at a potential reversal phase.
A sustained move above 2,350 would further confirm momentum strength and could push the stock towards 3,000 levels.
Keep Learning. Keep Earning.
Let's grow together 📚🎯
🔴Disclaimer:
This is not an investment advice. Always do your own due diligence before making any trading or investment decision.
TrendX INC
การนำเสนอที่เกี่ยวข้อง
คำจำกัดสิทธิ์ความรับผิดชอบ
ข้อมูลและบทความไม่ได้มีวัตถุประสงค์เพื่อก่อให้เกิดกิจกรรมทางการเงิน, การลงทุน, การซื้อขาย, ข้อเสนอแนะ หรือคำแนะนำประเภทอื่น ๆ ที่ให้หรือรับรองโดย TradingView อ่านเพิ่มเติมที่ ข้อกำหนดการใช้งาน
TrendX INC
การนำเสนอที่เกี่ยวข้อง
คำจำกัดสิทธิ์ความรับผิดชอบ
ข้อมูลและบทความไม่ได้มีวัตถุประสงค์เพื่อก่อให้เกิดกิจกรรมทางการเงิน, การลงทุน, การซื้อขาย, ข้อเสนอแนะ หรือคำแนะนำประเภทอื่น ๆ ที่ให้หรือรับรองโดย TradingView อ่านเพิ่มเติมที่ ข้อกำหนดการใช้งาน