🚀 Breakout Stock Alert: BASF India Ltd (BASF)
📌 Price: ₹4,902.90 📊 Volume: 138.03K 📅 Date: 19-05-2025
① Pattern Name, Timeframe, Structure & Explanation
Daily Timeframe: Rectangle Base Pattern (5 Months)
Weekly Timeframe: Base Formation in Uptrend
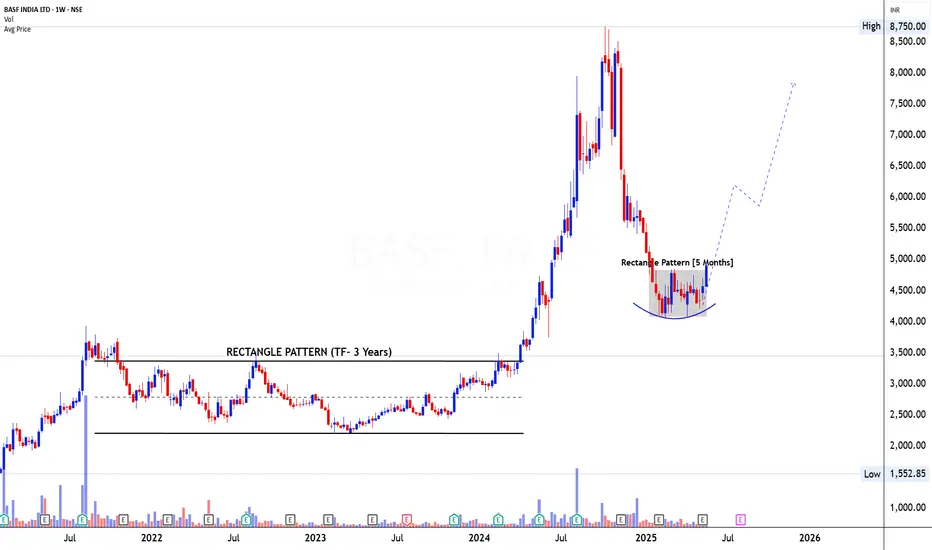
On the daily chart, BASF has been coiling inside a rectangle consolidation pattern between ₹4,300–₹4,800 for nearly 5 months. The base is tight, with volatility compression and a subtle rounding shape at the lower support, hinting at accumulation. The recent breakout from this rectangle comes on the back of strong bullish action with increasing range and volume — indicating supply absorption and demand dominance.
On the weekly chart, this move gains even more significance. BASF had spent nearly 3 years (2021–2023) inside a broad rectangle, eventually giving a massive upside breakout in 2024. The recent pullback post-highs around ₹8,750 has now rounded out into a basing structure — potentially forming the right side of a new base, suggesting a continuation of the broader uptrend.
② Volume Formation (During Pattern, Breakout, and Retest)
Daily Timeframe: Volume remained muted within the rectangle, showing lack of interest during the base — a common trait in high-quality accumulation phases. The breakout candle on 19 May shows volume spike to 138K, far above the base average, confirming institutional buying interest.
Weekly Timeframe: Volume clearly dried up during the correction phase post-2024 top, and has now started building up again as price reclaims previous support-turned-base zones.
③ Breakout Candlestick, Follow-Through & Trap Behavior
Breakout Candle (Daily): A wide-range, full-bodied bullish candle with gap-up characteristics and a +7.2% move, backed by a sharp volume surge — textbook breakout behavior
Follow-Through Watch: The stock may now retest the breakout zone of ₹4,750–₹4,800. A low-volume pullback would offer a healthy re-entry.
Trap Behavior: No signs of fakeouts or premature breakdowns. The rectangle was tight and clean — this breakout appears genuine and well-structured.
④ Trade Explanation (Entry, Target, Stop-loss, Risk\:Reward)
Entry Zone: ₹4,880–₹4,950 (near breakout close or minor dip)
Stop-loss: ₹4,600 (below rectangle low and base support)
*Target Zone: ₹6,200 (initial), ₹7,200–₹7,500 (long-term structure)
📏 Measured Move (Rectangle Range):
Range = ₹4,800 - ₹4,300 = ₹500
Target = ₹4,800 + ₹500 = ₹5,300 (short-term)
But considering weekly rounding base, extended moves toward ₹6,200+ are probable.
Risk\:Reward Analysis:
Risk = ₹350
Reward = ₹1,200–₹2,300
R\:R = \~1:3.4 to 1:6.5
#Trading #Investing #Stocks #TechnicalAnalysis
📌 Price: ₹4,902.90 📊 Volume: 138.03K 📅 Date: 19-05-2025
① Pattern Name, Timeframe, Structure & Explanation
Daily Timeframe: Rectangle Base Pattern (5 Months)
Weekly Timeframe: Base Formation in Uptrend
On the daily chart, BASF has been coiling inside a rectangle consolidation pattern between ₹4,300–₹4,800 for nearly 5 months. The base is tight, with volatility compression and a subtle rounding shape at the lower support, hinting at accumulation. The recent breakout from this rectangle comes on the back of strong bullish action with increasing range and volume — indicating supply absorption and demand dominance.
On the weekly chart, this move gains even more significance. BASF had spent nearly 3 years (2021–2023) inside a broad rectangle, eventually giving a massive upside breakout in 2024. The recent pullback post-highs around ₹8,750 has now rounded out into a basing structure — potentially forming the right side of a new base, suggesting a continuation of the broader uptrend.
② Volume Formation (During Pattern, Breakout, and Retest)
Daily Timeframe: Volume remained muted within the rectangle, showing lack of interest during the base — a common trait in high-quality accumulation phases. The breakout candle on 19 May shows volume spike to 138K, far above the base average, confirming institutional buying interest.
Weekly Timeframe: Volume clearly dried up during the correction phase post-2024 top, and has now started building up again as price reclaims previous support-turned-base zones.
③ Breakout Candlestick, Follow-Through & Trap Behavior
Breakout Candle (Daily): A wide-range, full-bodied bullish candle with gap-up characteristics and a +7.2% move, backed by a sharp volume surge — textbook breakout behavior
Follow-Through Watch: The stock may now retest the breakout zone of ₹4,750–₹4,800. A low-volume pullback would offer a healthy re-entry.
Trap Behavior: No signs of fakeouts or premature breakdowns. The rectangle was tight and clean — this breakout appears genuine and well-structured.
④ Trade Explanation (Entry, Target, Stop-loss, Risk\:Reward)
Entry Zone: ₹4,880–₹4,950 (near breakout close or minor dip)
Stop-loss: ₹4,600 (below rectangle low and base support)
*Target Zone: ₹6,200 (initial), ₹7,200–₹7,500 (long-term structure)
📏 Measured Move (Rectangle Range):
Range = ₹4,800 - ₹4,300 = ₹500
Target = ₹4,800 + ₹500 = ₹5,300 (short-term)
But considering weekly rounding base, extended moves toward ₹6,200+ are probable.
Risk\:Reward Analysis:
Risk = ₹350
Reward = ₹1,200–₹2,300
R\:R = \~1:3.4 to 1:6.5
#Trading #Investing #Stocks #TechnicalAnalysis
Learn Today for Better Tomorrow
คำจำกัดสิทธิ์ความรับผิดชอบ
ข้อมูลและบทความไม่ได้มีวัตถุประสงค์เพื่อก่อให้เกิดกิจกรรมทางการเงิน, การลงทุน, การซื้อขาย, ข้อเสนอแนะ หรือคำแนะนำประเภทอื่น ๆ ที่ให้หรือรับรองโดย TradingView อ่านเพิ่มเติมใน ข้อกำหนดการใช้งาน
Learn Today for Better Tomorrow
คำจำกัดสิทธิ์ความรับผิดชอบ
ข้อมูลและบทความไม่ได้มีวัตถุประสงค์เพื่อก่อให้เกิดกิจกรรมทางการเงิน, การลงทุน, การซื้อขาย, ข้อเสนอแนะ หรือคำแนะนำประเภทอื่น ๆ ที่ให้หรือรับรองโดย TradingView อ่านเพิ่มเติมใน ข้อกำหนดการใช้งาน