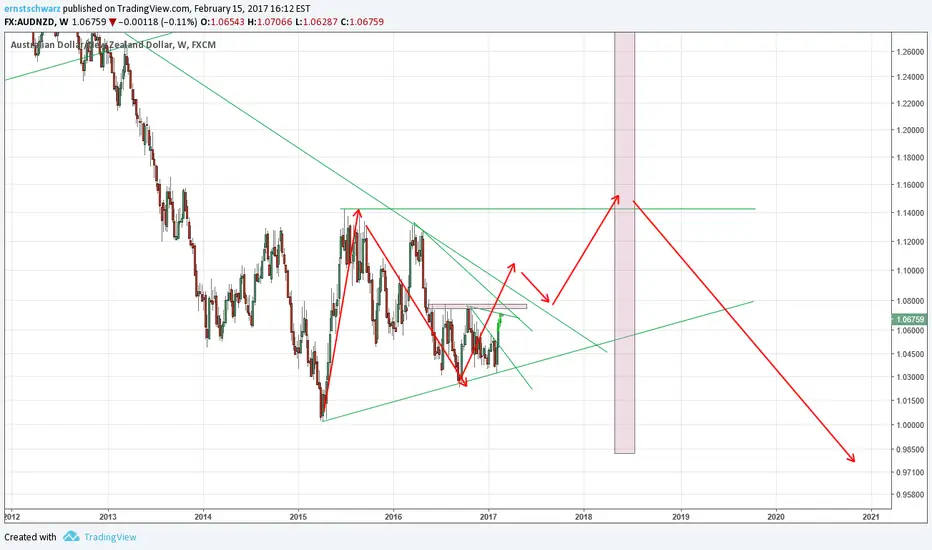
Let s assume a 3 wave corrective structure for more downside.
Easiest is to assume that the first high is taken and then downside.
I have a time prediction projected in the chart for a big change to come.
Let me know what you think.
Easiest is to assume that the first high is taken and then downside.
I have a time prediction projected in the chart for a big change to come.
Let me know what you think.
บันทึก
Please keep in mind that this Chart / arrows in the chart represent an corrective structure in development.The first red up-arrow could be an impulse move to the upside and believing this would lead to a different expectation!
บันทึก
Here is the same chart with additional alternative scenario (blue arrows, suggesting we are no longer in the bigger correction)คำจำกัดสิทธิ์ความรับผิดชอบ
ข้อมูลและบทความไม่ได้มีวัตถุประสงค์เพื่อก่อให้เกิดกิจกรรมทางการเงิน, การลงทุน, การซื้อขาย, ข้อเสนอแนะ หรือคำแนะนำประเภทอื่น ๆ ที่ให้หรือรับรองโดย TradingView อ่านเพิ่มเติมที่ ข้อกำหนดการใช้งาน
คำจำกัดสิทธิ์ความรับผิดชอบ
ข้อมูลและบทความไม่ได้มีวัตถุประสงค์เพื่อก่อให้เกิดกิจกรรมทางการเงิน, การลงทุน, การซื้อขาย, ข้อเสนอแนะ หรือคำแนะนำประเภทอื่น ๆ ที่ให้หรือรับรองโดย TradingView อ่านเพิ่มเติมที่ ข้อกำหนดการใช้งาน