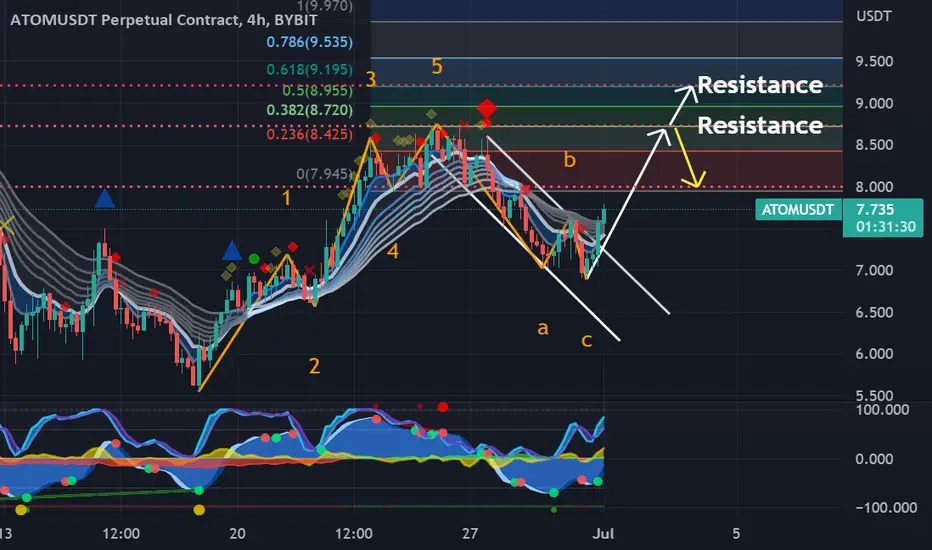
After completing Wave C with a double bottom, Atom bounced strong out of this falling channel. These are next two resistance zones that Atom has to break. If we break the first Fib resistance (.382), I expect it to shoot to the .618 fib extension. Momentum has just printed a green dot which is indicating an upward continuation of this breakout.
This chart based off of The Elliot Wave Theory, Fibonacci, EMA’s, MacD , RSI , Momentum, and resistance/support zones combined with patterns.
This chart based off of The Elliot Wave Theory, Fibonacci, EMA’s, MacD , RSI , Momentum, and resistance/support zones combined with patterns.
คำจำกัดสิทธิ์ความรับผิดชอบ
ข้อมูลและบทความไม่ได้มีวัตถุประสงค์เพื่อก่อให้เกิดกิจกรรมทางการเงิน, การลงทุน, การซื้อขาย, ข้อเสนอแนะ หรือคำแนะนำประเภทอื่น ๆ ที่ให้หรือรับรองโดย TradingView อ่านเพิ่มเติมที่ ข้อกำหนดการใช้งาน
คำจำกัดสิทธิ์ความรับผิดชอบ
ข้อมูลและบทความไม่ได้มีวัตถุประสงค์เพื่อก่อให้เกิดกิจกรรมทางการเงิน, การลงทุน, การซื้อขาย, ข้อเสนอแนะ หรือคำแนะนำประเภทอื่น ๆ ที่ให้หรือรับรองโดย TradingView อ่านเพิ่มเติมที่ ข้อกำหนดการใช้งาน