APT has been trading sideways for the past 248 days, building a massive base of consolidation. Things are starting to get interesting.
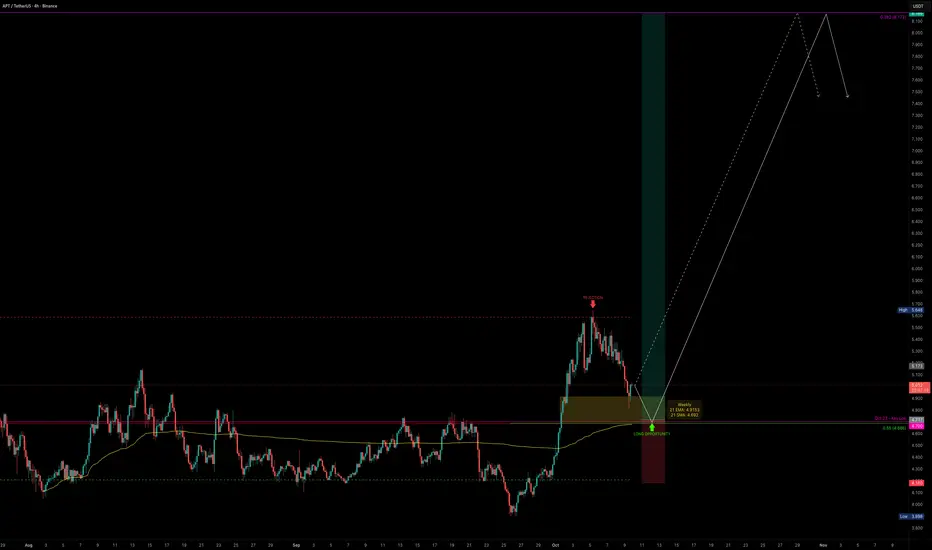
Recently, APT made its first real attempt to break above the yearly VWAP core (~$5.6) but got rejected, completing a 5-wave impulse right at this resistance zone. The rejection was no surprise: it lined up perfectly with the VAH of the 248-day trading range and the 4B market cap resistance at $5.69.
Now, after a strong impulse, we are in correction mode and this could set up the next major swing long opportunity.
🟢 Support Confluence Zone ($5.0–$4.5)
All confluences point to this being a critical support zone that bulls must defend.
🔴 Resistance Zone ($5.6–$5.7)
This zone remains the big wall to break. Once cleared with strong volume, upside potential opens significantly.
Freshly built (unpublished) Anchored VWAP Suite [SiDec], which provides VWAP tracking:

Fair Value Trend Model [SiDec]:

Trade Setup
Quick Take
APT is sitting at one of the most important support zones of the year. If this base holds, it sets up a high-probability swing long with great upside potential. All eyes are on whether bulls can reclaim momentum and finally break through the $5.7 wall.
🔍 Indicators used
➡️ Available for free. You can find it on my profile under “Scripts” and apply it directly to your charts for extra confluence when planning your trades.
_________________________________
💬 If you found this helpful, drop a like and comment!
Recently, APT made its first real attempt to break above the yearly VWAP core (~$5.6) but got rejected, completing a 5-wave impulse right at this resistance zone. The rejection was no surprise: it lined up perfectly with the VAH of the 248-day trading range and the 4B market cap resistance at $5.69.
Now, after a strong impulse, we are in correction mode and this could set up the next major swing long opportunity.
🟢 Support Confluence Zone ($5.0–$4.5)
- POC of 248-day range: $4.685
- Anchored VWAP (from Aug low): sits right at the POC
- Key Low (Oct 2023): $4.70
- 0.55 Fib retracement (of 5-wave impulse): $4.686
- 21 Daily EMA/SMA: $4.847 / $4.7
- 21 Weekly EMA/SMA: $4.915 / $4.69
- 200 4H EMA/SMA: $4.7 / $4.582
All confluences point to this being a critical support zone that bulls must defend.
🔴 Resistance Zone ($5.6–$5.7)
- Yearly VWAP core (~$5.6)
- VAH of 248-day range (~$5.6)
- 4B Market Cap resistance (~$5.69)
This zone remains the big wall to break. Once cleared with strong volume, upside potential opens significantly.
Freshly built (unpublished) Anchored VWAP Suite [SiDec], which provides VWAP tracking:
Fair Value Trend Model [SiDec]:
Trade Setup
- Long Entry: Ladder between $5.0–$4.5
- Invalidation: Below VAL of range
- Targets: $5.7 (major resistance), $7 (Fair Value), $8.172 (0.382 Fib)
- Potential swing setup with R:R of 1:6+
- Possible gain of +70% if structure holds and volume confirms breakout
Quick Take
APT is sitting at one of the most important support zones of the year. If this base holds, it sets up a high-probability swing long with great upside potential. All eyes are on whether bulls can reclaim momentum and finally break through the $5.7 wall.
🔍 Indicators used
- Multi Timeframe 8x MA Support Resistance Zones [SiDec] → to identify support and resistance zones such as the weekly 21 EMA/SMA.
- Fair Value Trend Model [SiDec] → Calculates a regression-based fair value curve
➡️ Available for free. You can find it on my profile under “Scripts” and apply it directly to your charts for extra confluence when planning your trades.
_________________________________
💬 If you found this helpful, drop a like and comment!
🏆 Mastering Fibonacci for precision trading
🔹 Sharing high-probability trade setups
⚡ Unlock the power of technical analysis!
🔹 Sharing high-probability trade setups
⚡ Unlock the power of technical analysis!
คำจำกัดสิทธิ์ความรับผิดชอบ
ข้อมูลและบทความไม่ได้มีวัตถุประสงค์เพื่อก่อให้เกิดกิจกรรมทางการเงิน, การลงทุน, การซื้อขาย, ข้อเสนอแนะ หรือคำแนะนำประเภทอื่น ๆ ที่ให้หรือรับรองโดย TradingView อ่านเพิ่มเติมที่ ข้อกำหนดการใช้งาน