APL Apollo Tubes Ltd – Weekly Chart Update: Breakout from Multi-Period Consolidation
Technical Structure:
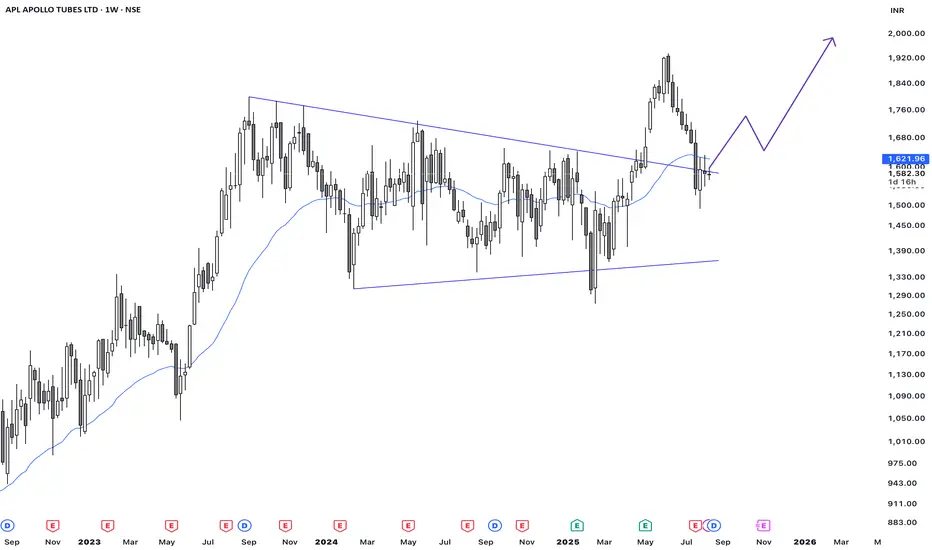
The chart clearly shows a long consolidation between early 2023 and mid‑2025, bounded by converging trend lines forming a symmetrical wedge/triangle.
Recently, price decisively broke above the upper trendline, accompanied by a volume spike, signaling a classic bullish breakout scenario. A subsequent retest of the breakout zone (~₹1,580–1,600) appears to be underway—buyers holding this zone could pave the way for a continued rally .
Potential Targets and Setup:
• Entry Zone: Weekly close above 34 week moving average
• SL on entry: 1485
• First target: 1900
• If momentum sustains, keep trailing SL
• Invalidation: SL is hit or any opposing bearish signal on chart
Fundamentals:
• The technical breakout aligns with healthy fundamentals—strong ROCE/ROE and sustained revenue growth.
• Though valuations are rich (P/E ~55x, P/B ~10x), the quality of earnings and performance metrics justify the multiple.
Technical Structure:
The chart clearly shows a long consolidation between early 2023 and mid‑2025, bounded by converging trend lines forming a symmetrical wedge/triangle.
Recently, price decisively broke above the upper trendline, accompanied by a volume spike, signaling a classic bullish breakout scenario. A subsequent retest of the breakout zone (~₹1,580–1,600) appears to be underway—buyers holding this zone could pave the way for a continued rally .
Potential Targets and Setup:
• Entry Zone: Weekly close above 34 week moving average
• SL on entry: 1485
• First target: 1900
• If momentum sustains, keep trailing SL
• Invalidation: SL is hit or any opposing bearish signal on chart
Fundamentals:
• The technical breakout aligns with healthy fundamentals—strong ROCE/ROE and sustained revenue growth.
• Though valuations are rich (P/E ~55x, P/B ~10x), the quality of earnings and performance metrics justify the multiple.
คำจำกัดสิทธิ์ความรับผิดชอบ
ข้อมูลและบทความไม่ได้มีวัตถุประสงค์เพื่อก่อให้เกิดกิจกรรมทางการเงิน, การลงทุน, การซื้อขาย, ข้อเสนอแนะ หรือคำแนะนำประเภทอื่น ๆ ที่ให้หรือรับรองโดย TradingView อ่านเพิ่มเติมใน ข้อกำหนดการใช้งาน
คำจำกัดสิทธิ์ความรับผิดชอบ
ข้อมูลและบทความไม่ได้มีวัตถุประสงค์เพื่อก่อให้เกิดกิจกรรมทางการเงิน, การลงทุน, การซื้อขาย, ข้อเสนอแนะ หรือคำแนะนำประเภทอื่น ๆ ที่ให้หรือรับรองโดย TradingView อ่านเพิ่มเติมใน ข้อกำหนดการใช้งาน