Bullish structure : ADVENZYMES - Ascending Triangle
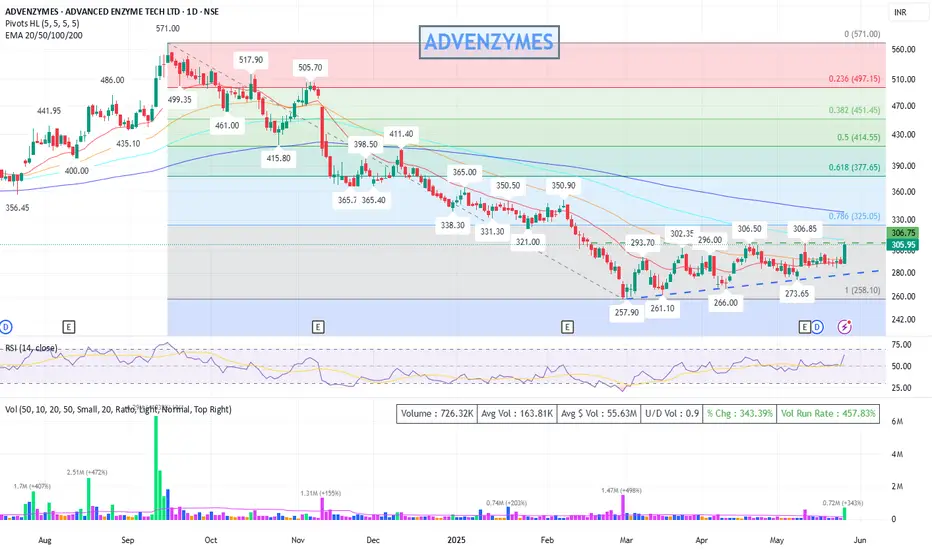
### 🧾 **Chart Type & Time Frame**
* **Daily Candlestick Chart** (1D)
* **Exchange**: NSE (India)
* **Latest Price**: ₹305.95 (+6.12% on the day)
* **Volume**: 726.33K (well above average — **457.83%** Volume Run Rate)
---
### 📉 **Trend Analysis**
* **Primary Trend**: Downtrend from ₹517.90 (high in Nov 2024) to a bottom around ₹257.90 (March 2025).
* **Current Action**: Price is showing a **potential reversal** from a long downtrend.
* **Higher Lows Pattern**: Since the bottom at ₹257.90, price has made:
* ₹261.10 → ₹266.00 → ₹273.65 → ₹306.85 → (Now breaking above ₹306.75)
This forms an **ascending triangle** pattern (bullish bias).
---
### 📊 **Indicators & Overlays**
#### 1. **Moving Averages (EMA)**
* EMA levels:
* EMA-20: ₹290.07
* EMA-50: ₹292.01
* EMA-100: ₹310.17
* EMA-200: ₹337.89
**Current price (₹305.95)** is:
* Above EMA-20 & EMA-50 → Short-term bullish
* Slightly below EMA-100 and EMA-200 → Mid-to-long term resistance still ahead
If it breaks and sustains above EMA-100 & EMA-200, stronger uptrend confirmation.
---
#### 2. **Fibonacci Retracement (from ₹571 to ₹258)**
* **Key levels:**
* 23.6% → ₹497.15
* 38.2% → ₹451.45
* 50% → ₹414.55
* 61.8% → ₹377.65
* 78.6% → ₹325.05 *(Immediate target zone)*
**Price approaching 78.6% retracement (₹325.05)**, which is a key resistance zone. A breakout here can push prices towards ₹337-₹350 zone.
---
#### 3. **RSI (14, Close)**
* Current RSI: **\~62.90**
* Moving above the 60 level, indicating building bullish momentum.
* Still not overbought (>70), room for upward move exists.
---
#### 4. **Volume**
* Spike in volume on the breakout day → Strong confirmation.
* Today's volume: **726.33K** vs average 163.81K → Over **4x average**.
---
### 📌 **Support & Resistance Levels**
#### Key Resistance:
* ₹306.85 (recent swing high) → **Broken today**
* ₹325.05 (Fibo 78.6%)
* ₹337.89 (EMA-200)
* ₹350–365 (previous price clusters)
#### Key Support:
* ₹293–296 (previous resistance, now support)
* ₹273.65 (swing low)
* ₹258 (Fibo 100% level)
---
### 🔺 **Pattern Observed**
* **Ascending Triangle** breakout confirmed with high volume
* Bullish structure: Higher lows with flat resistance (₹306 zone)
* If price sustains above ₹306, could target ₹325–₹350 short term
---
### 🔮 **Conclusion & View**
✅ **Bullish Bias in Short Term**
* Breakout of important level with strong volume
* RSI supportive
* EMA crossovers may follow if trend continues
📈 **Short-Term Target**: ₹325 → ₹337 → ₹350
📉 **Stop Loss**: ₹293 or ₹280 (based on risk appetite)
📌 Disclaimer: This analysis is for educational and informational purposes only and does not constitute investment advice. Please do your own research or consult with a financial advisor before making any trading decisions. Markets are subject to risks.
การซื้อขายยังคงดำเนินอยู่
📈 **Short-Term Target Update**: ₹325(First Target Achieved) → ₹337 → ₹350📉 **Stop Loss**: ₹293 or ₹306 (Revise based on risk appetite)
คำจำกัดสิทธิ์ความรับผิดชอบ
ข้อมูลและบทความไม่ได้มีวัตถุประสงค์เพื่อก่อให้เกิดกิจกรรมทางการเงิน, การลงทุน, การซื้อขาย, ข้อเสนอแนะ หรือคำแนะนำประเภทอื่น ๆ ที่ให้หรือรับรองโดย TradingView อ่านเพิ่มเติมใน ข้อกำหนดการใช้งาน
คำจำกัดสิทธิ์ความรับผิดชอบ
ข้อมูลและบทความไม่ได้มีวัตถุประสงค์เพื่อก่อให้เกิดกิจกรรมทางการเงิน, การลงทุน, การซื้อขาย, ข้อเสนอแนะ หรือคำแนะนำประเภทอื่น ๆ ที่ให้หรือรับรองโดย TradingView อ่านเพิ่มเติมใน ข้อกำหนดการใช้งาน