Local Analysis / Targets / Elliot Wave
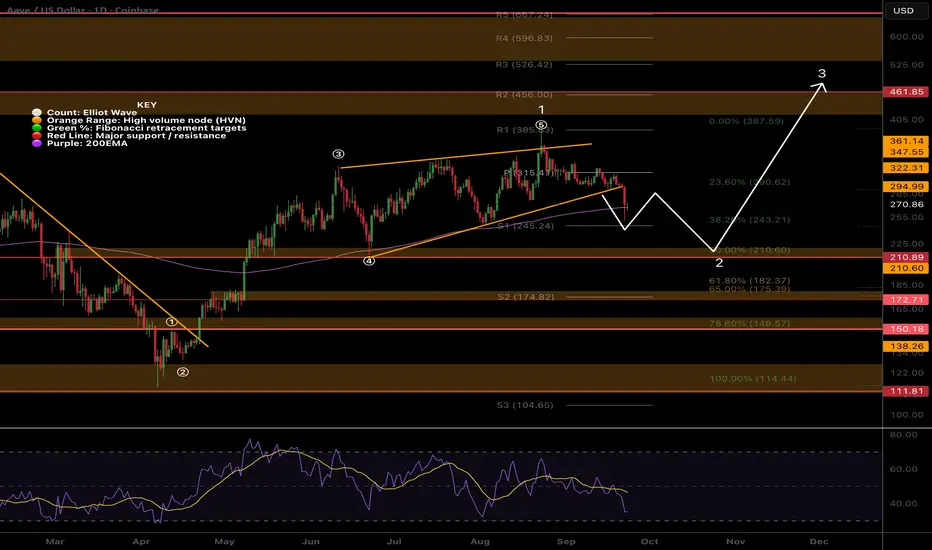
 AAVE broke down out of the wave (5) of 1 wedge per my previous analysis reaching the paths first target to find support the daily 200EMA and S1 pivot point. If price continues lower I expect it to bounce first before delivering a final thrust down in wave C of 2.
The major support High Volume Node, $210, is the target at the 0.5 Fibonacci retracement. Further breakdown brings up the golden pocket and S2 pivot, $175, and the alt-coin ‘golden pocket’ sits at $149 the 0.786 Fibonacci retracement. This is the most common area for alt-coin pull backs to terminate and a characteristic area for low volume, highly volatile assets in general due to the psychology as I discuss on my Fibonacci tutorial on YouTube.
RSI is making its way down into oversold but has plenty of room to fall with no bullish divergence yet.
Standard Deviation Band Analysis
Standard deviation bands are non-normally distributed unlike the renko chart shared in yesterdays report when time is removed. Price continues to spend way to much time at extremes with fast movement through the fait value zone. Bands are shifting significantly positive as time goes on due to price spending so much time in th eupper boundaries. This is a good sign of strength, dips remain shallow showing strong demand.
Price is testing the SD+2 threshold as support now and losing this would bring up the next target of the fair value regression line at $150 which adds confluence to the alt-coin ‘golden pocket’ targets in the technical analysis.
Safe trading
PhD Candidate: Investing, Sentiment & Social Mood
MSc Financial Econ
Technical Analyst 7 years
Trader / Investor 14 years
DeTrended Metrics Report (Free): detrended.substack.com
Members Only Trading Signals: tradesignals.substack.com
MSc Financial Econ
Technical Analyst 7 years
Trader / Investor 14 years
DeTrended Metrics Report (Free): detrended.substack.com
Members Only Trading Signals: tradesignals.substack.com
คำจำกัดสิทธิ์ความรับผิดชอบ
ข้อมูลและบทความไม่ได้มีวัตถุประสงค์เพื่อก่อให้เกิดกิจกรรมทางการเงิน, การลงทุน, การซื้อขาย, ข้อเสนอแนะ หรือคำแนะนำประเภทอื่น ๆ ที่ให้หรือรับรองโดย TradingView อ่านเพิ่มเติมที่ ข้อกำหนดการใช้งาน