Superchart: ทุกสิ่งที่คุณจำเป็นต้องรู้
Supercharts คือเสาหลักของ TradingView ซึ่งช่วยให้คุณสามารถติดตามการเปลี่ยนแปลงของราคา อ่านอินดิเคเตอร์ ใช้เครื่องมือวาดภาพ และดูคุณสมบัติอื่นๆ เช่น ตัวคัดกรองหุ้น และข่าวสารต่างๆ เพื่อประสบการณ์ในการวิเคราะห์ทางการเงินที่ครบถ้วน นอกจากนี้ คุณยังสามารถฝึกฝนในการซื้อขายและทำการซื้อขายจริงผ่านโบรกเกอร์ที่เชื่อถือได้ของเราได้จากพื้นที่ซื้อขายส่วนตัวของคุณ เนื้อหา:
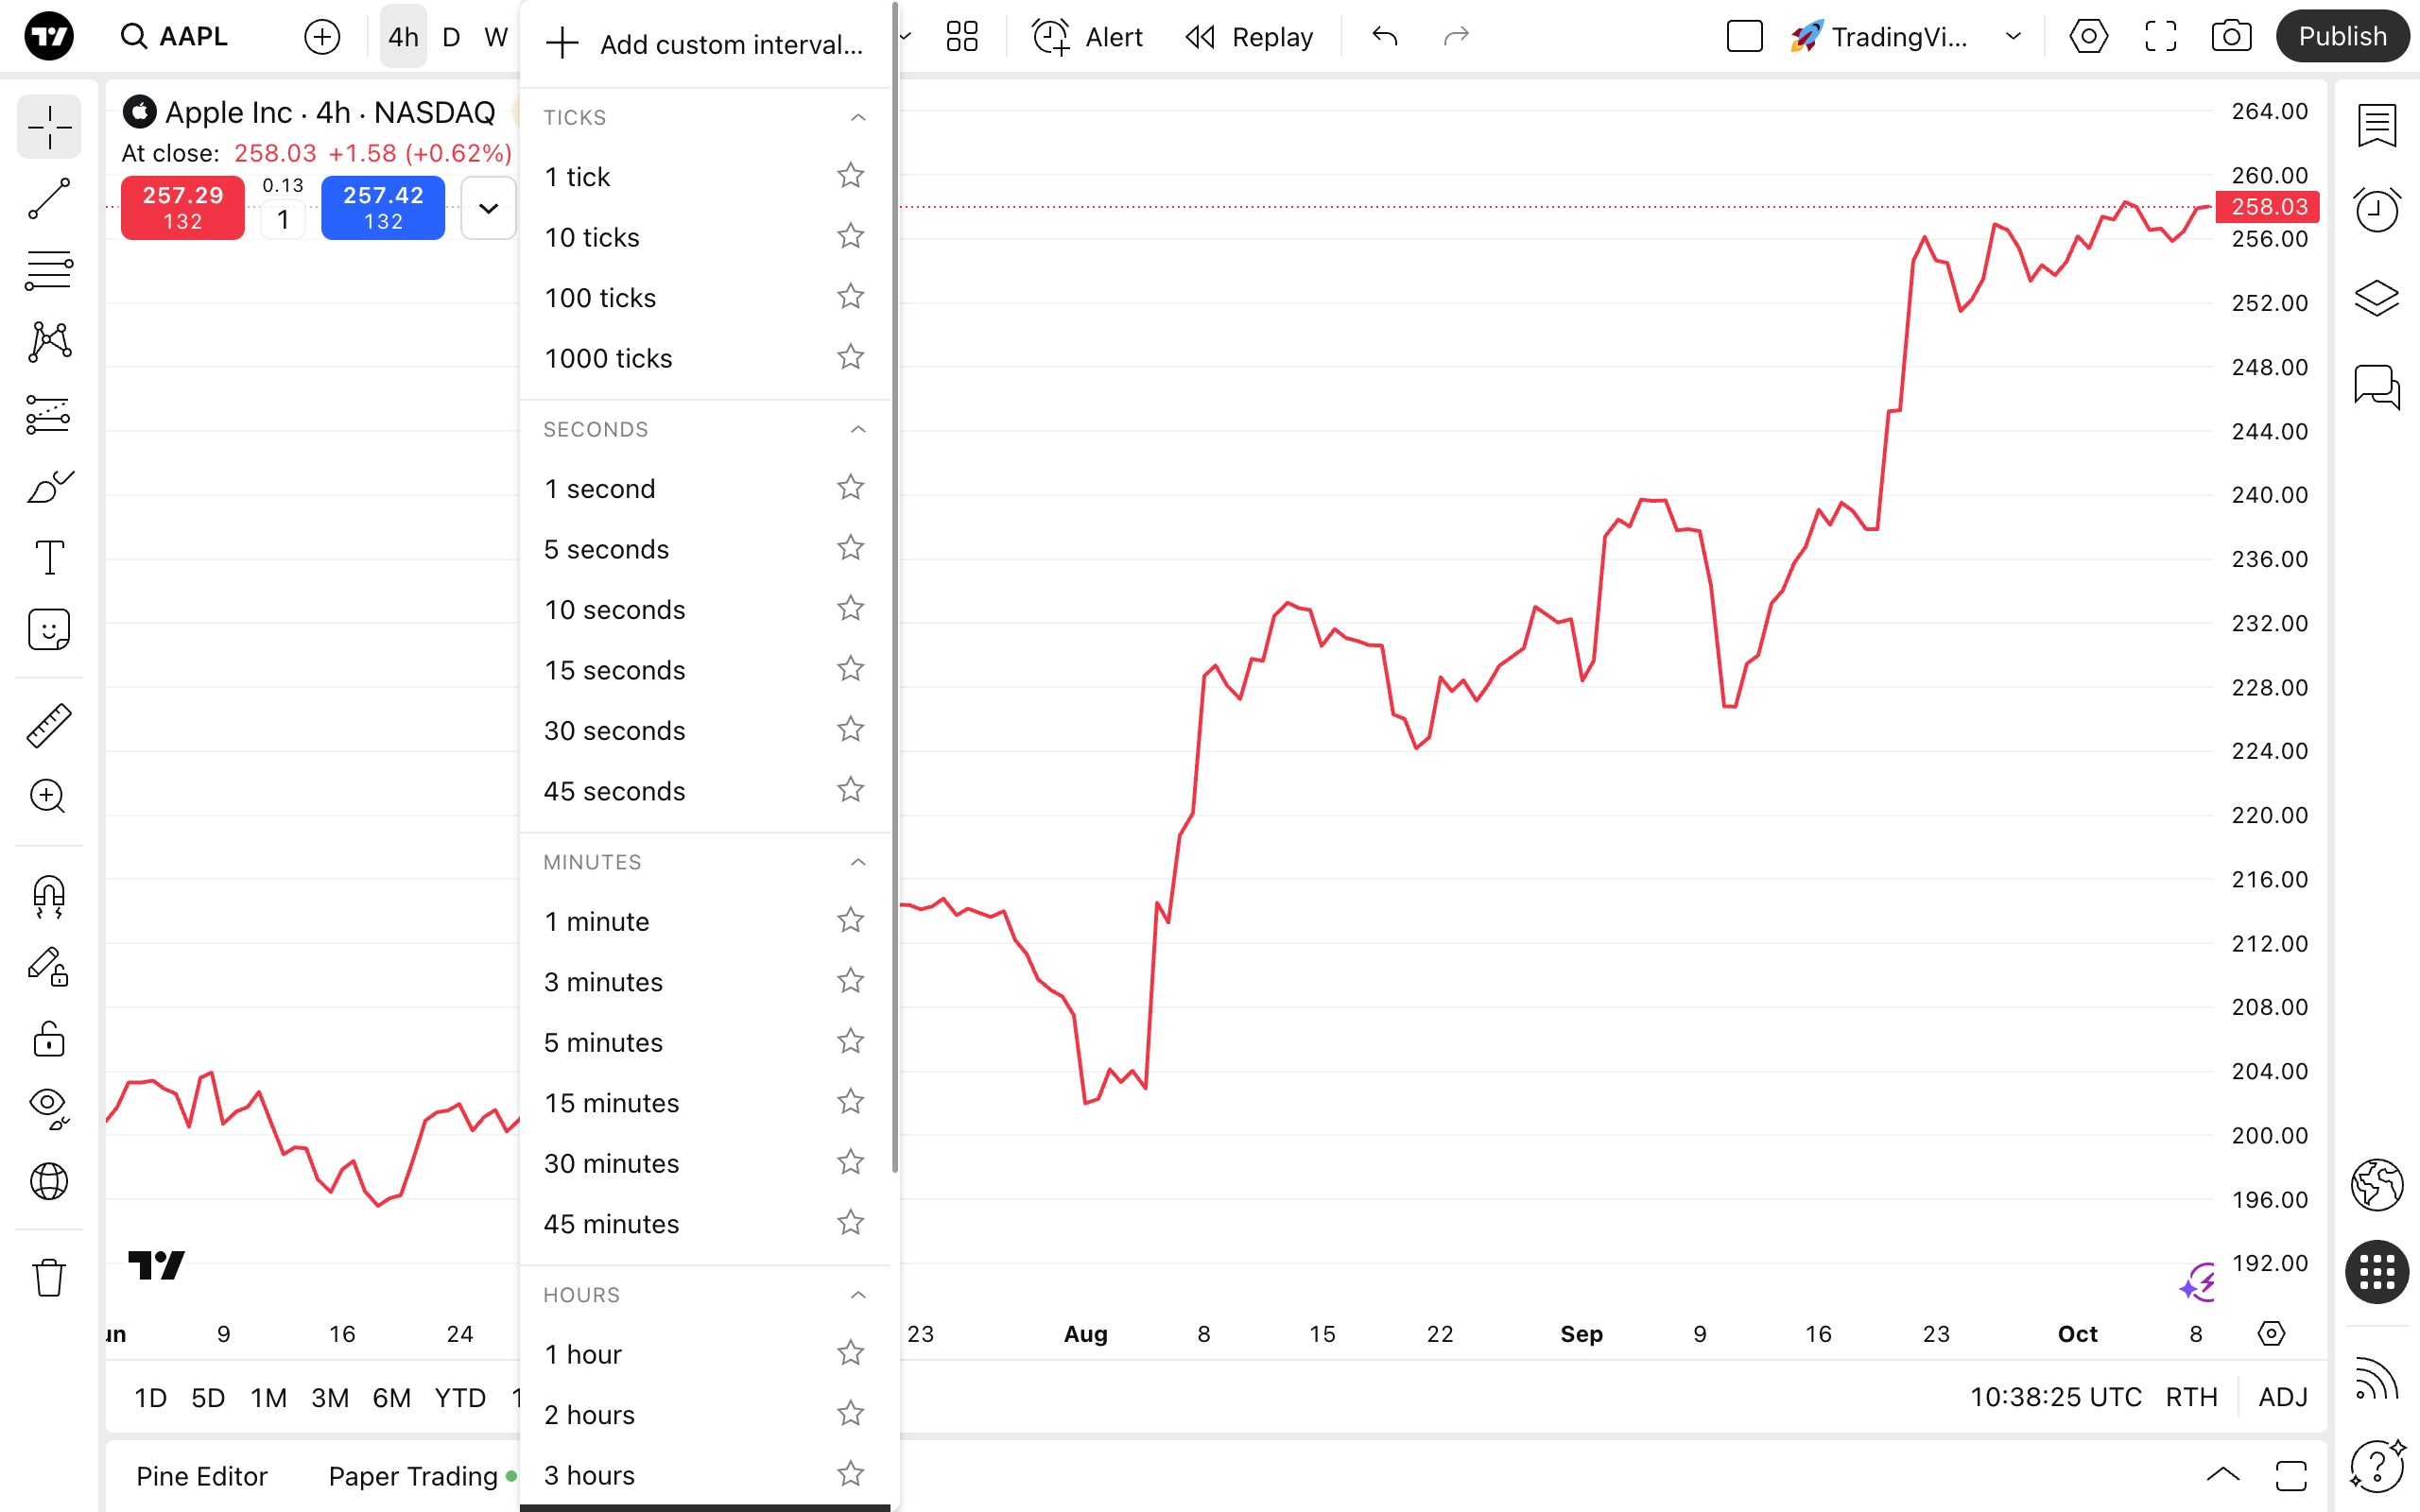
 ช่วงเวลาแต่ละช่วงเวลาแสดงถึง "ก้าว" ของราคาในเวลา ซึ่งอาจเป็นเวลาตั้งแต่หนึ่งวินาทีไปจนถึงหลายเดือน ขึ้นอยู่กับประเภทของชาร์ต โดยแต่ละประเภทมีวิธีการแสดงภาพที่เป็นเอกลักษณ์ ช่วงเวลาจะถูกแสดงออกมาเป็นแท่ง แท่งเทียน ฯลฯหากคุณใช้ ชาร์ตเส้น เส้นนั้นจะถูกสร้างขึ้นโดยการเชื่อมโยงราคาภายในช่วงเวลาที่เลือก สำหรับ บาร์ชาร์ต หรือ ชาร์ตแท่งเทียน บาร์หรือแท่งเทียนแต่ละแท่งจะแสดงราคาในช่วงเวลาที่กำหนดนั้นๆ
 ด้วย อินดิเคเตอร์เทมเพลต คุณสามารถบันทึกอินดิเคเตอร์ที่คุณเลือกเพื่อใช้ในภายหลังได้ เมื่อบันทึกแล้วคุณยังสามารถจดจำสัญลักษณ์และช่วงเวลาได้ ดังนั้นคุณสามารถโหลดพร้อมกันกับเทมเพลตได้ คลิก "เปิดเทมเพลต" เพื่อดูหน้าต่าง "อินดิเคเตอร์เทมเพลต" และจัดการเทมเพลตของคุณ
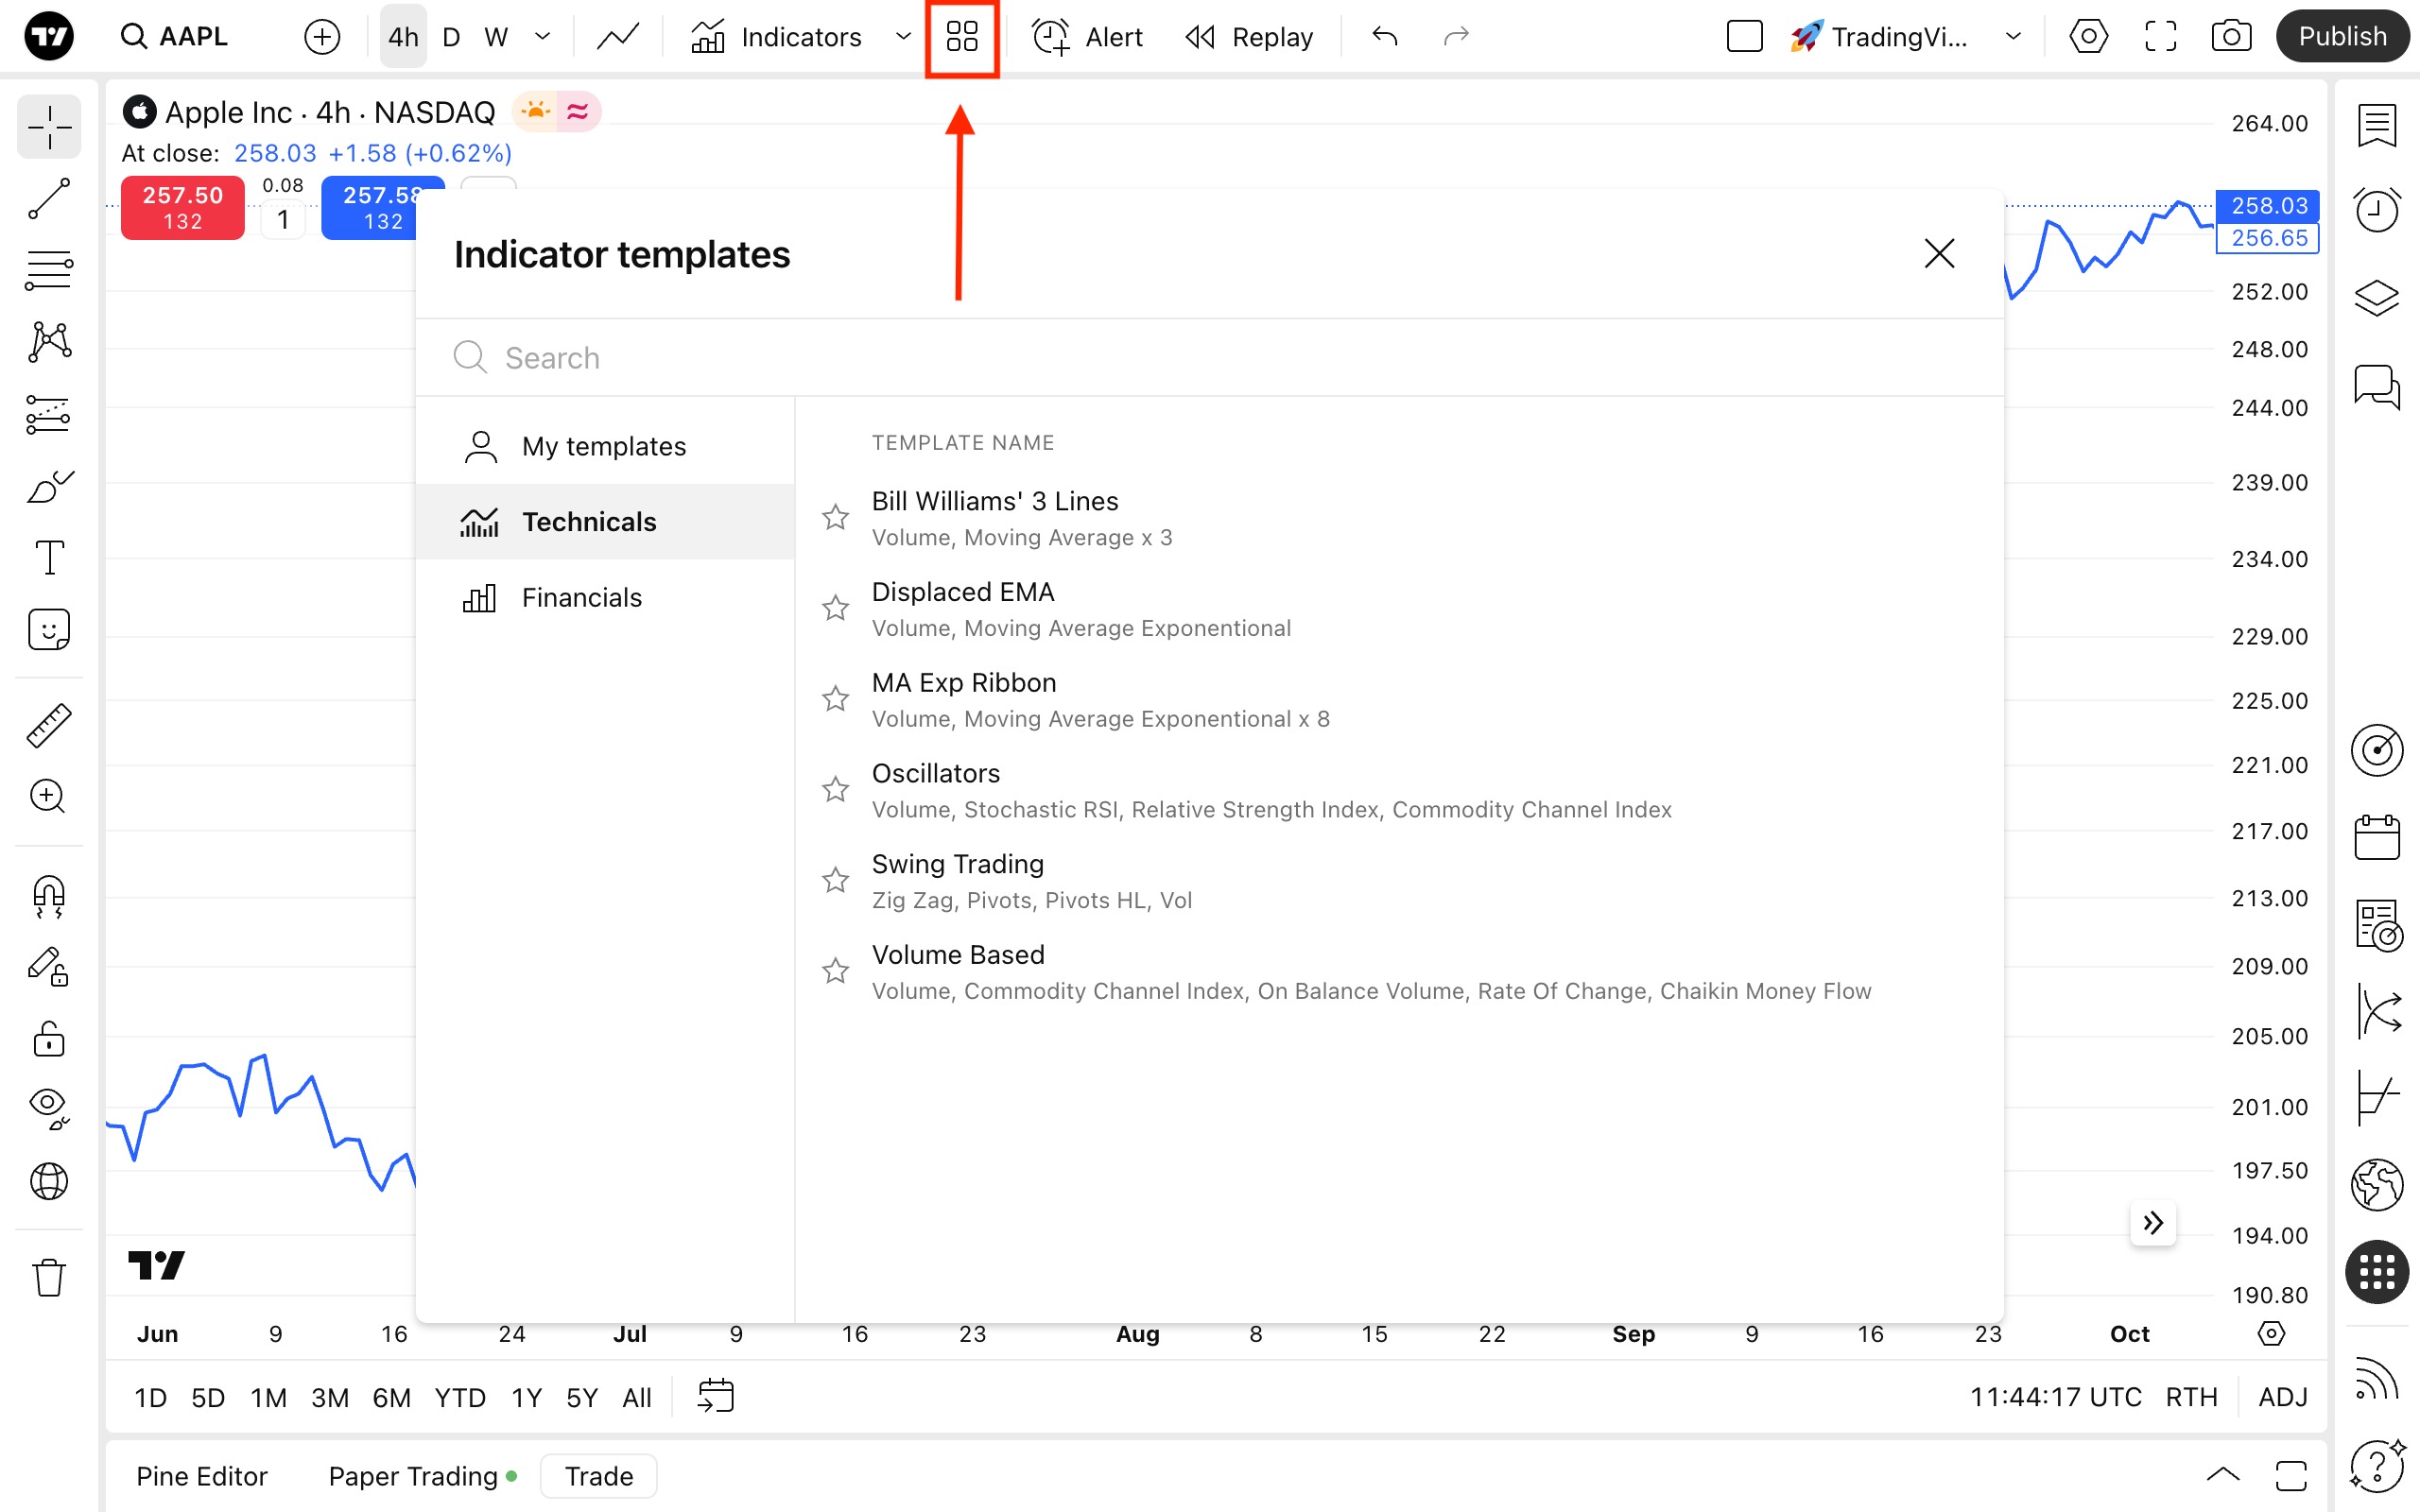 สร้างการแจ้งเตือนคุณสมบัตินี้ช่วยให้คุณตั้งค่า การแจ้งเตือน และจัดการการแจ้งเตือนได้ ด้วยเครื่องมือที่จำเป็นเหล่านี้ คุณจะติดตามราคา อินดิเคเตอร์ กลยุทธ์ และสิ่งที่วาดไว้ได้อยู่เสมอ คุณสามารถเลือกเงื่อนไขที่จะแจ้งเตือน วันครบอายุ ฝากข้อความไว้ข้างๆ และอื่นๆ อีกมากมาย
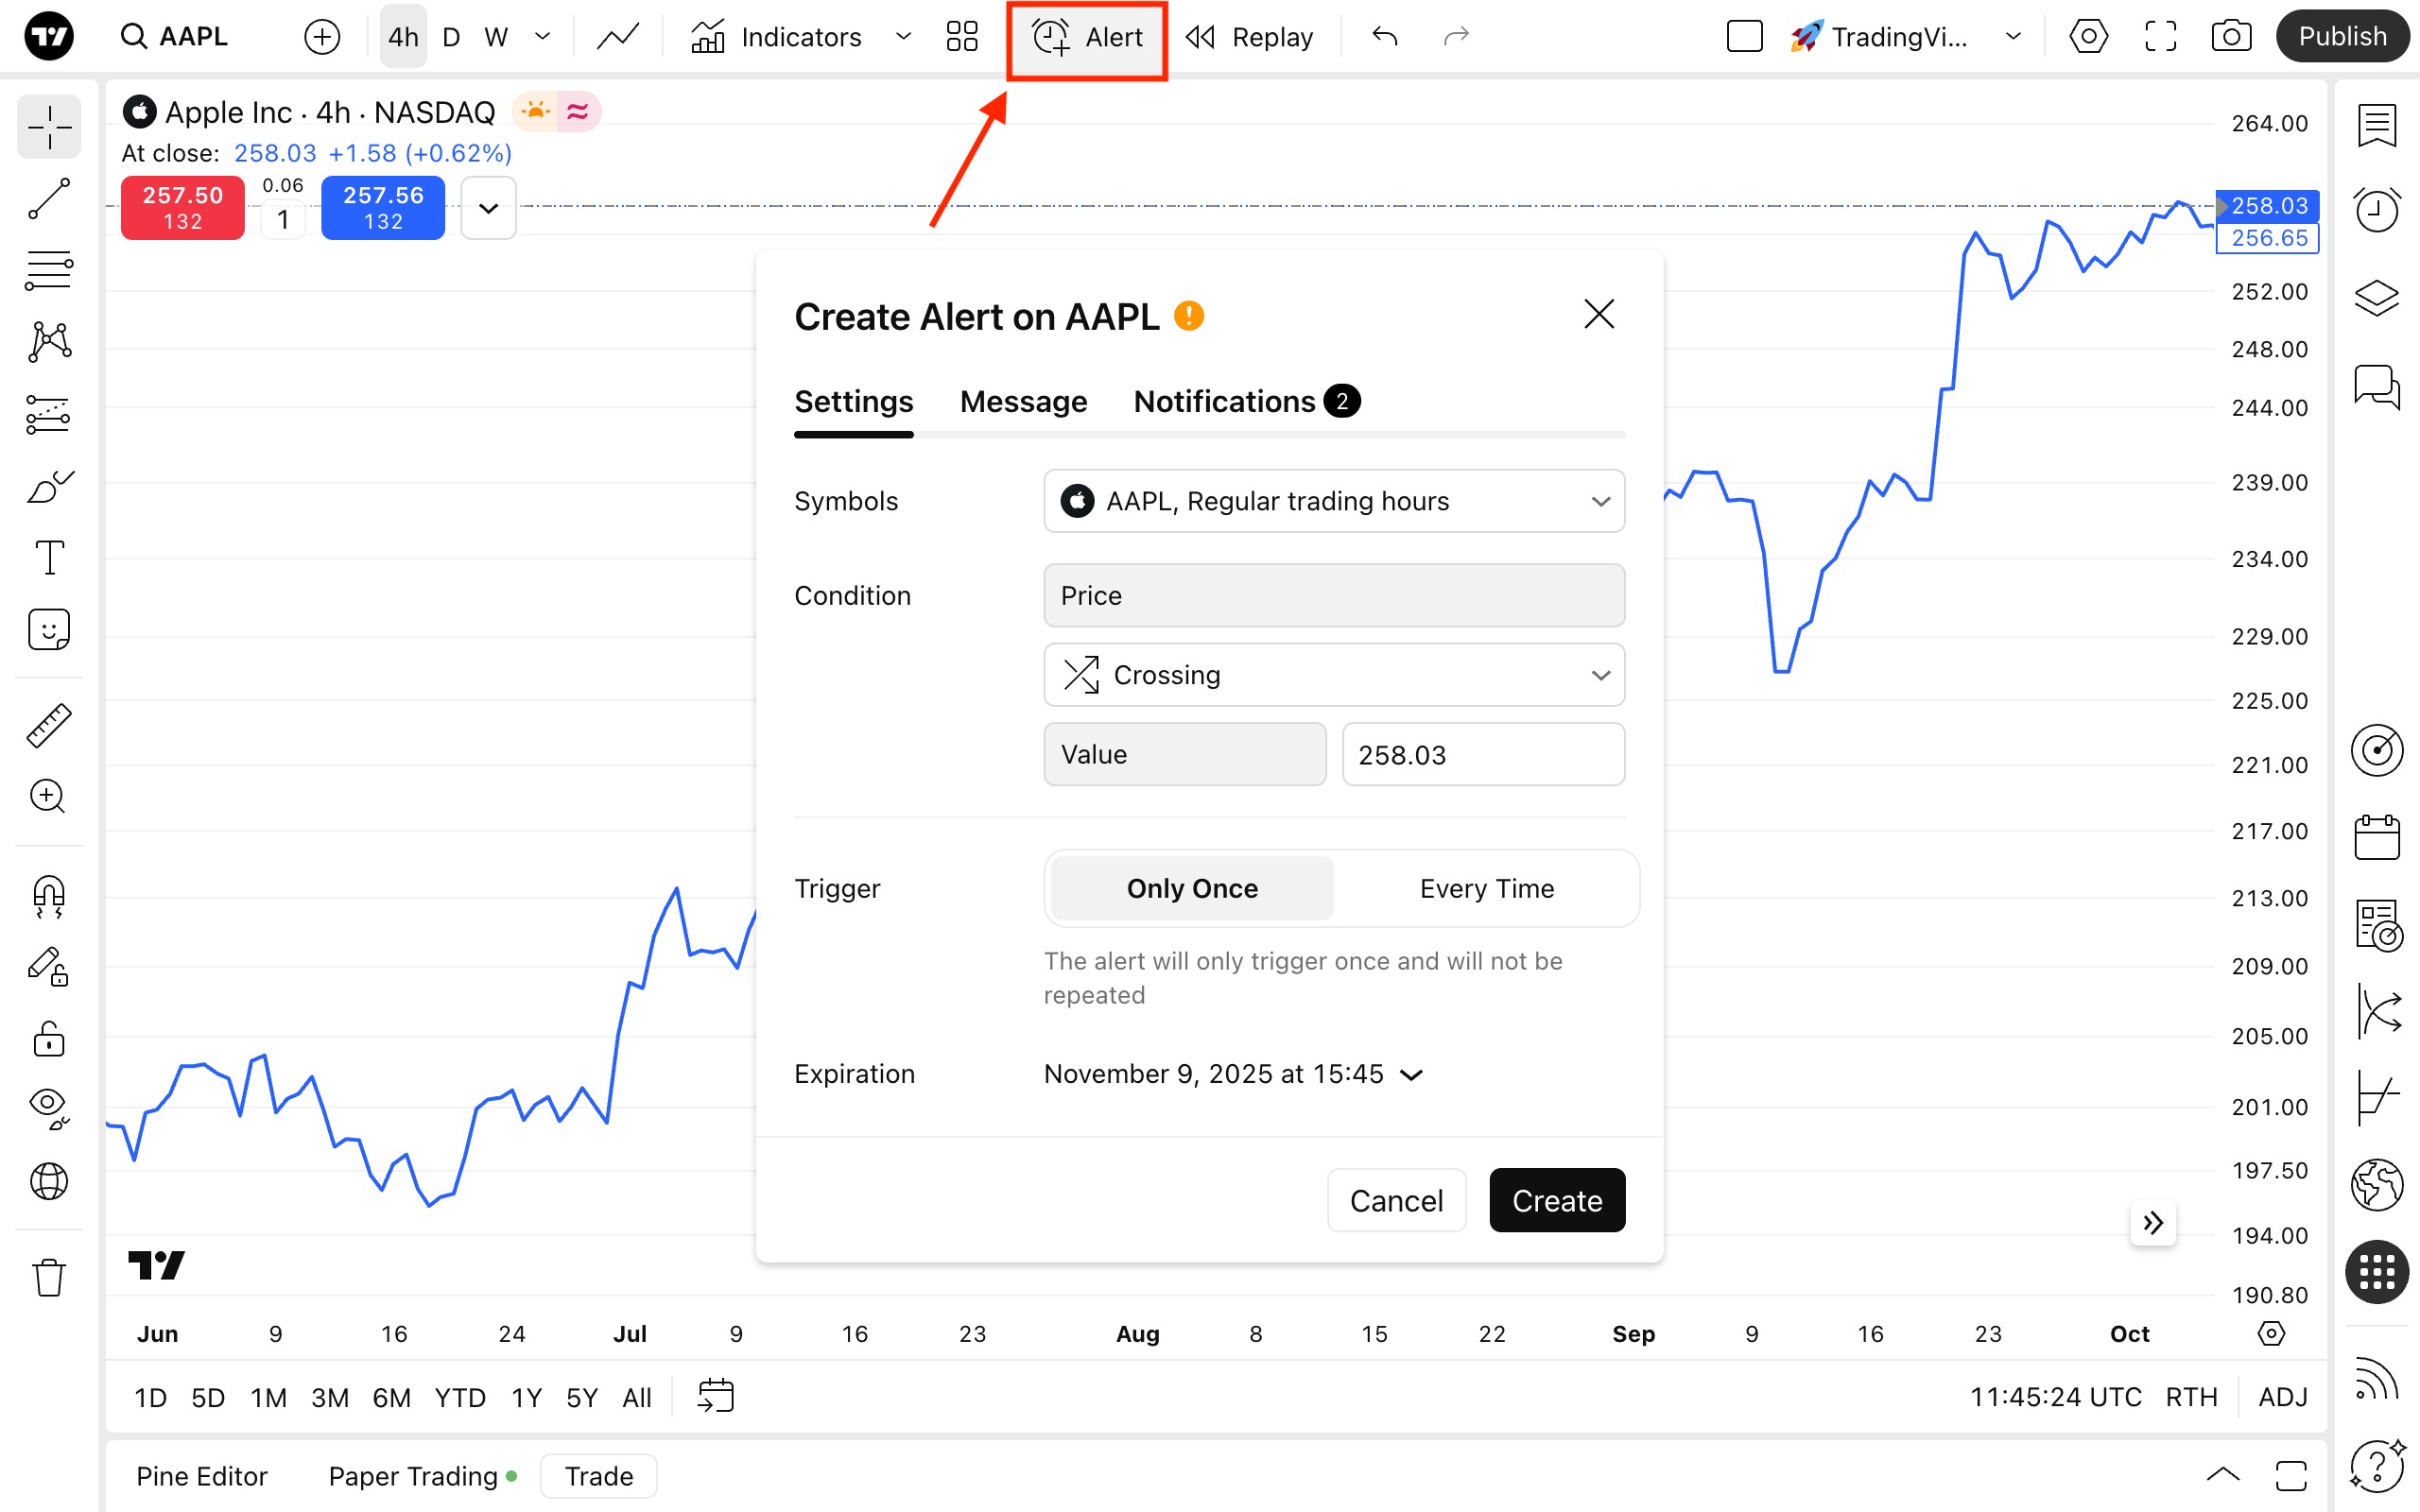 โหมดแสดงแท่งเทียนแบบเล่นซ้ำโหมดแสดงแท่งเทียนแบบเล่นซ้ำ ช่วยให้ผู้ใช้สามารถจำลองการเคลื่อนไหวของราคาในอดีตเพื่อทดสอบกลยุทธ์ได้ คุณสามารถย้อนเวลาไปวิเคราะห์พฤติกรรมของตลาดในอดีตและฝึกฝนการตัดสินใจและกลยุทธ์การซื้อขายโดยไม่ต้องรับความเสี่ยงทางการเงินที่แท้จริงการเปลี่ยนแปลงทั้งหมดบนชาร์ตสามารถจัดการได้ด้วยความช่วยเหลือของปุ่ม ย้อนกลับ และ ทำซ้ำอีกครั้ง
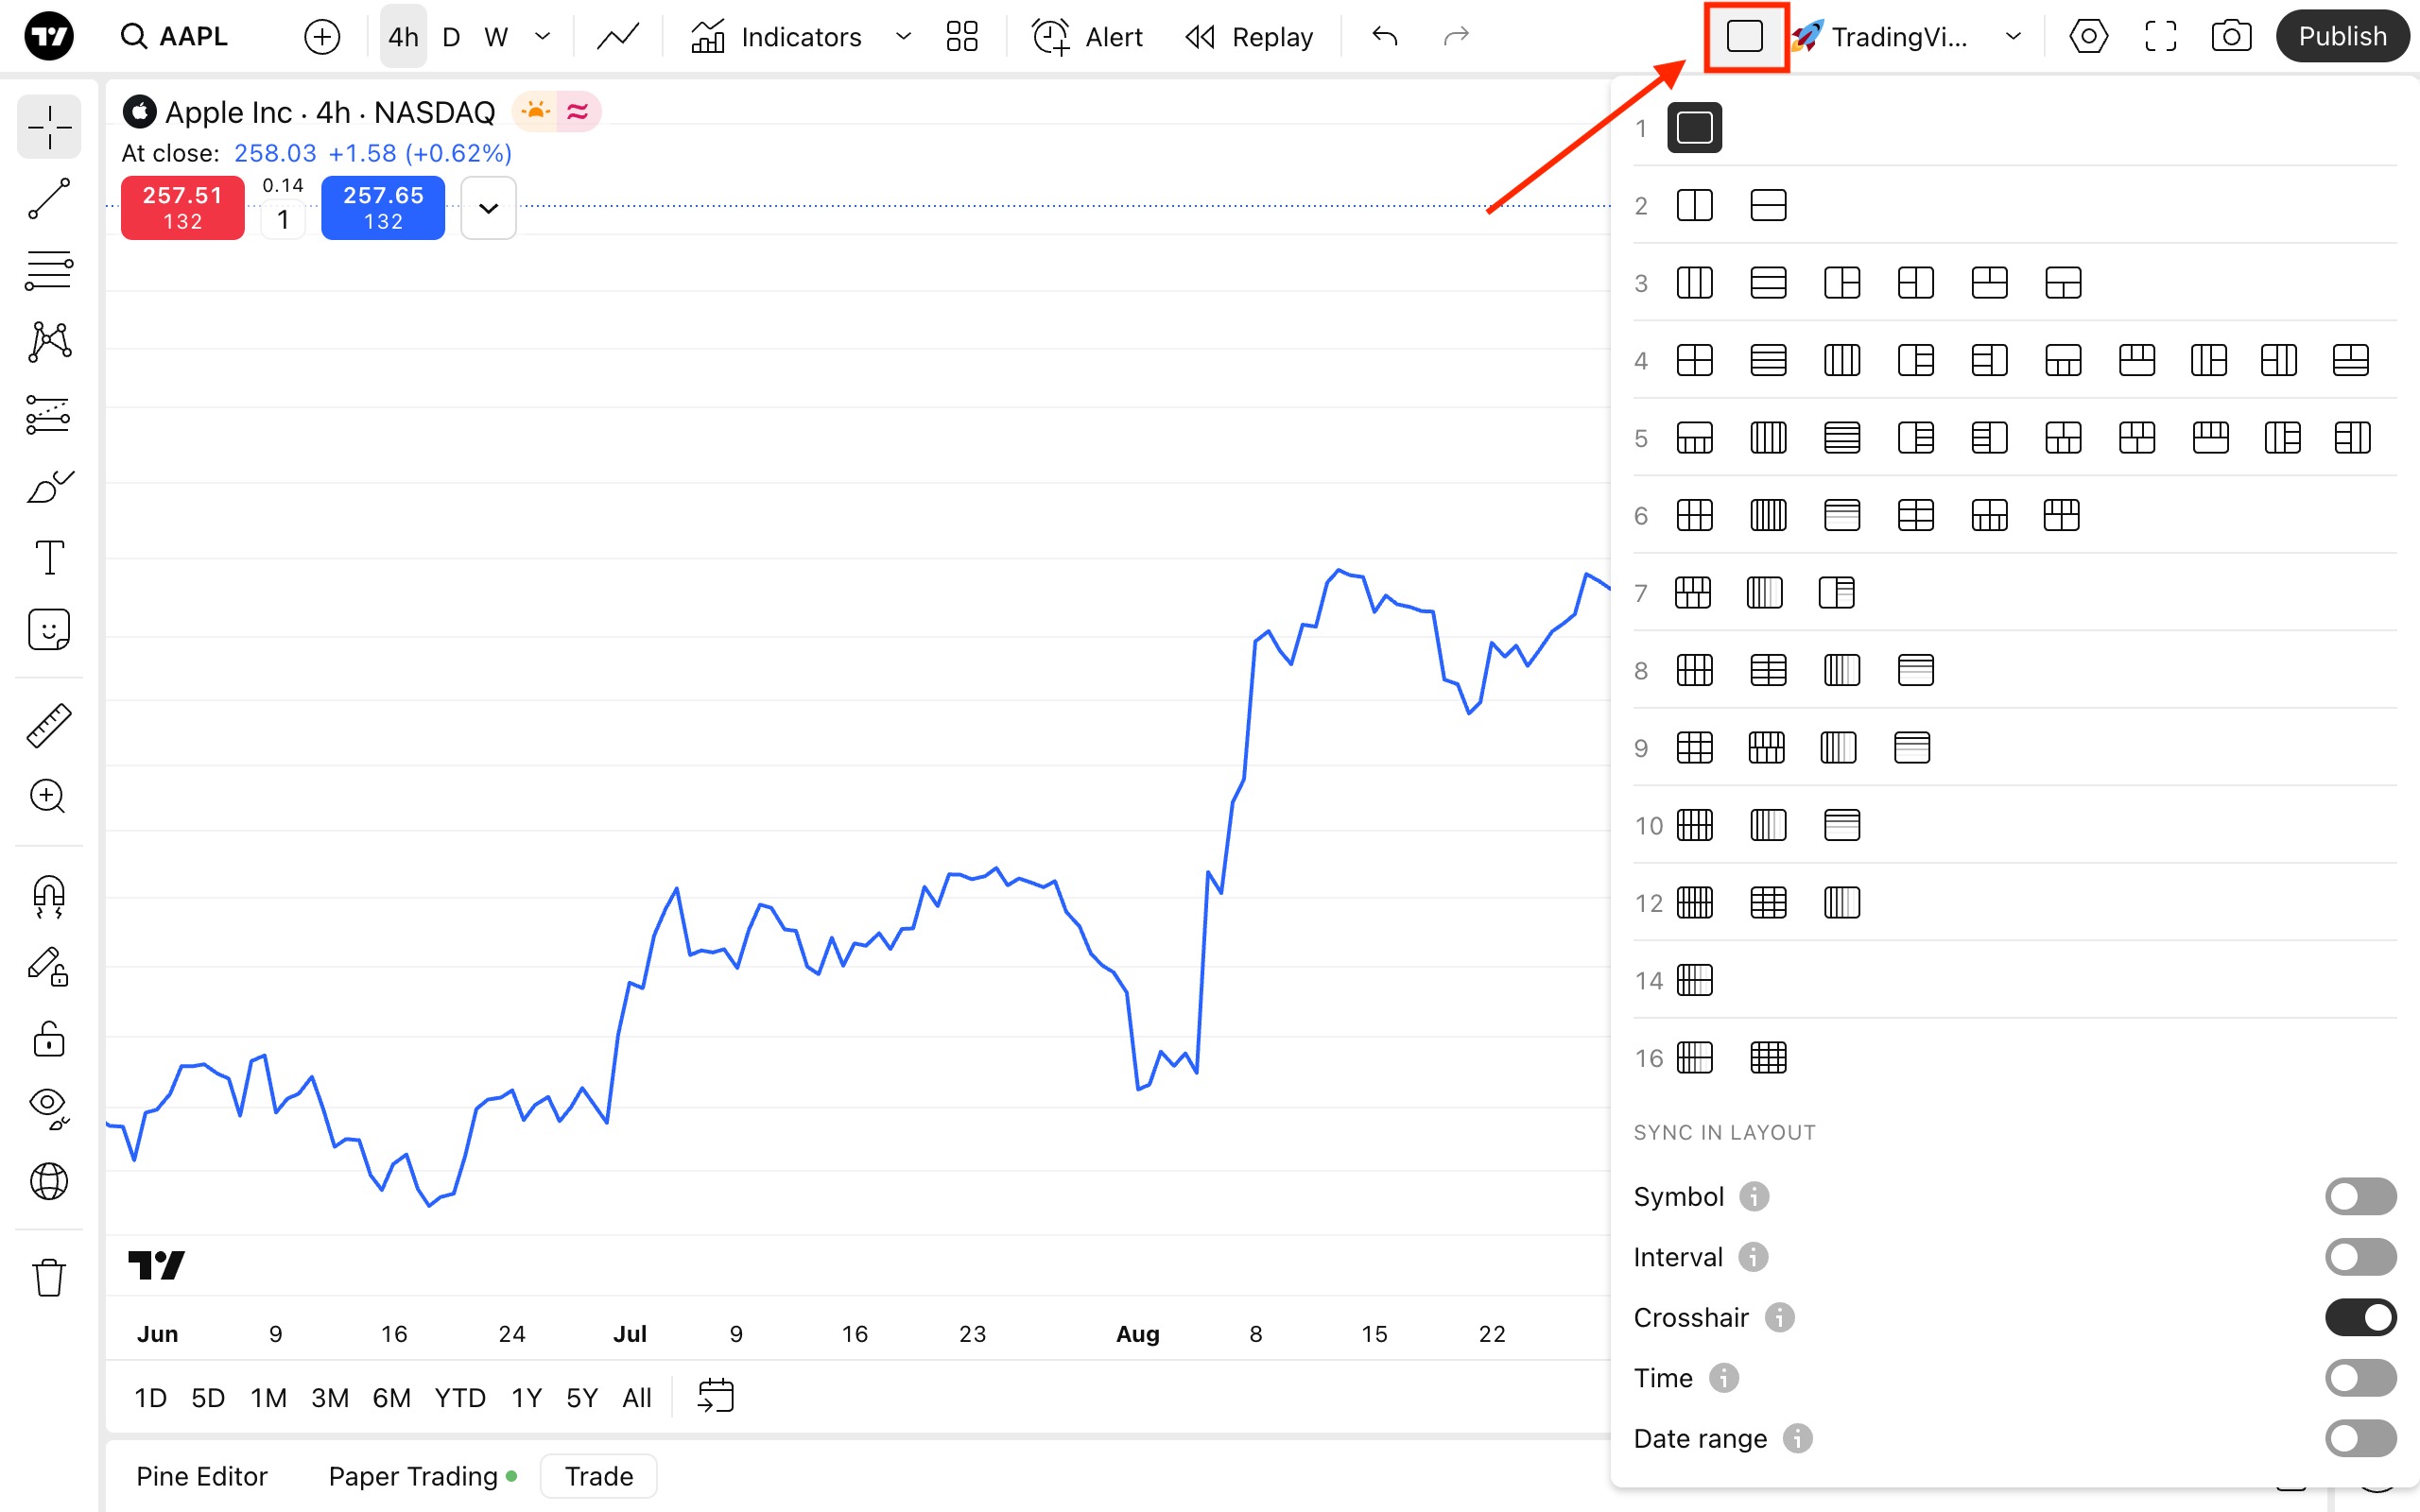 หัวลูกศรที่อยู่ถัดจากชื่อเค้าโครงจะเปิดเมนูแบบดรอปดาวน์การตั้งค่าซึ่งคุณสามารถจัดการเลย์เอาท์ของคุณได้ อย่าลืมบันทึกการเปลี่ยนแปลงที่คุณทำเพื่อหลีกเลี่ยงการสูญเสียสิ่งที่คุณได้ทำไป ที่นี่คุณยังสามารถเปลี่ยนชื่อชาร์ต แชร์และคัดลอก ส่งออกข้อมูล สร้างเลย์เอาท์ใหม่ หรือเปิดเลย์เอาท์ที่บันทึกไว้ก่อนหน้านี้ได้
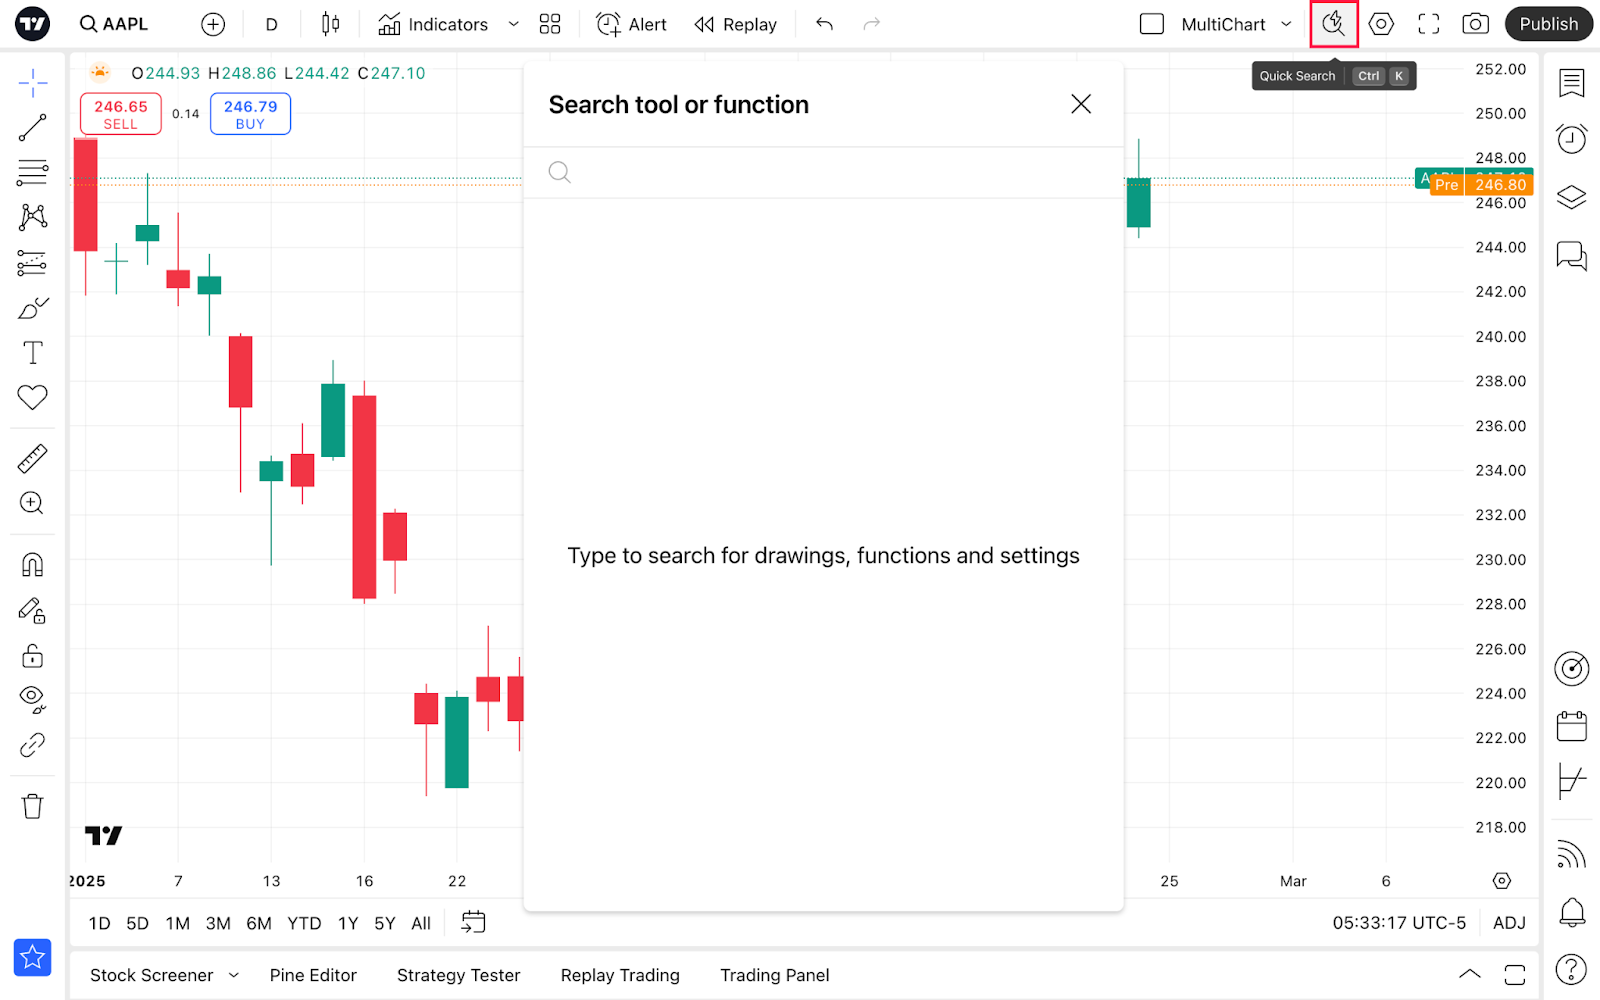
 ในเมนูการตั้งค่า คุณสามารถปรับเปลี่ยนได้ดังนี้:
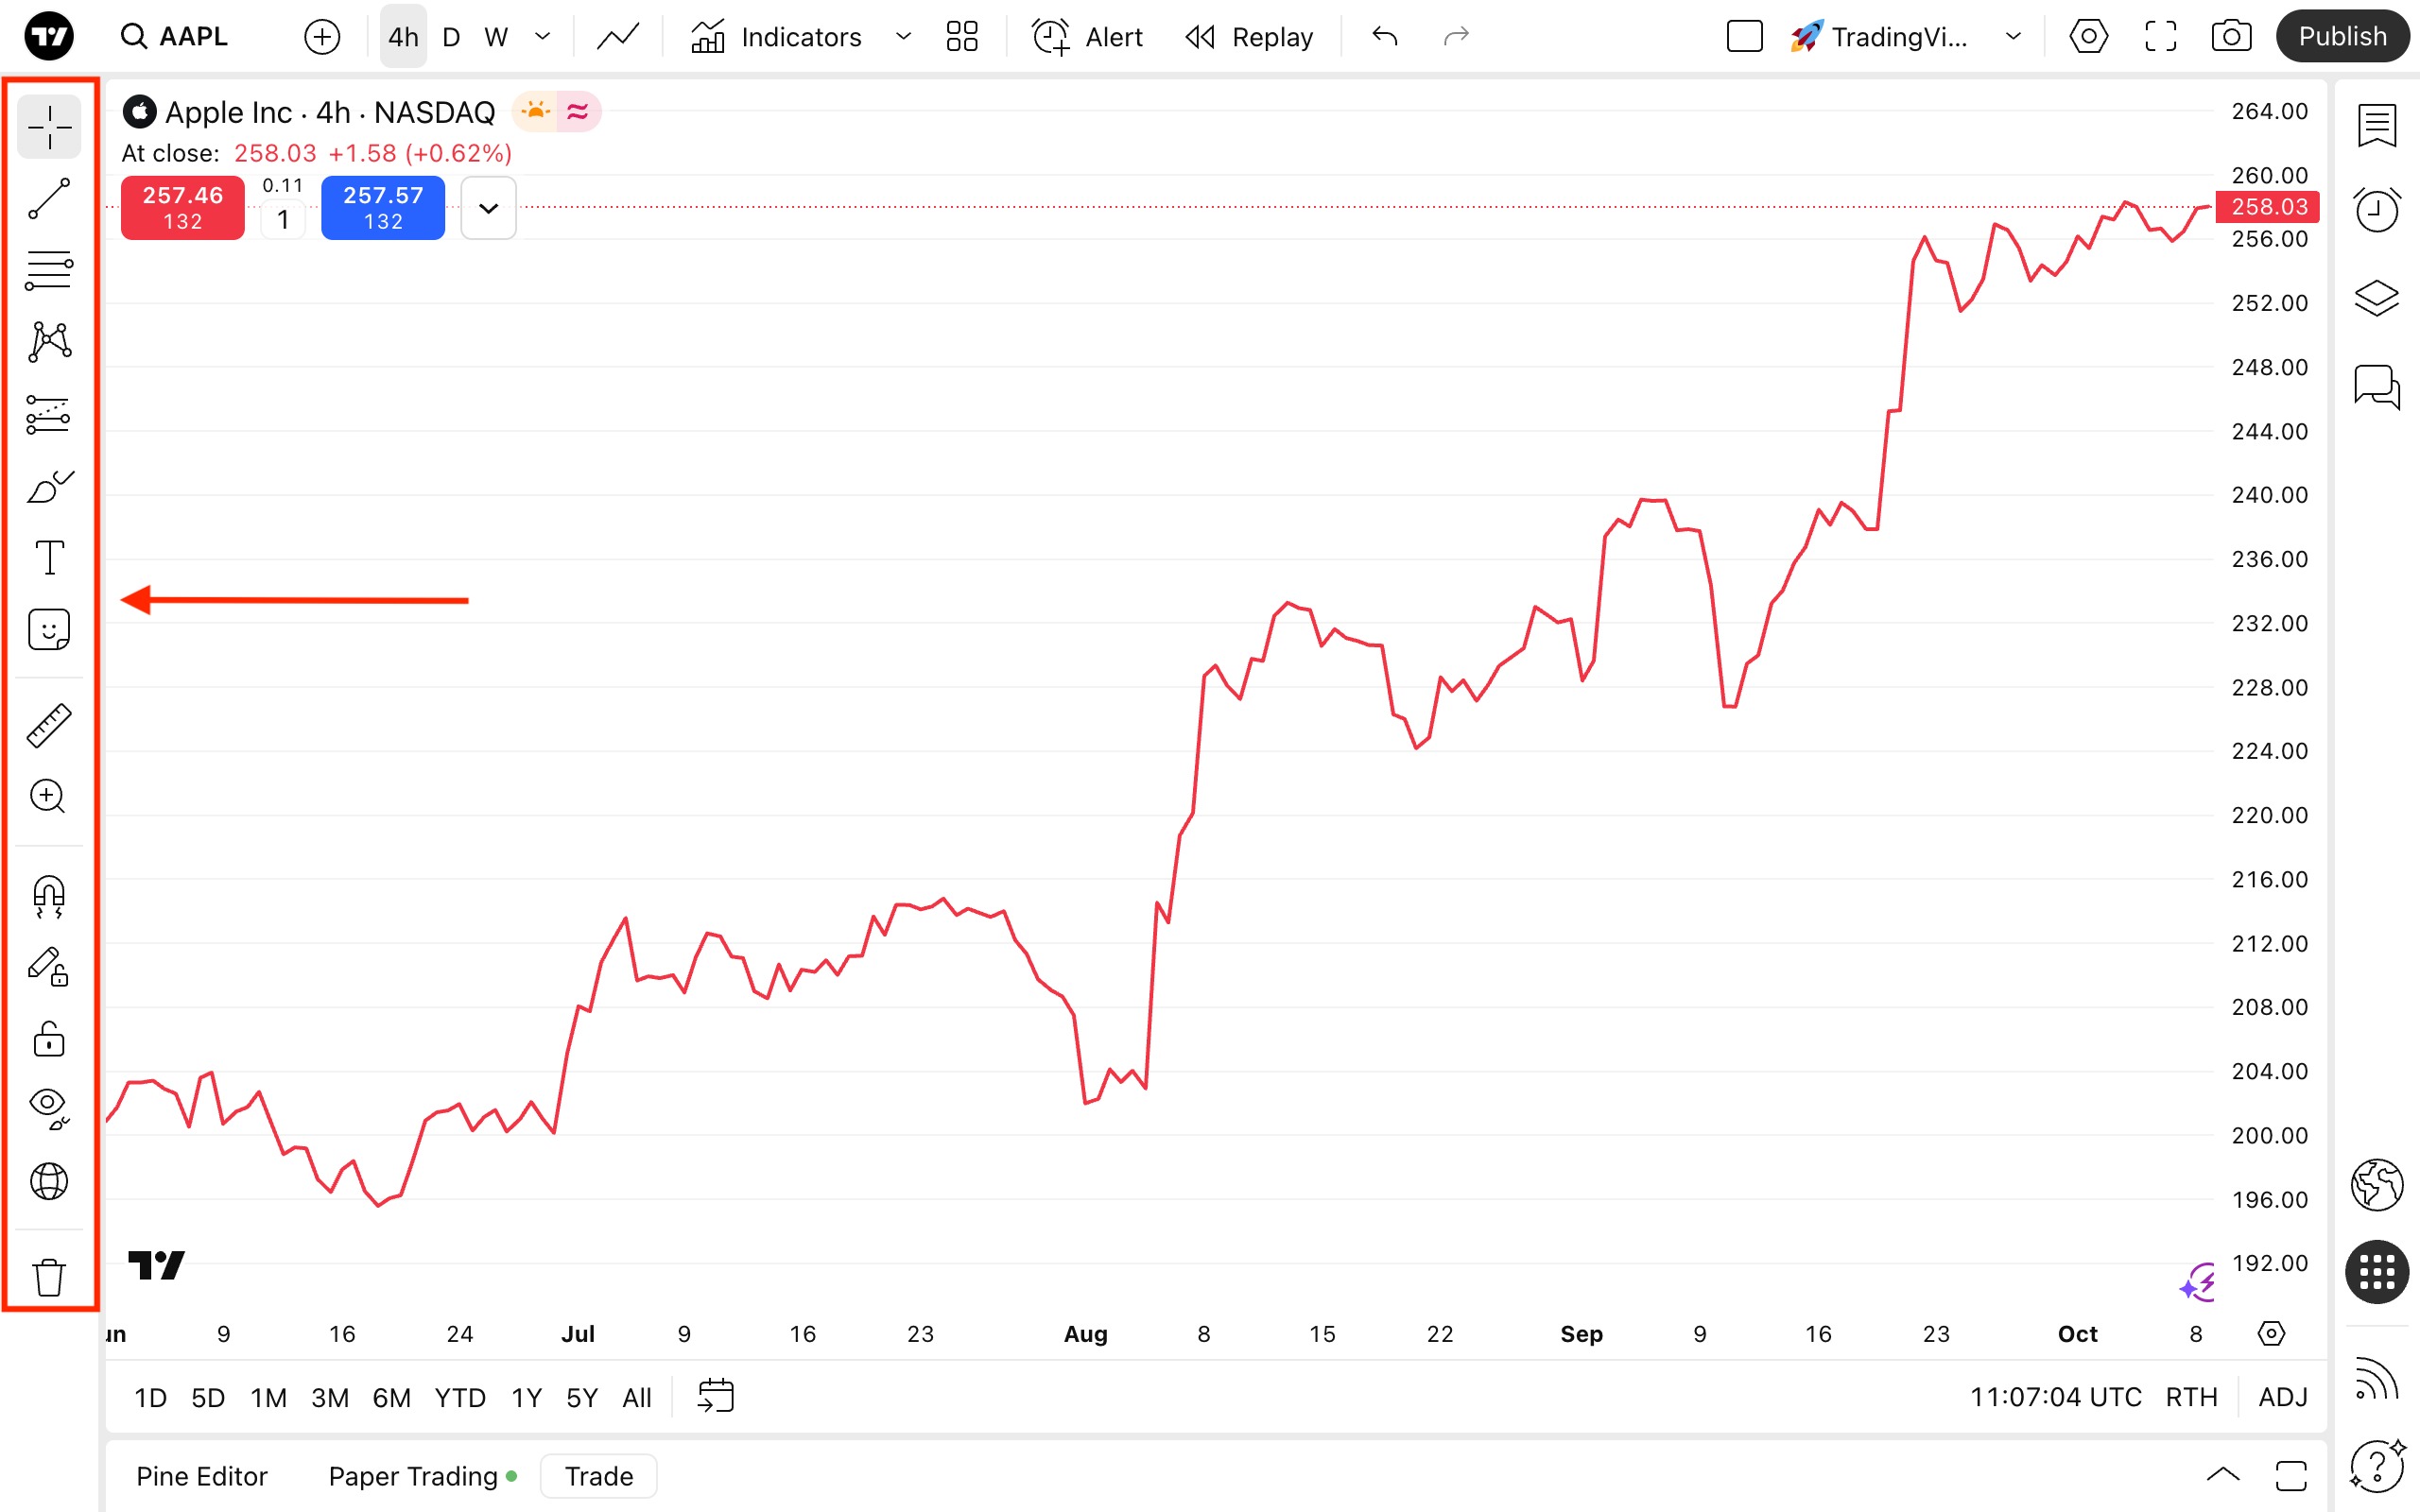 มีเครื่องมือที่มีประโยชน์มากมายในแผงนี้:
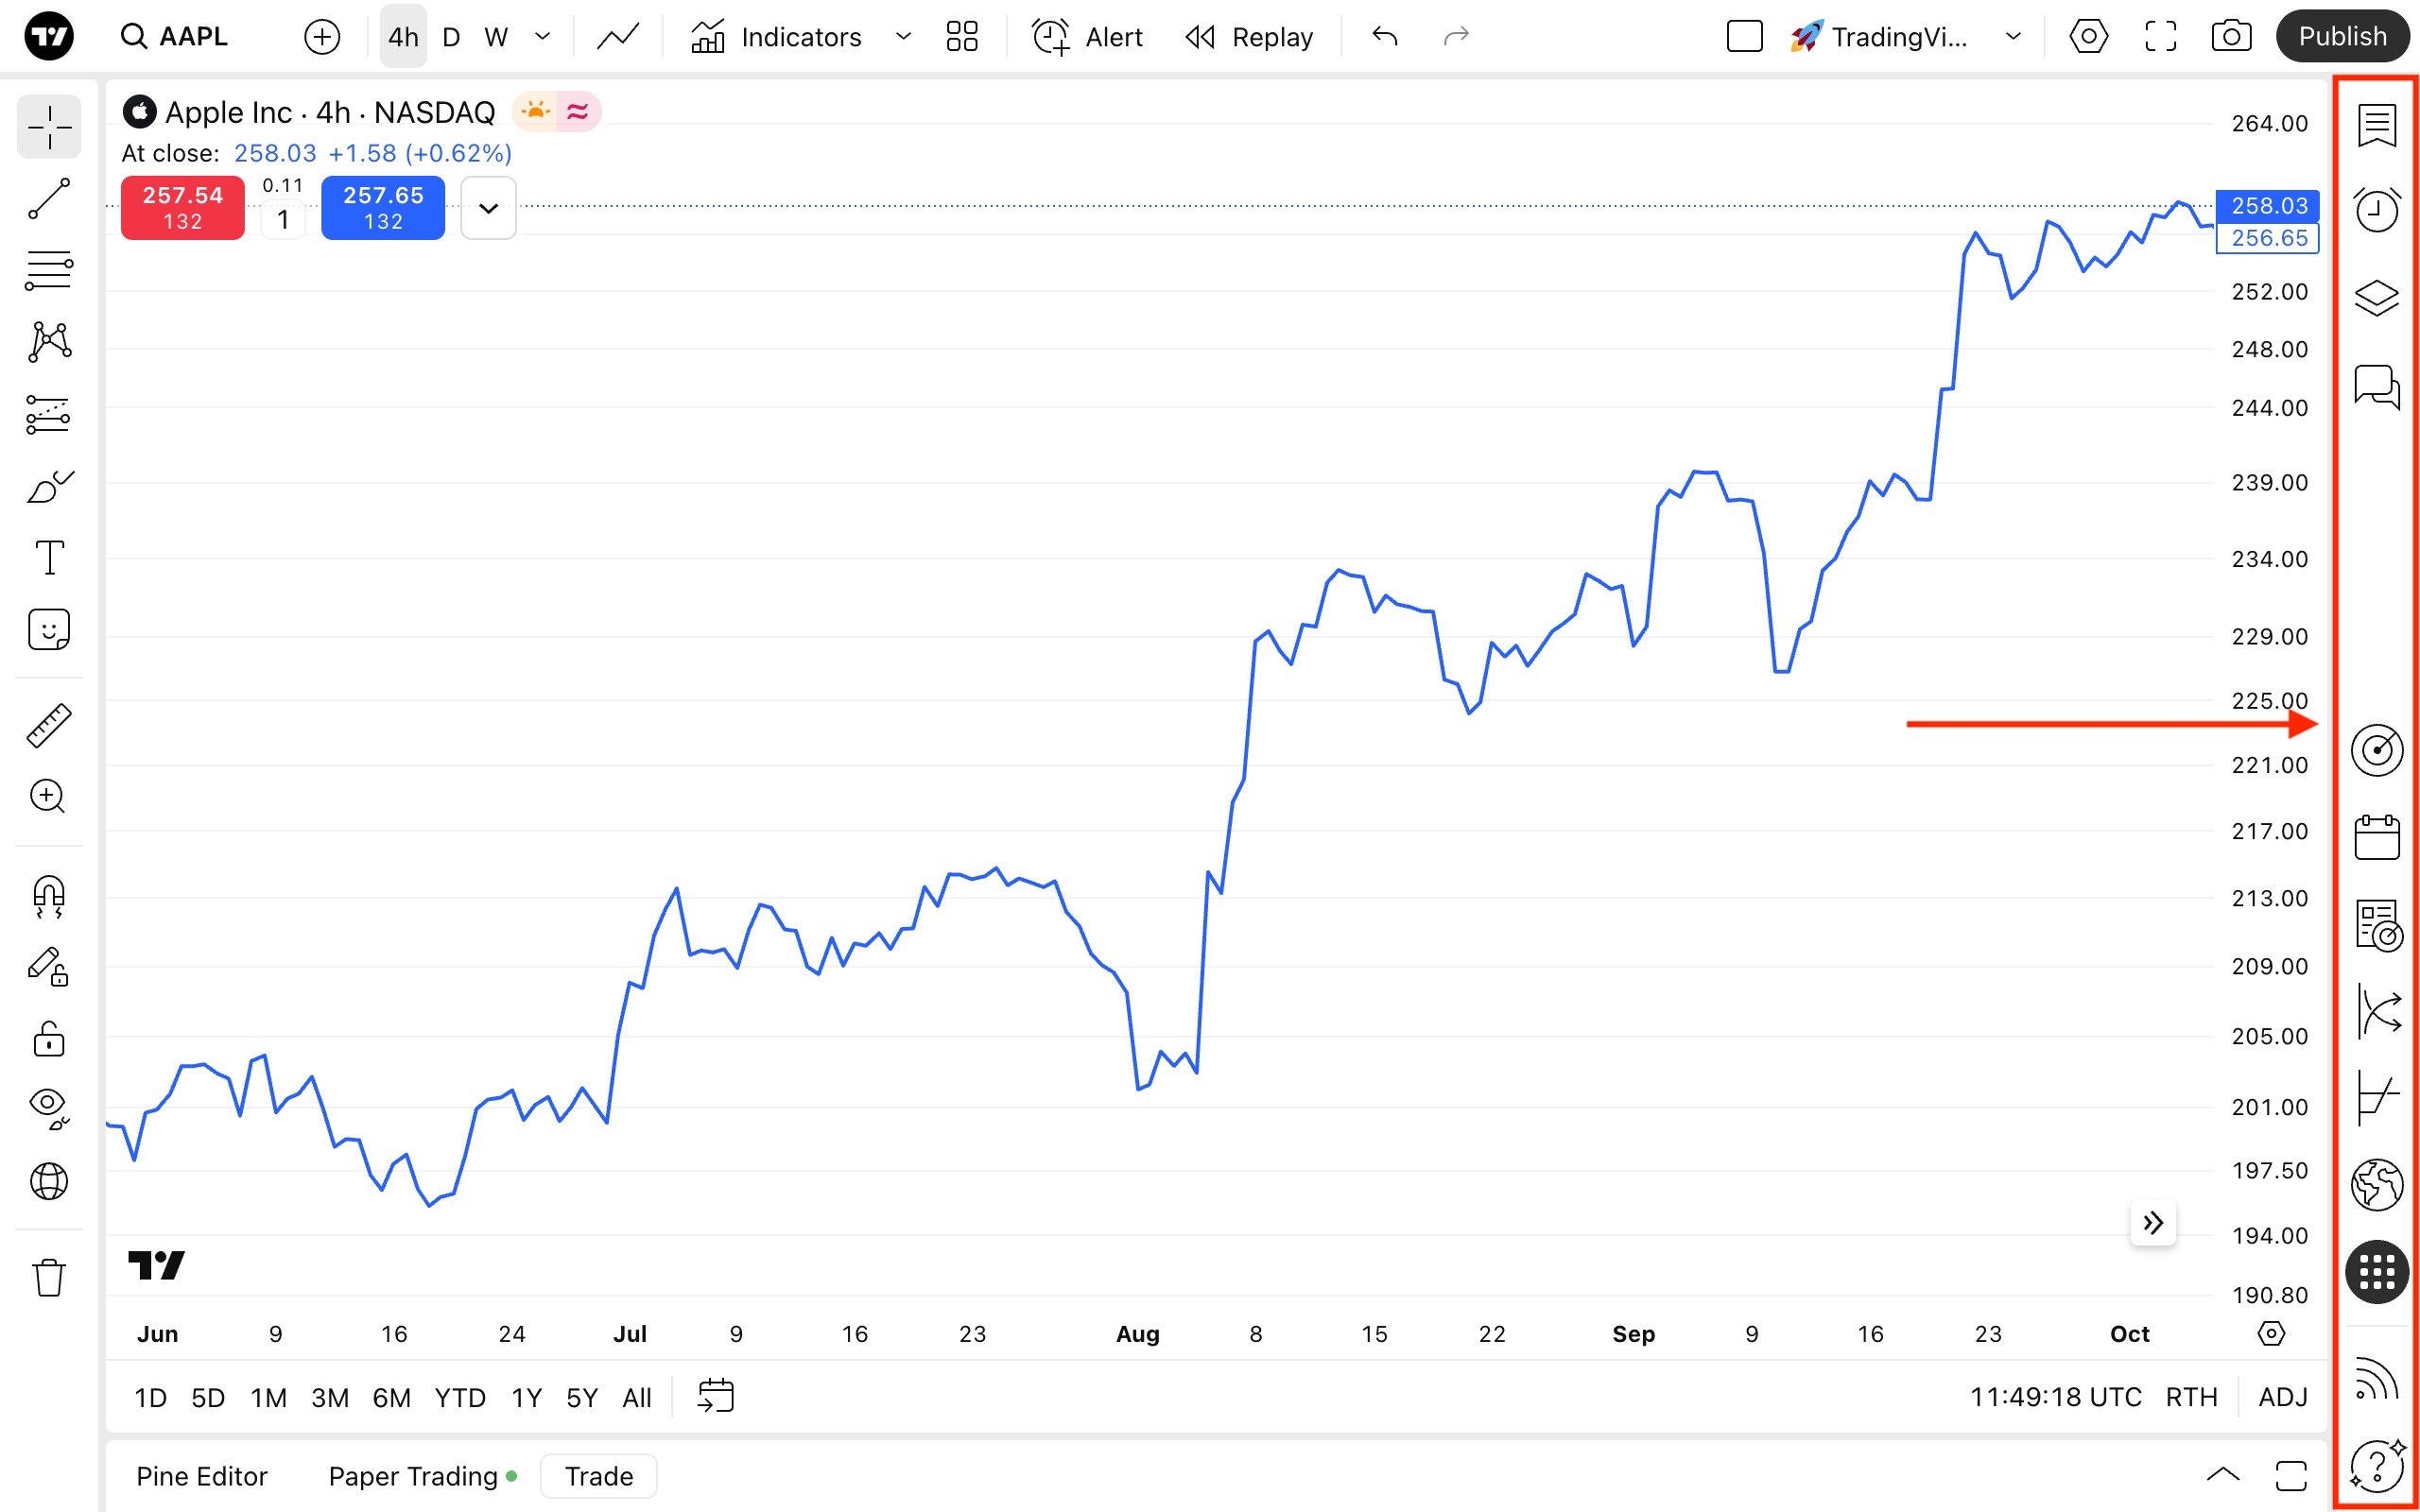
เครื่องมือที่คุณสามารถเข้าถึงได้: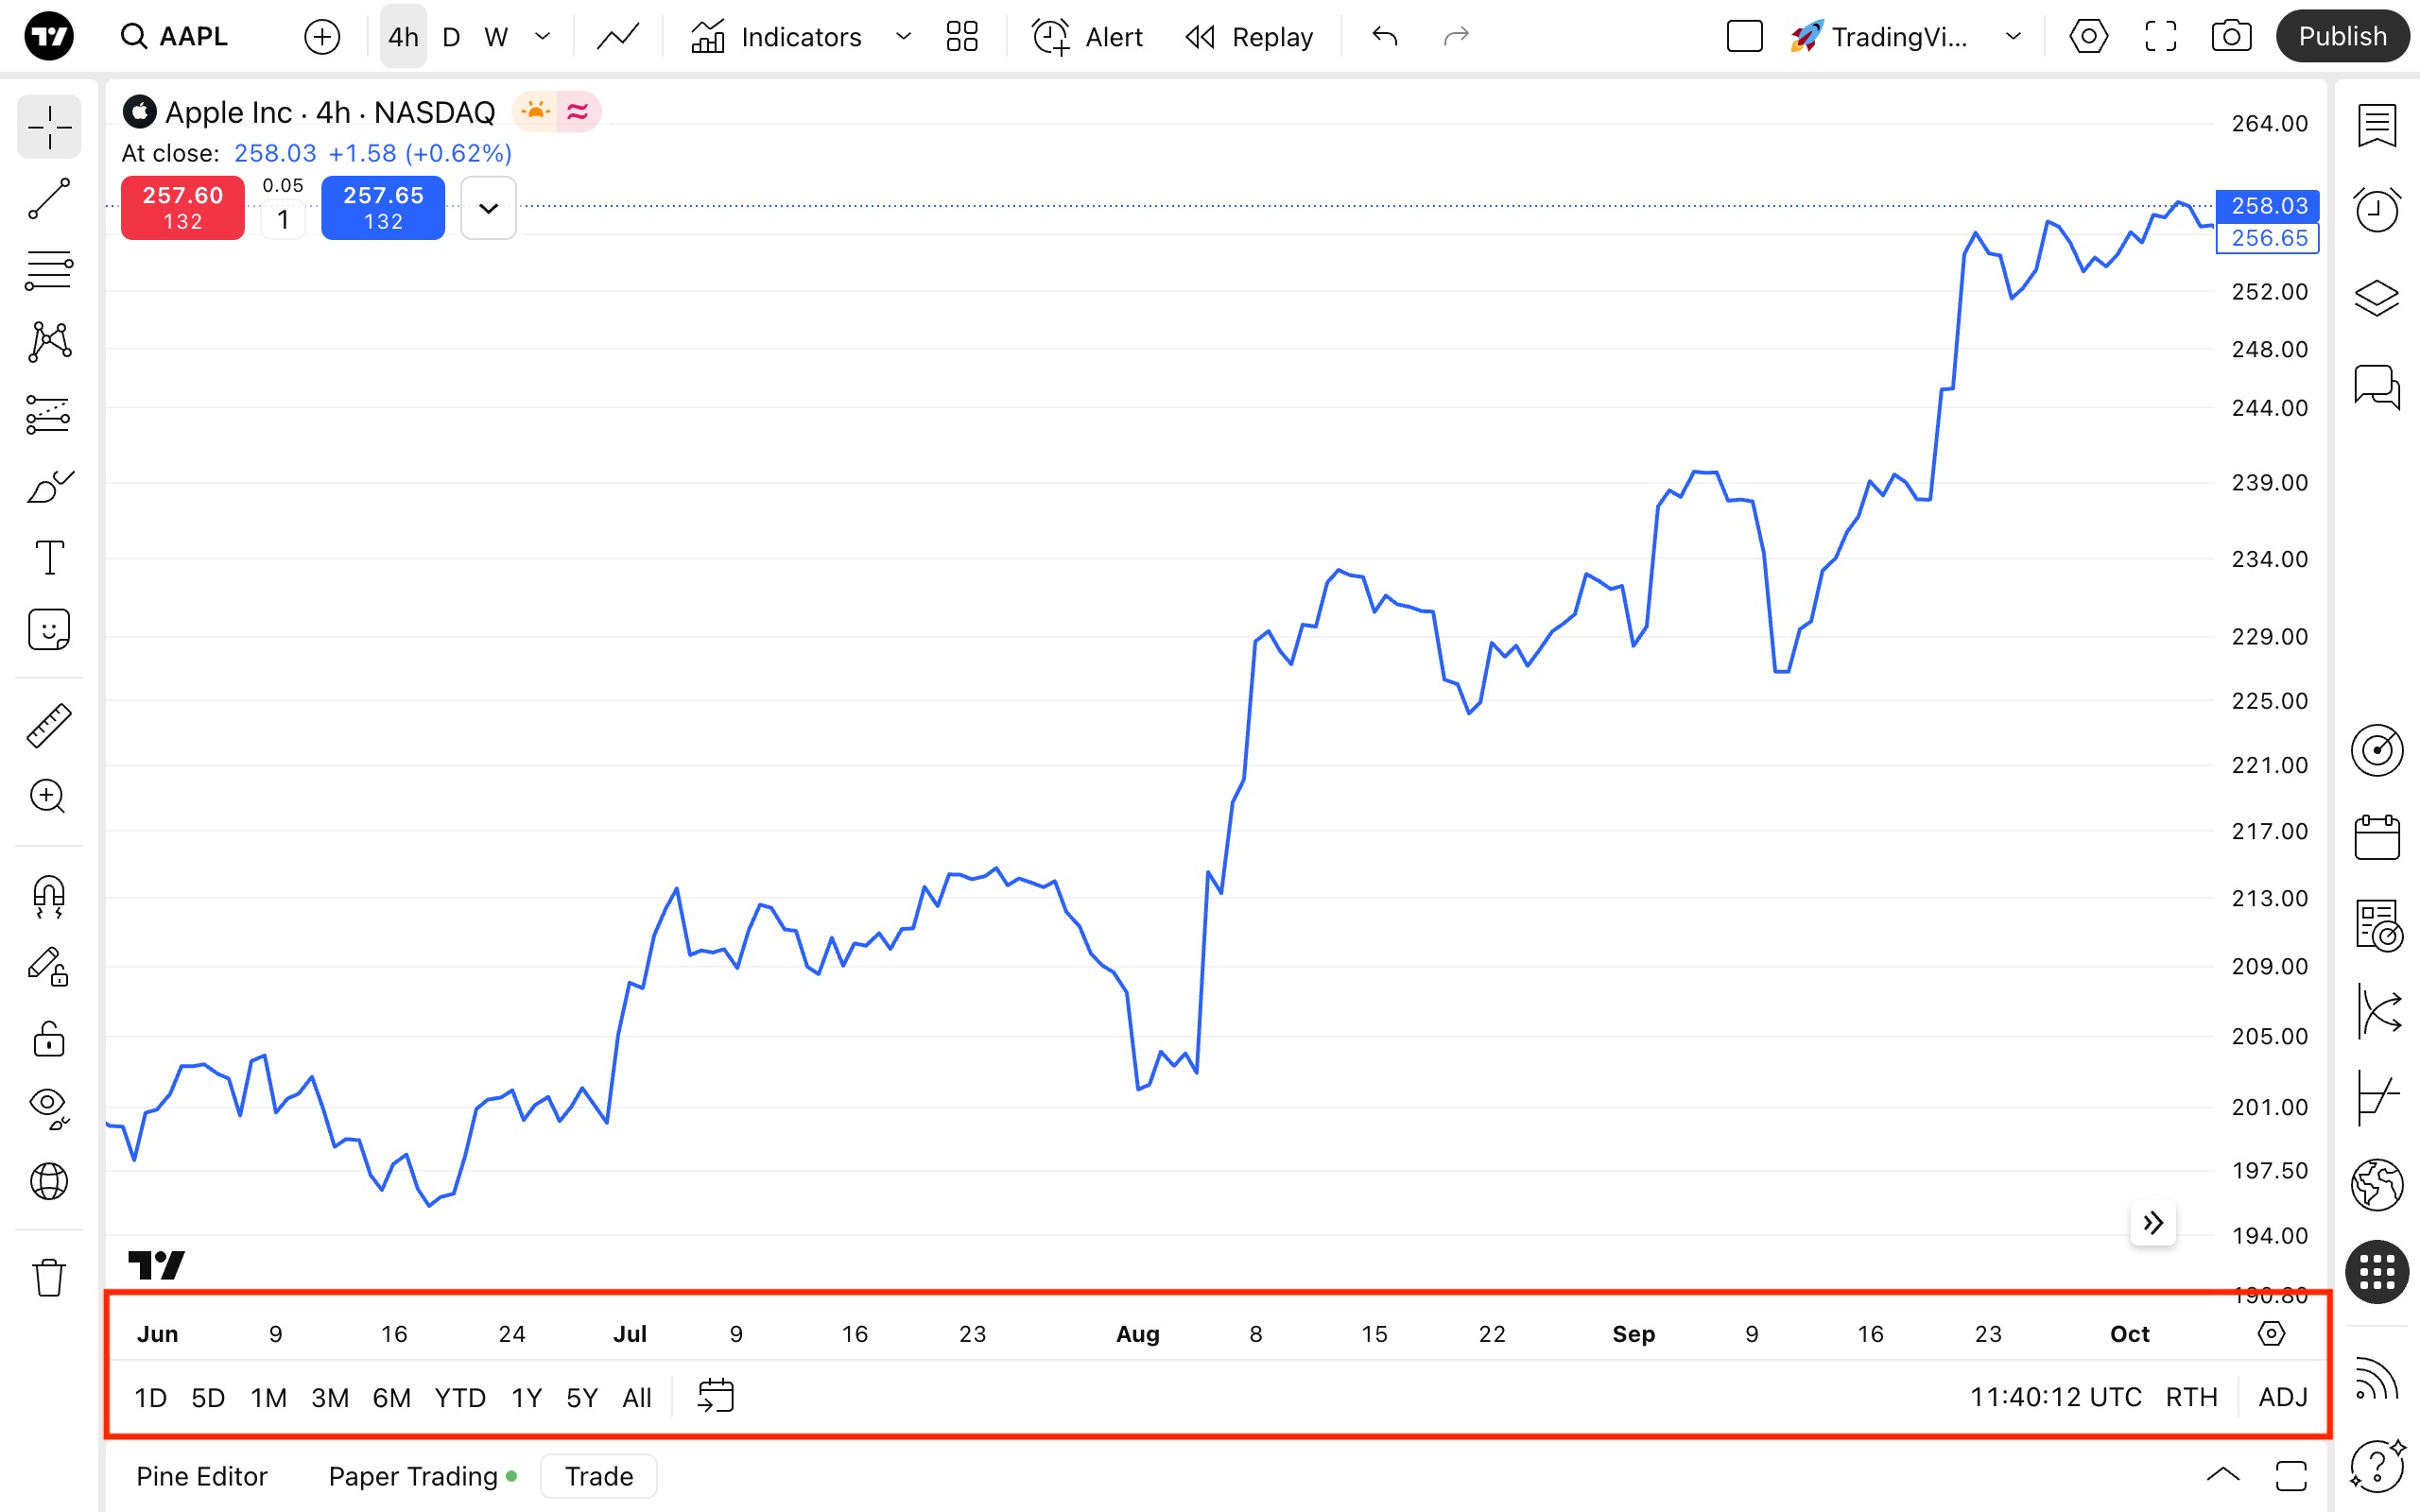 ภายใต้สเกลเวลา คุณสามารถค้นหาช่วงเวลาที่ตั้งค่าไว้ล่วงหน้าเพื่อให้เหมาะกับหน้าจอของคุณได้ เช่น การเลือก 1D จะปรับชาร์ตเพื่อให้แสดงวันซื้อขายหนึ่งวันโดยใช้ช่วงเวลาหนึ่งนาที การเลือก "ทั้งหมด" จะแสดงข้อมูลย้อนหลังที่มีอยู่ทั้งหมดพร้อมช่วงเวลาแบบรายเดือน หากไม่มีช่วงเวลาใดเหมาะกับคุณ คุณสามารถไปที่วันที่ระบุหรือสร้างช่วงแบบกำหนดเองได้ในเมนู ‘ไปที่’
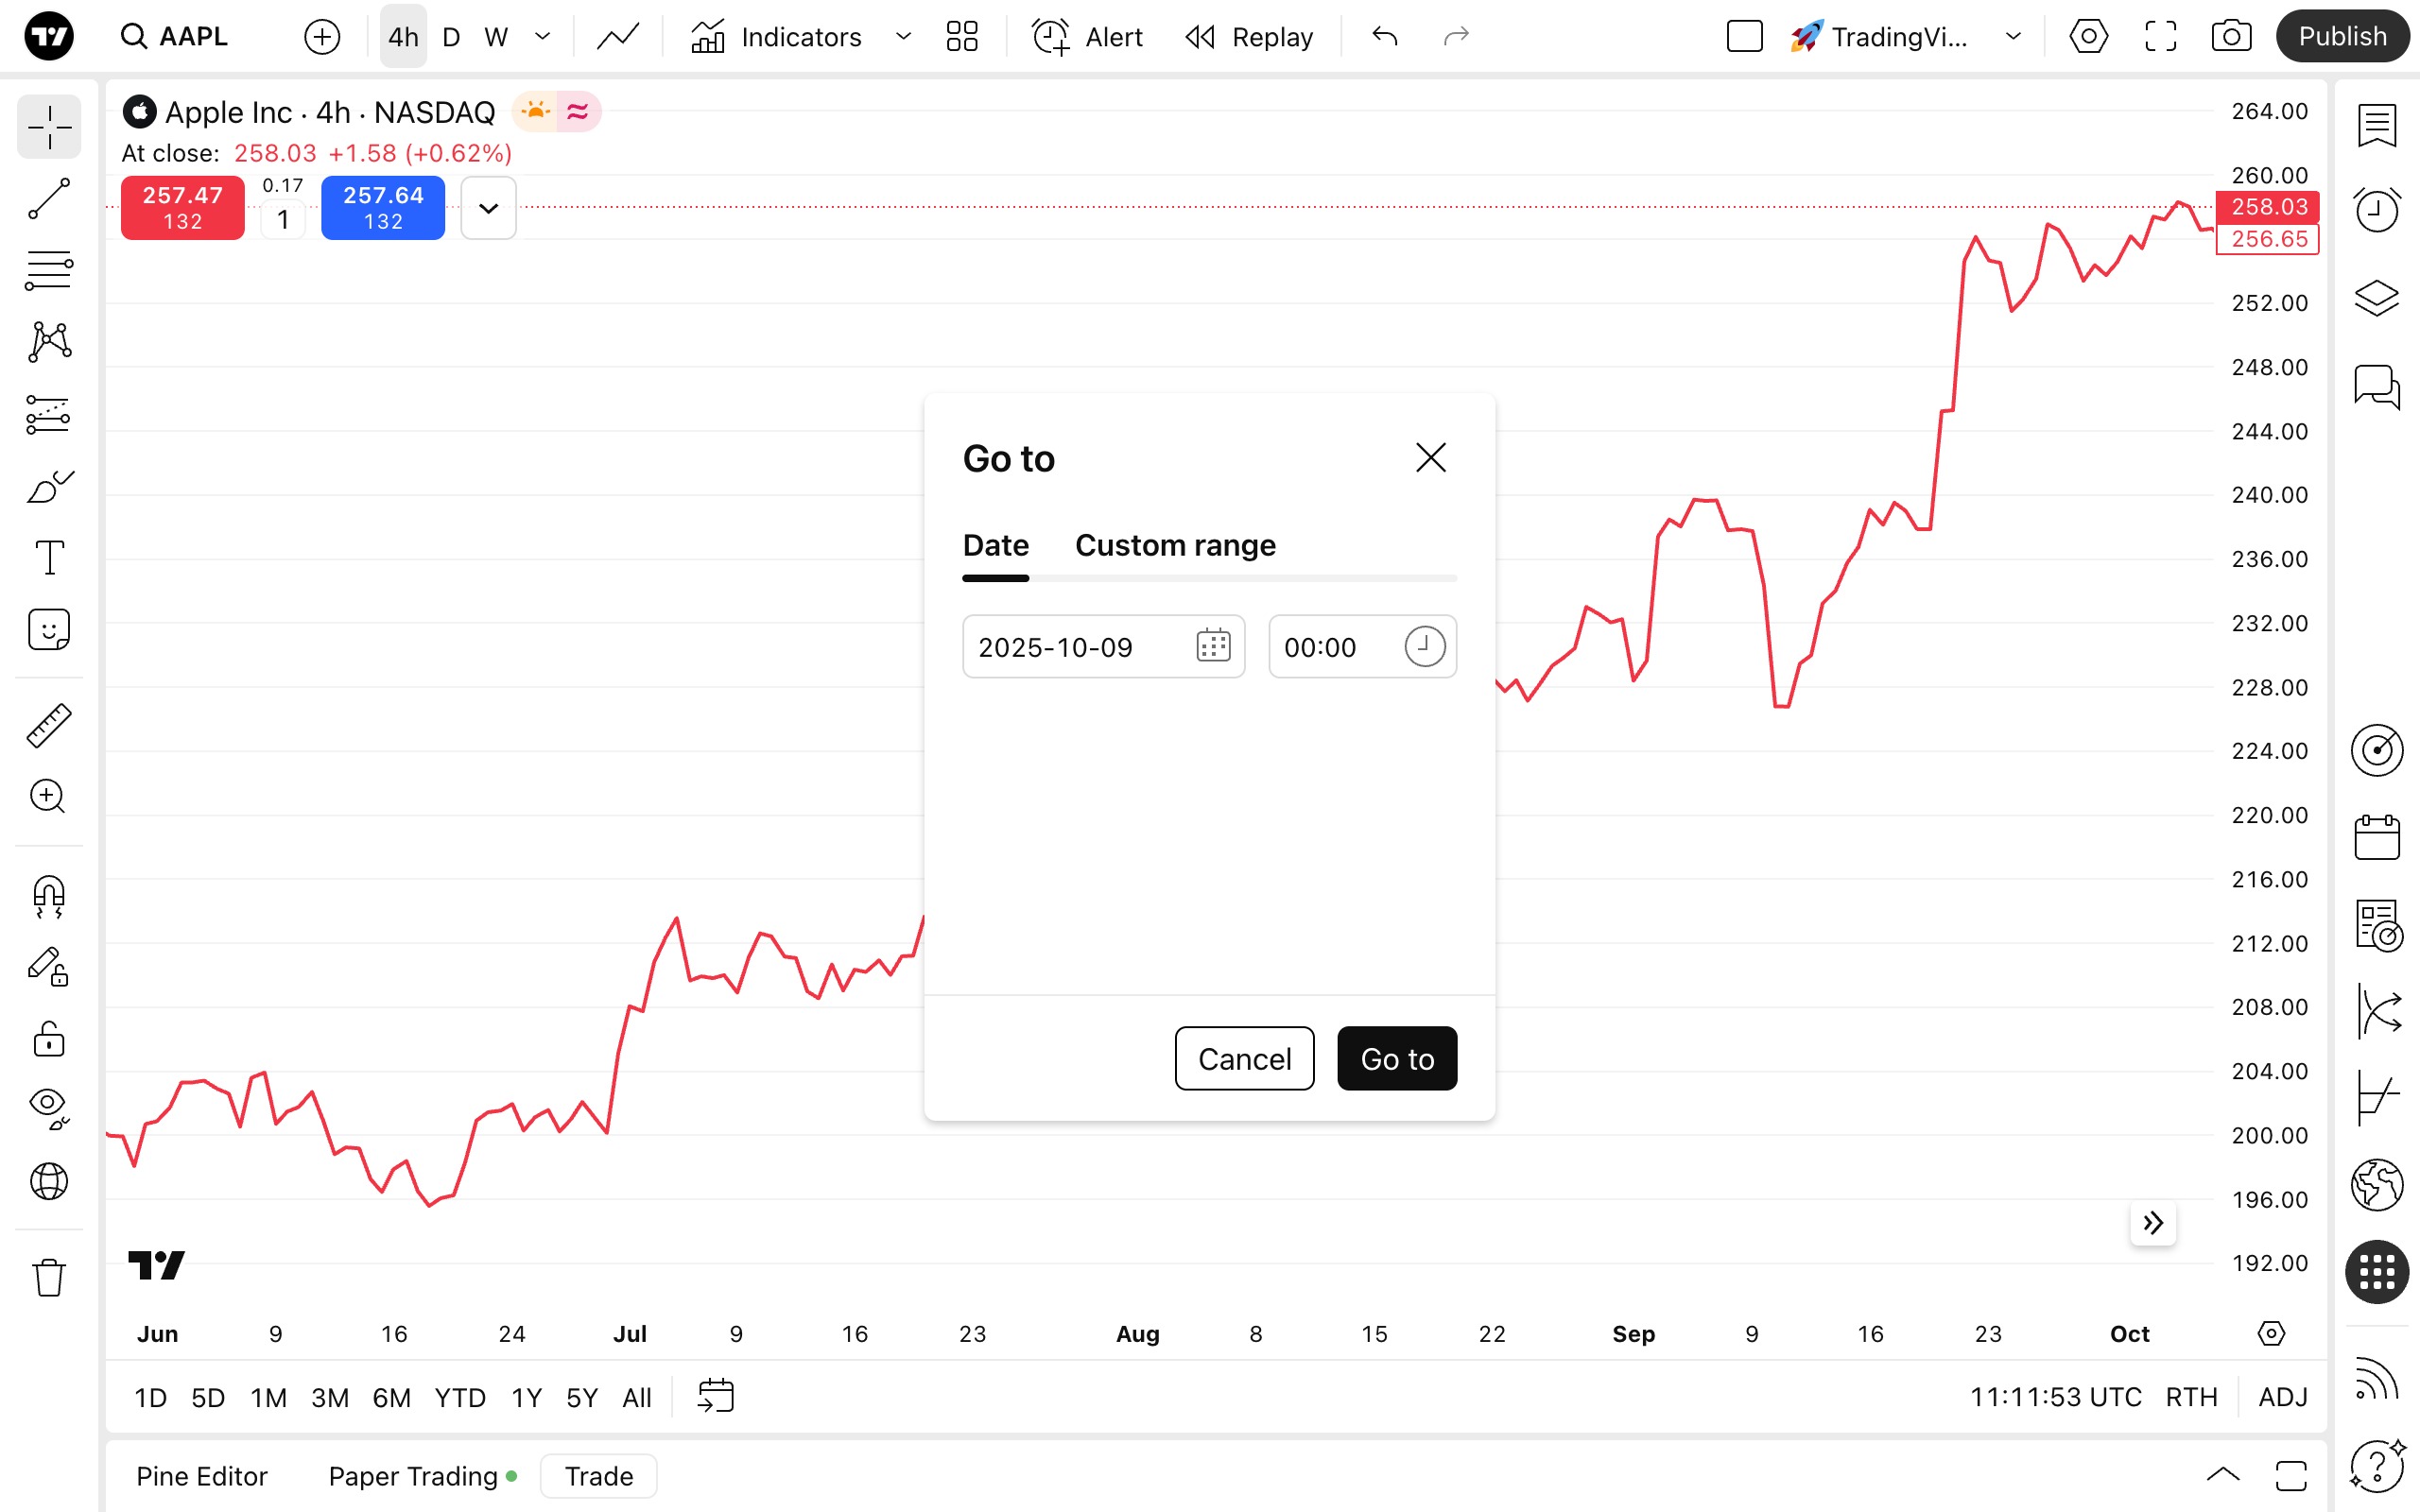 ใน การตั้งค่าเขตเวลา คุณสามารถเลือกเวลาที่จะแสดงบนชาร์ตได้ เลือก “ตลาดแลกเปลี่ยน” ให้ตรงกับเวลาตลาดแลกเปลี่ยนที่เกี่ยวข้องคุณจะเห็นปุ่มเฟืองใกล้กับการตั้งค่าโซนเวลาด้วย มันจะเปิดการตั้งค่าสเกลราคา ซึ่งคุณสามารถกำหนดโหมด เลือกป้ายกำกับที่จะแสดง และอื่นๆ อีกมากมาย
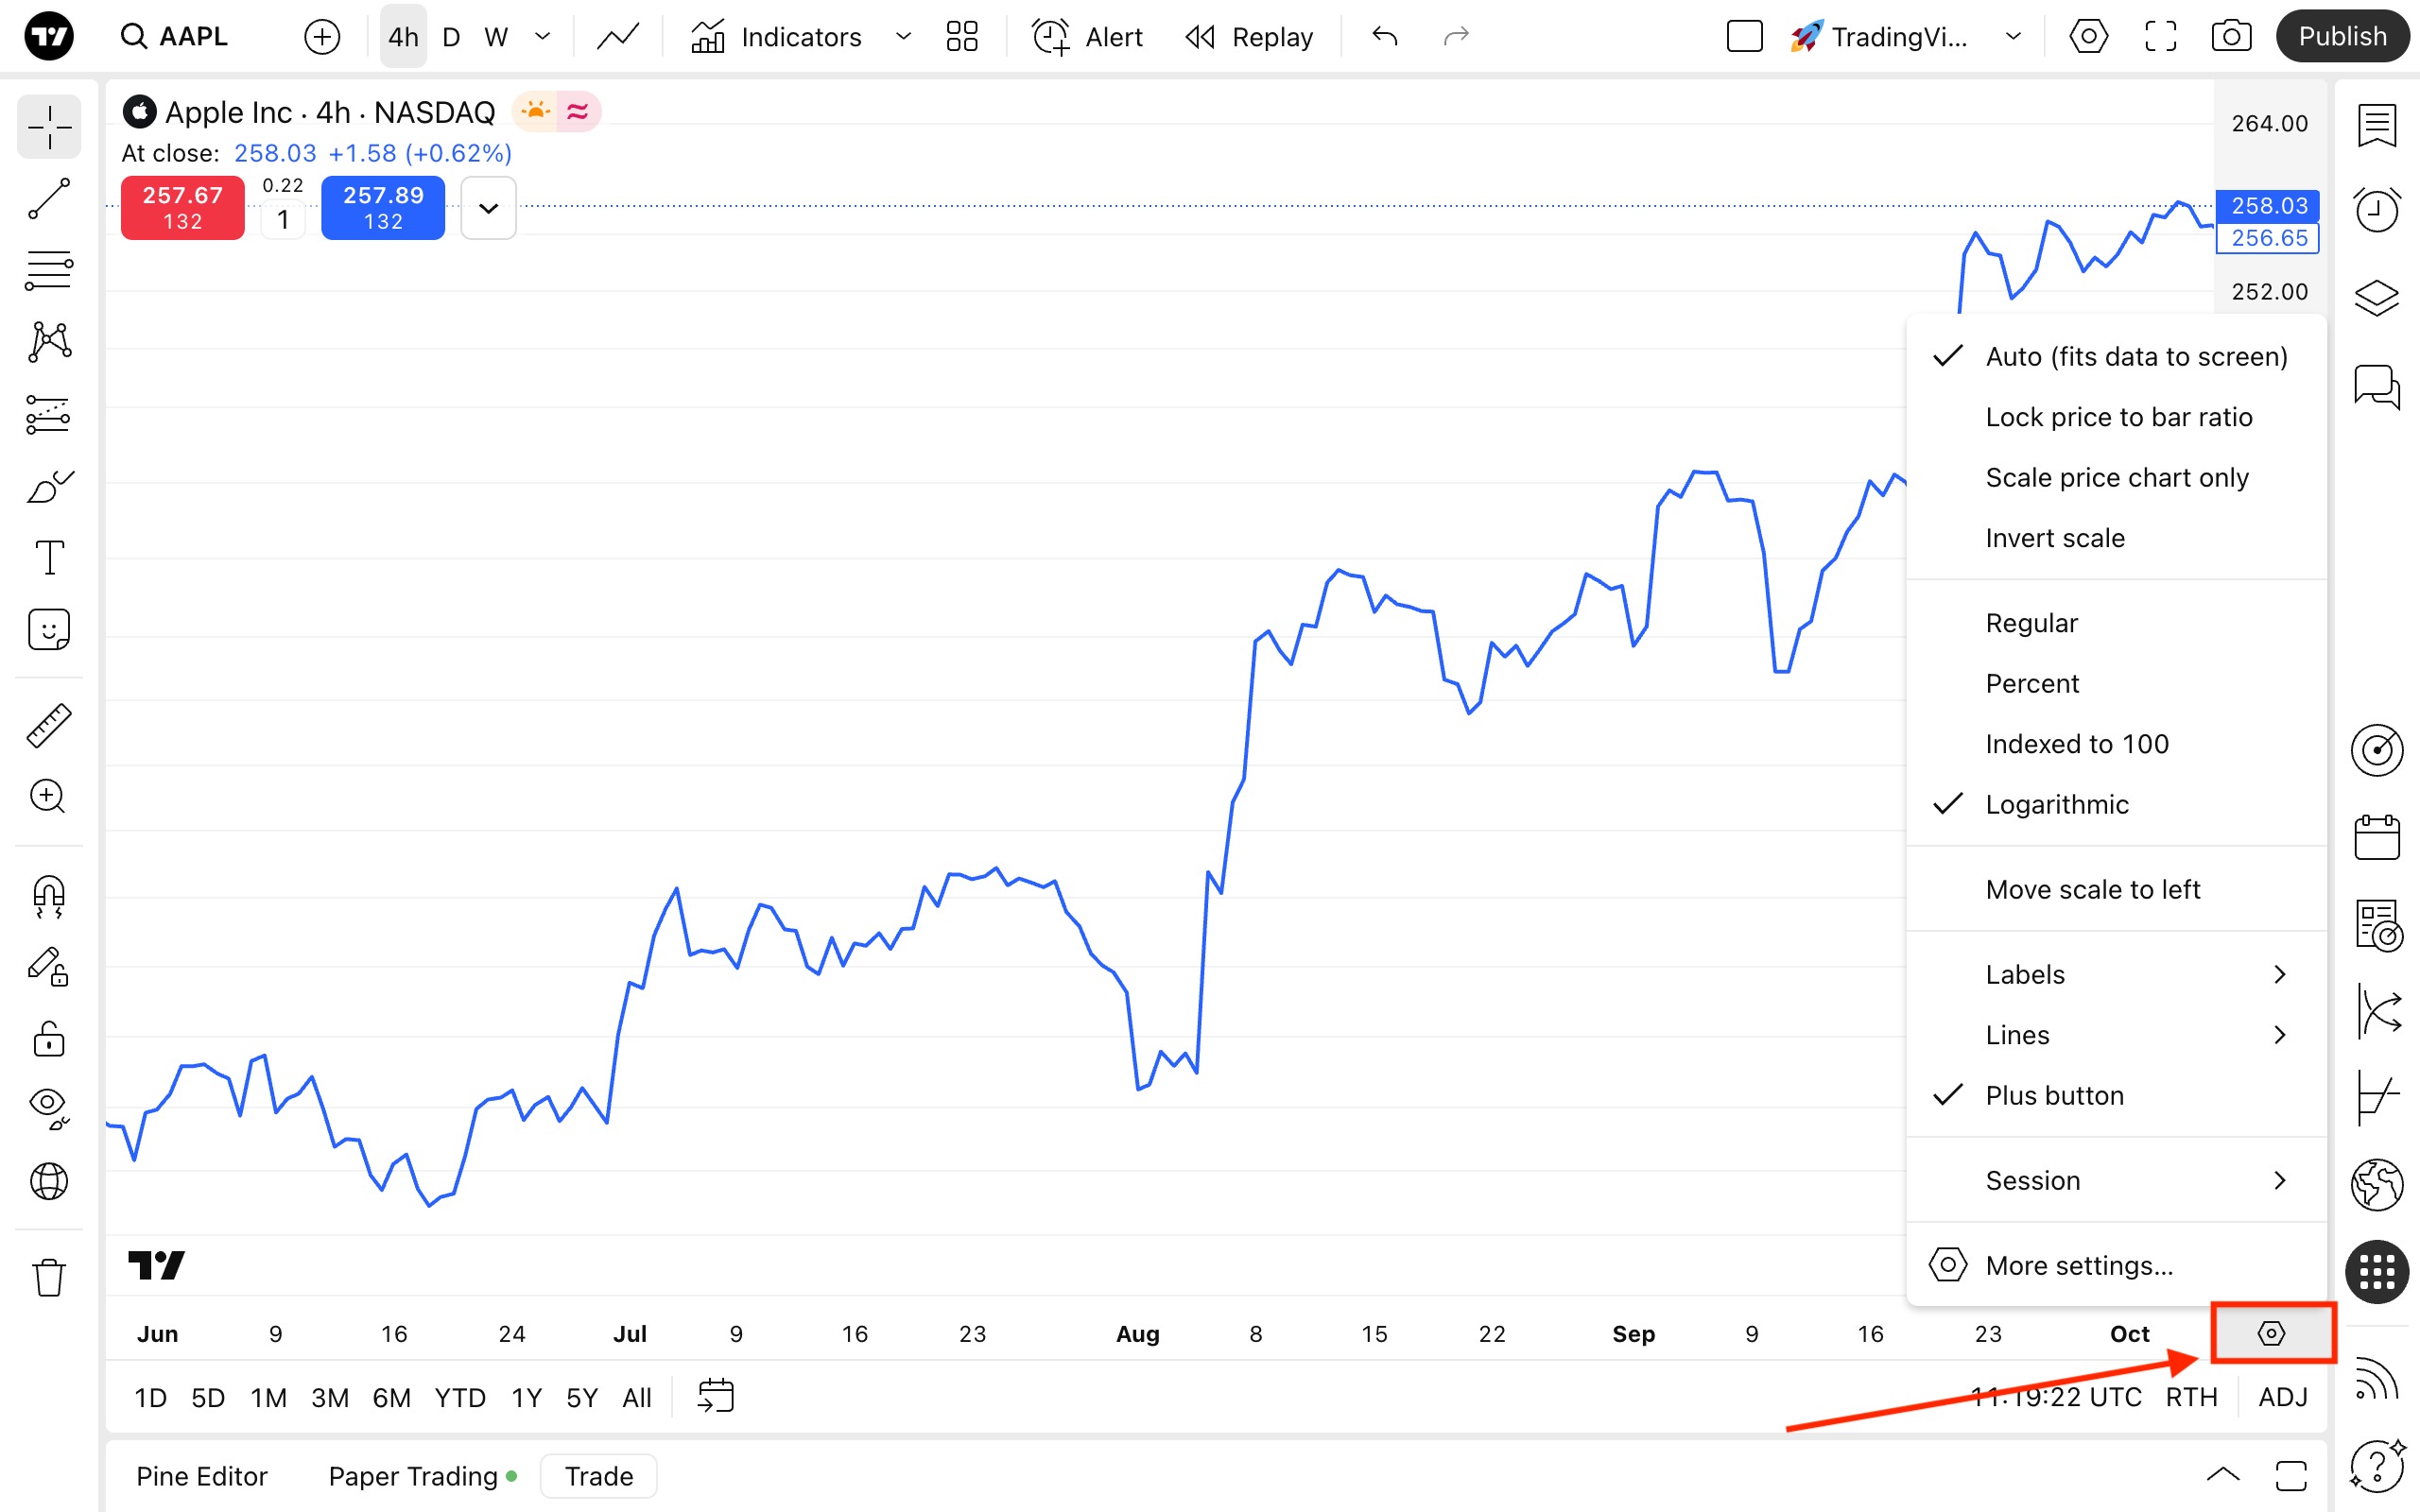 ที่ด้านล่างจะเป็นแผงเลื่อนที่มี:
แผงเครื่องมือด้านบน
ที่นี้ คุณสามารถตั้งค่าชาร์ตของคุณได้โดยการเลือกสัญลักษณ์ ช่วงเวลาและประเภทของชาร์ต อินดิเคเตอร์ เลย์เอาท์ และพารามิเตอร์อื่นๆ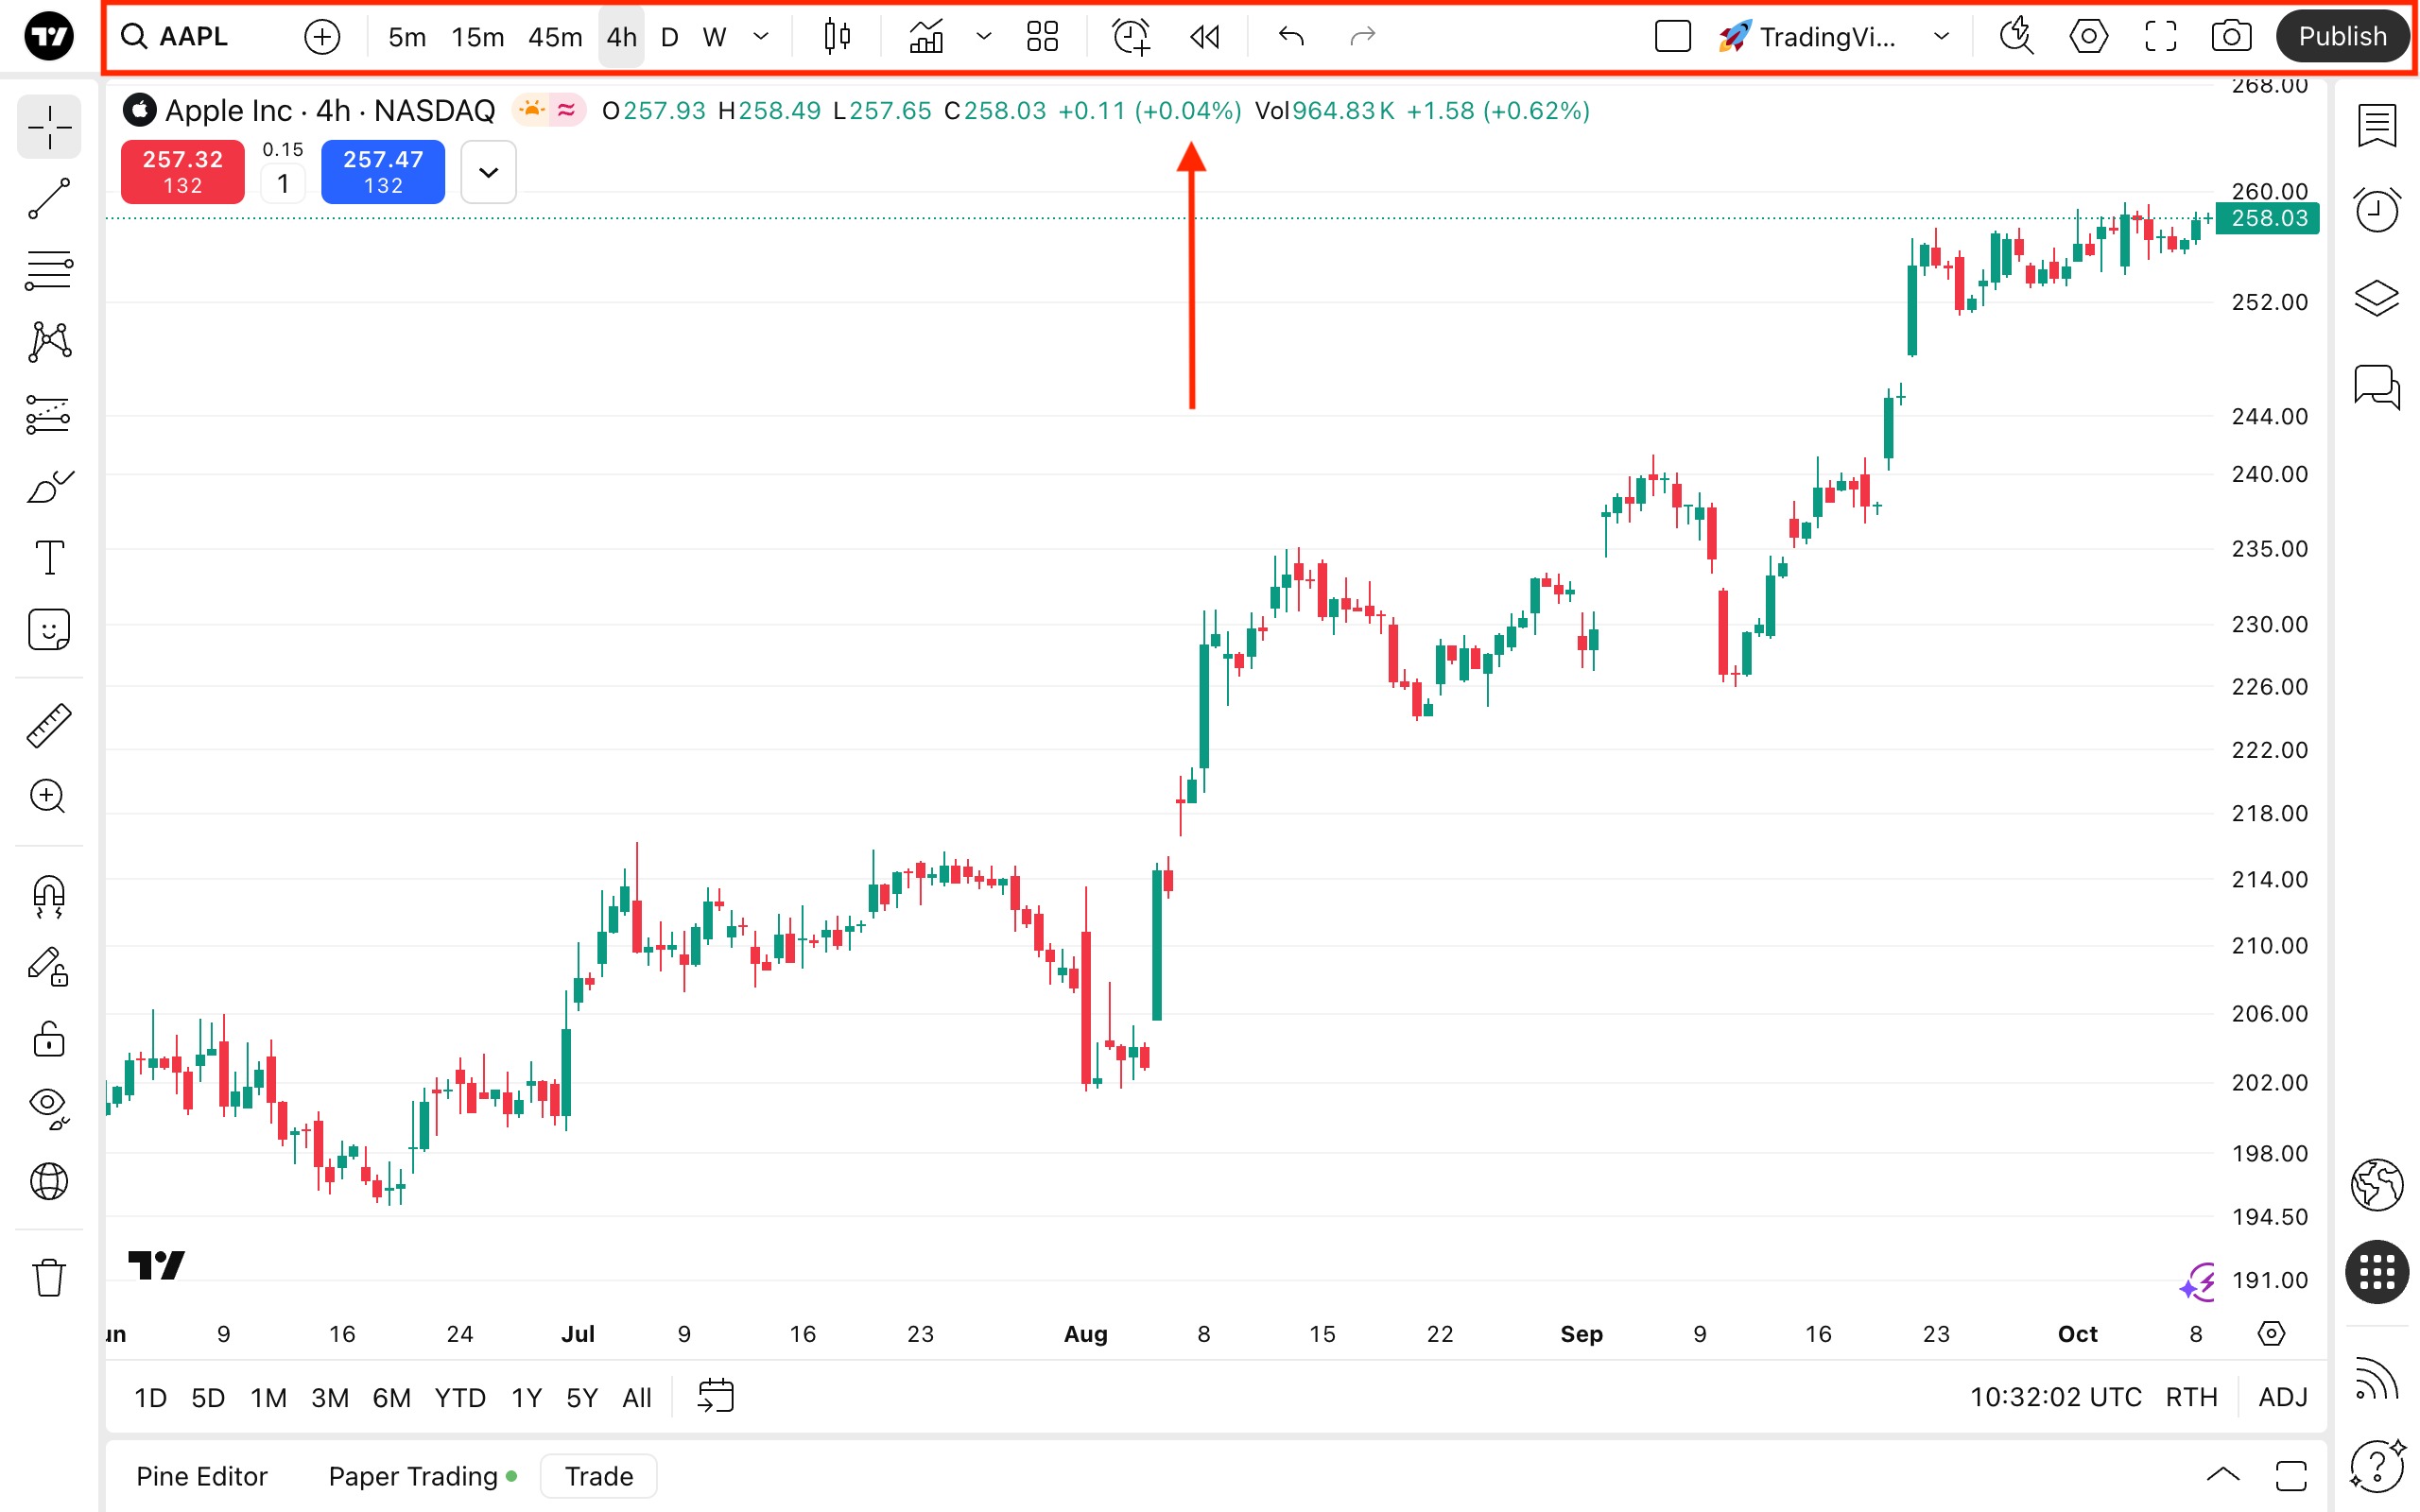
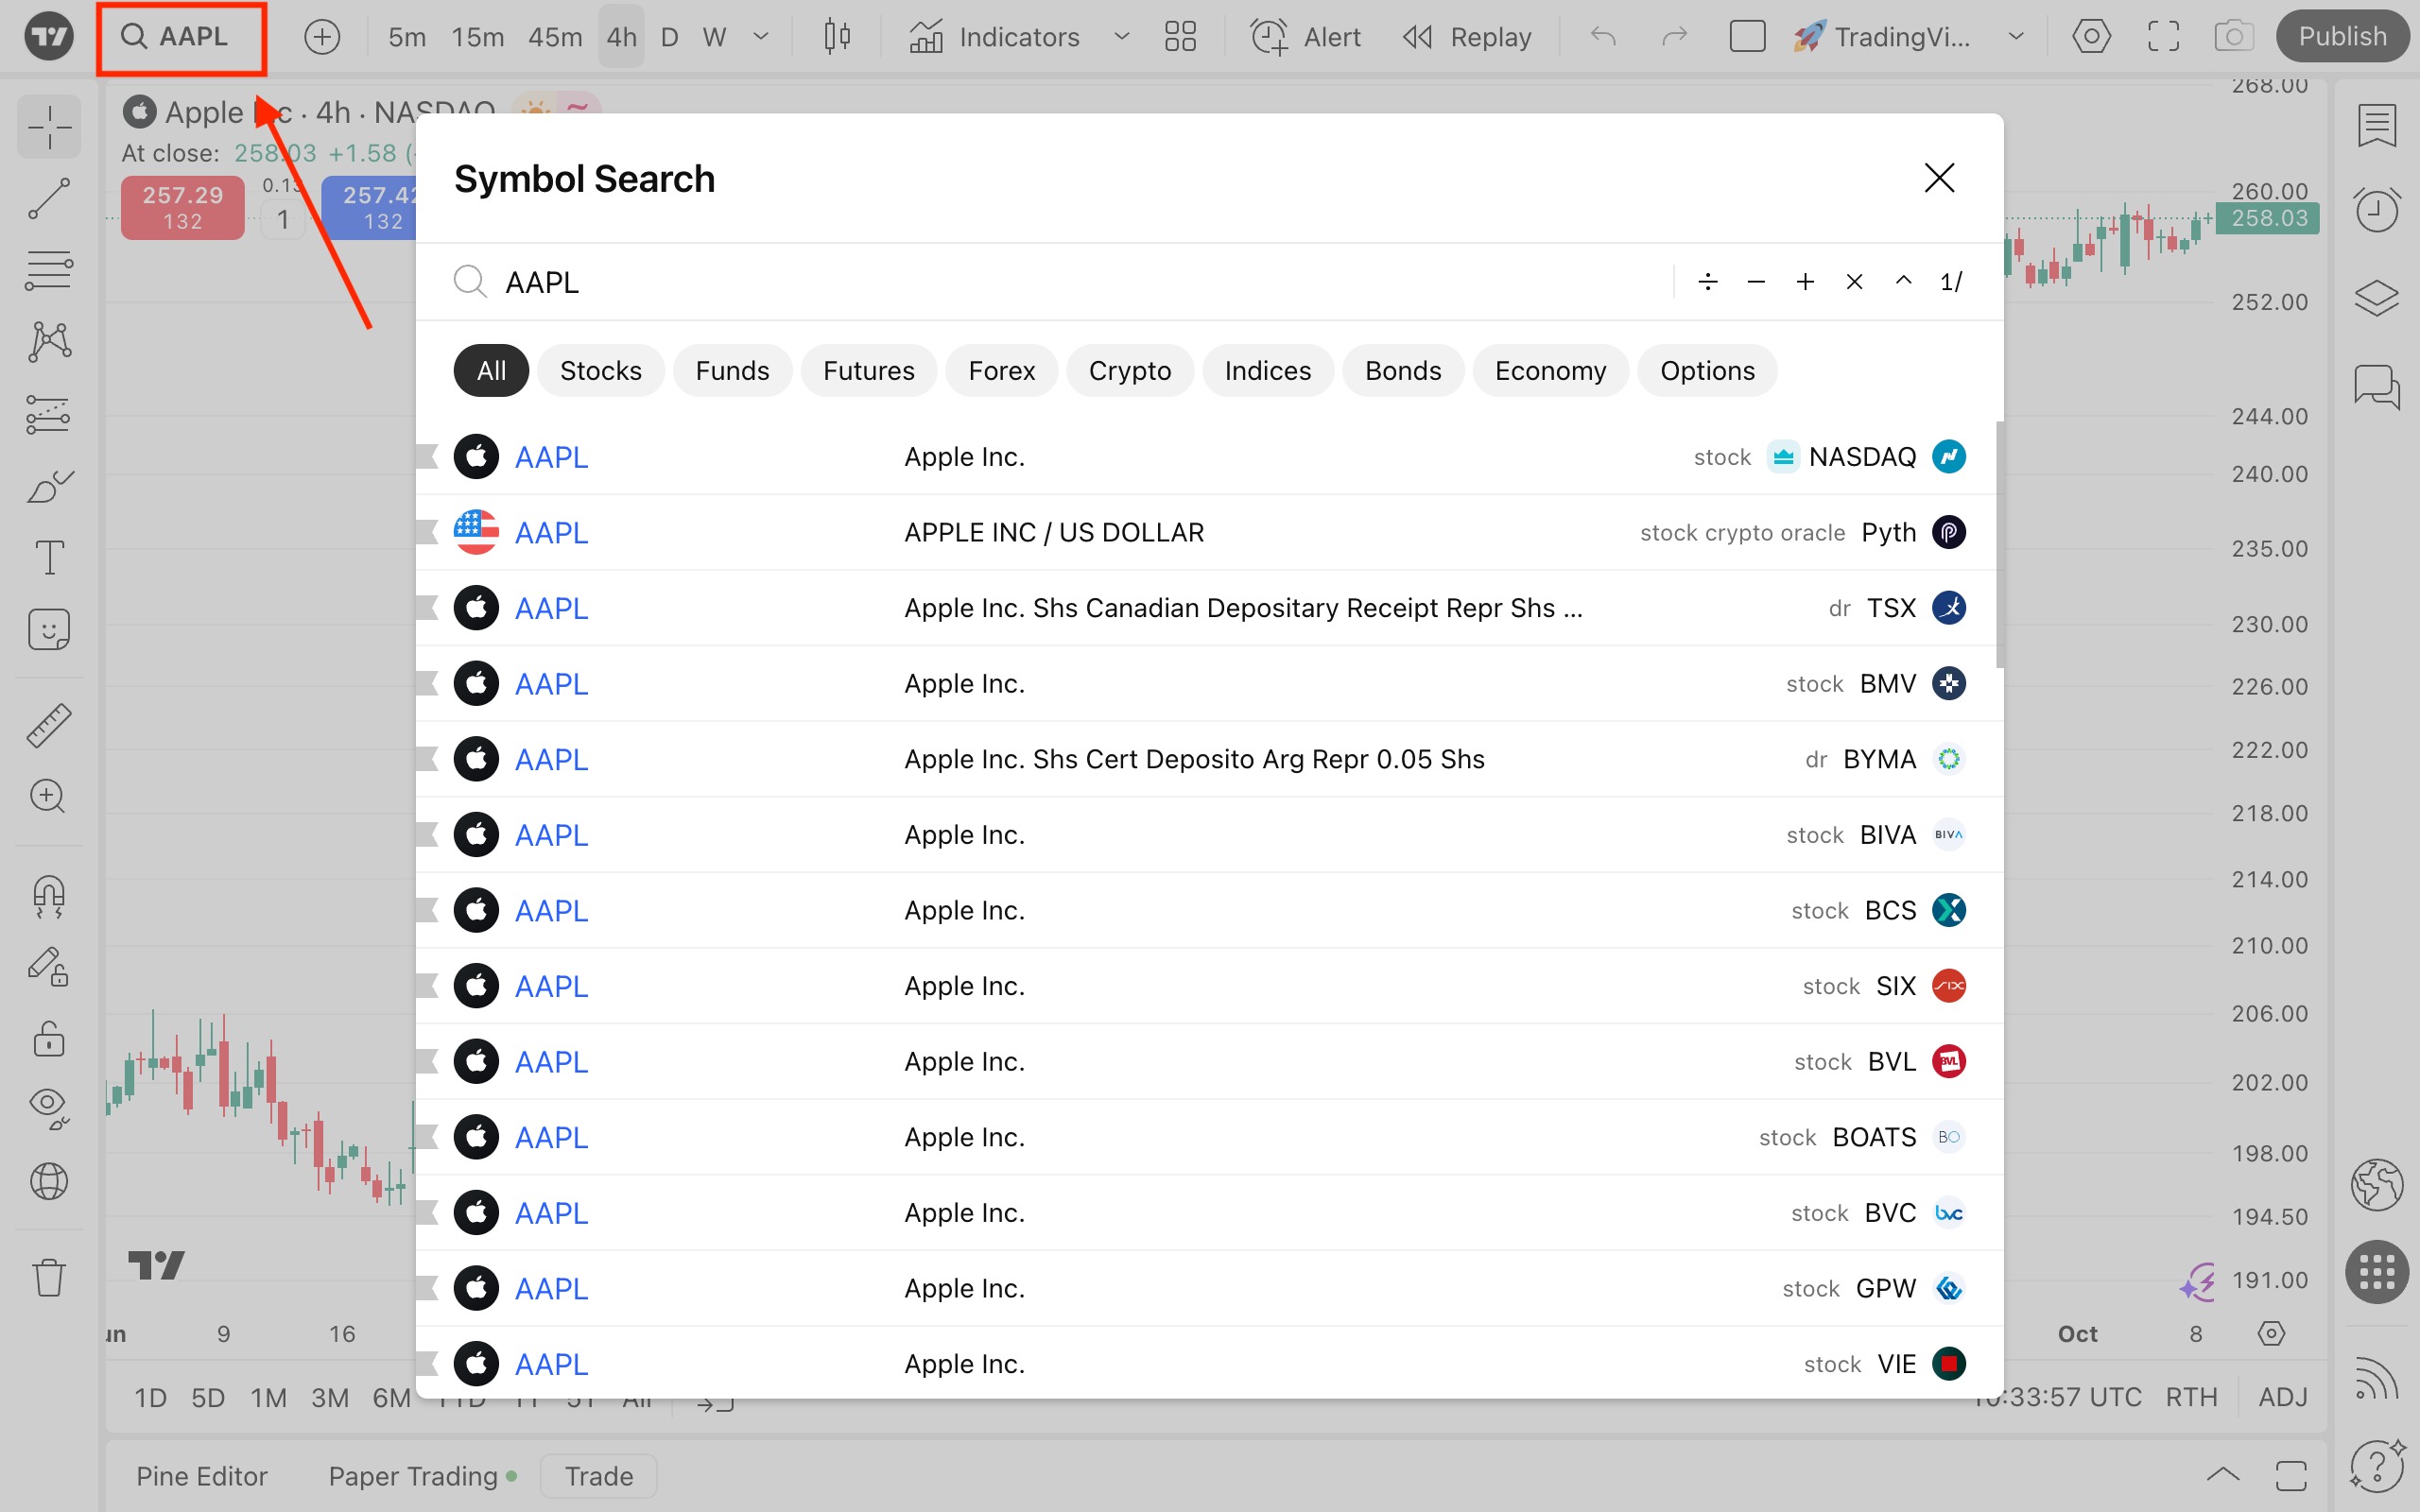
ค้นหาสัญลักษณ์
เลือกสัญลักษณ์ที่จะแสดงบนชาร์ต มีสองวิธีในการเปิดใช้งานการค้นหาสัญลักษณ์- คลิกที่ปุ่มที่มีไอคอนแว่นขยาย
- เริ่มพิมพ์สัญลักษณ์ ตัวอย่างเช่น หากต้องการเปิดชาร์ตหุ้นของ Apple เพียงแค่พิมพ์ "AAPL"
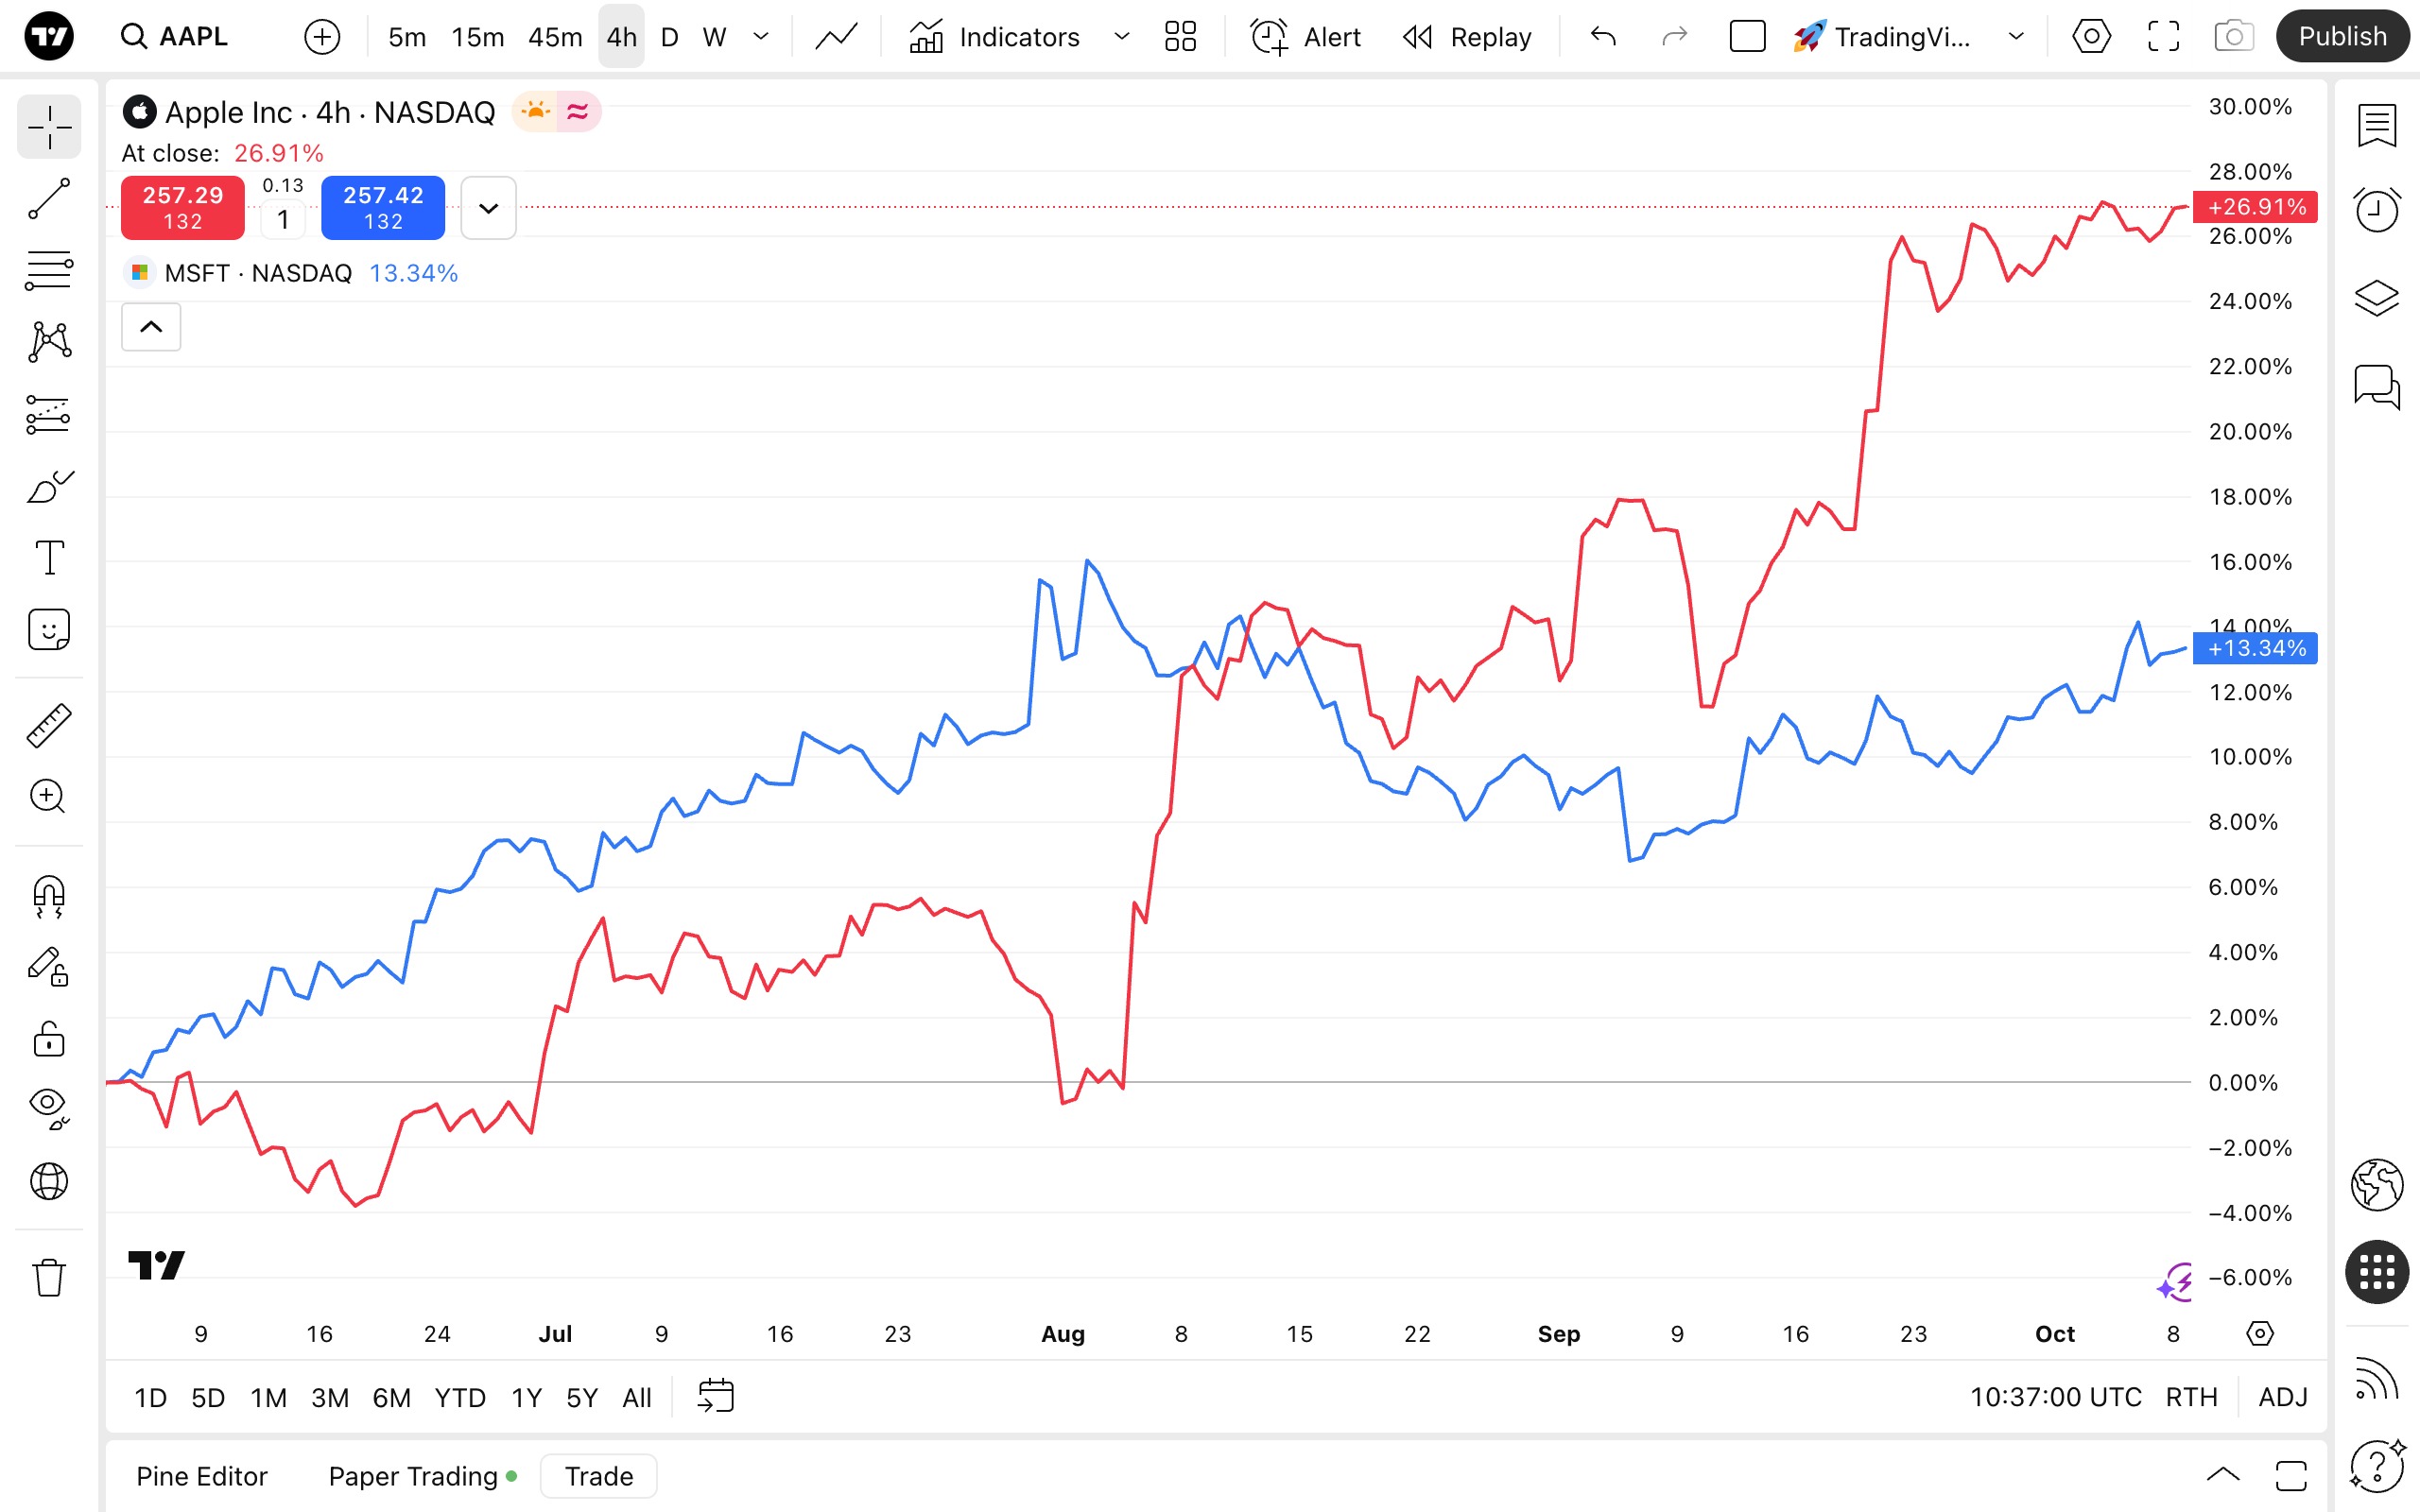
เปรียบเทียบหรือเพิ่มสัญลักษณ์
ปุ่มนี้ช่วยให้คุณสามารถเลือกสัญลักษณ์เพิ่มเพื่อแสดงบนชาร์ตร่วมกับสัญลักษณ์ปัจจุบัน คุณสมบัตินี้ช่วยให้คุณเปรียบเทียบสินทรัพย์บนชาร์ตเดียวกันเพื่อการวิเคราะห์ที่ครอบคลุมยิ่งขึ้นประเภทชาร์ต
ที่นี่ คุณสามารถเลือกได้จากมากกว่า 20 ประเภทชาร์ต แต่ละแบบสามารถปรับแต่งให้เหมาะกับวิธีการวิเคราะห์ของคุณได้ เลือกตั้งแต่ บาร์ชาร์ต และ ชาร์ตแท่งเทียน ไปจนถึงตัวเลือกที่ซับซ้อนกว่า เช่น ชาร์ต Renko —ลองศึกษาดูว่าควรใช้งานอย่างไรจาก ชาร์ตแต่ละประเภท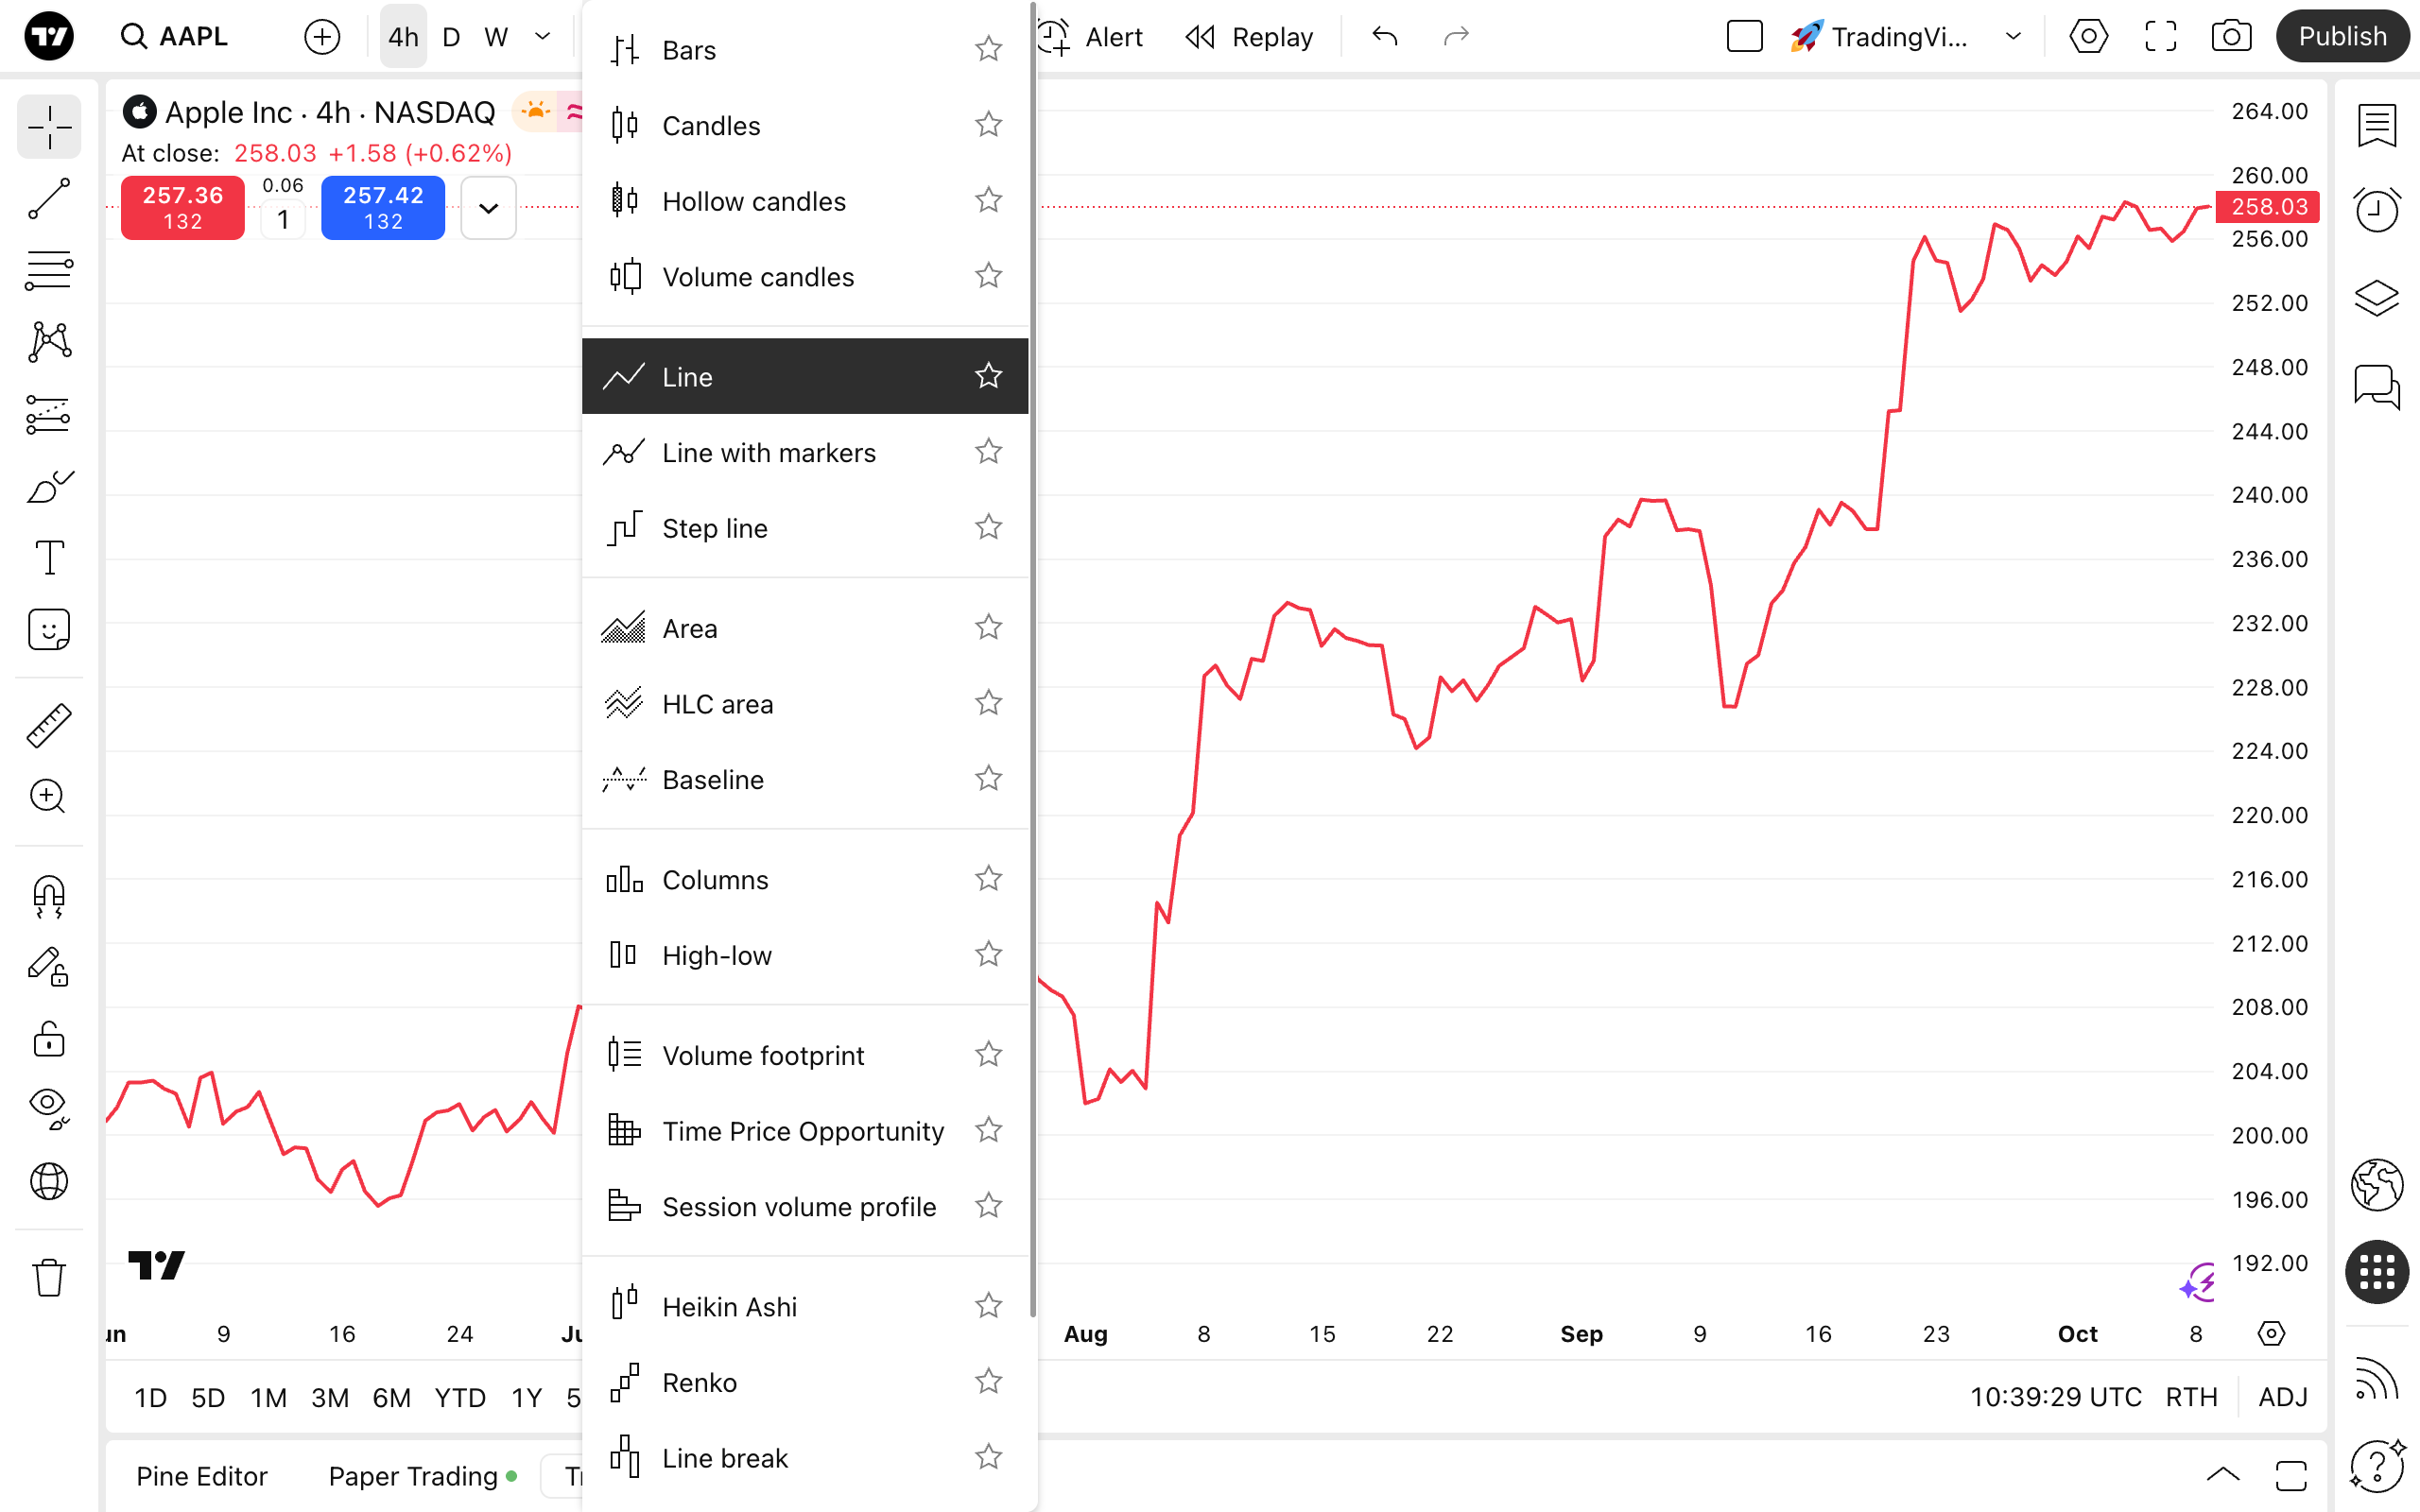
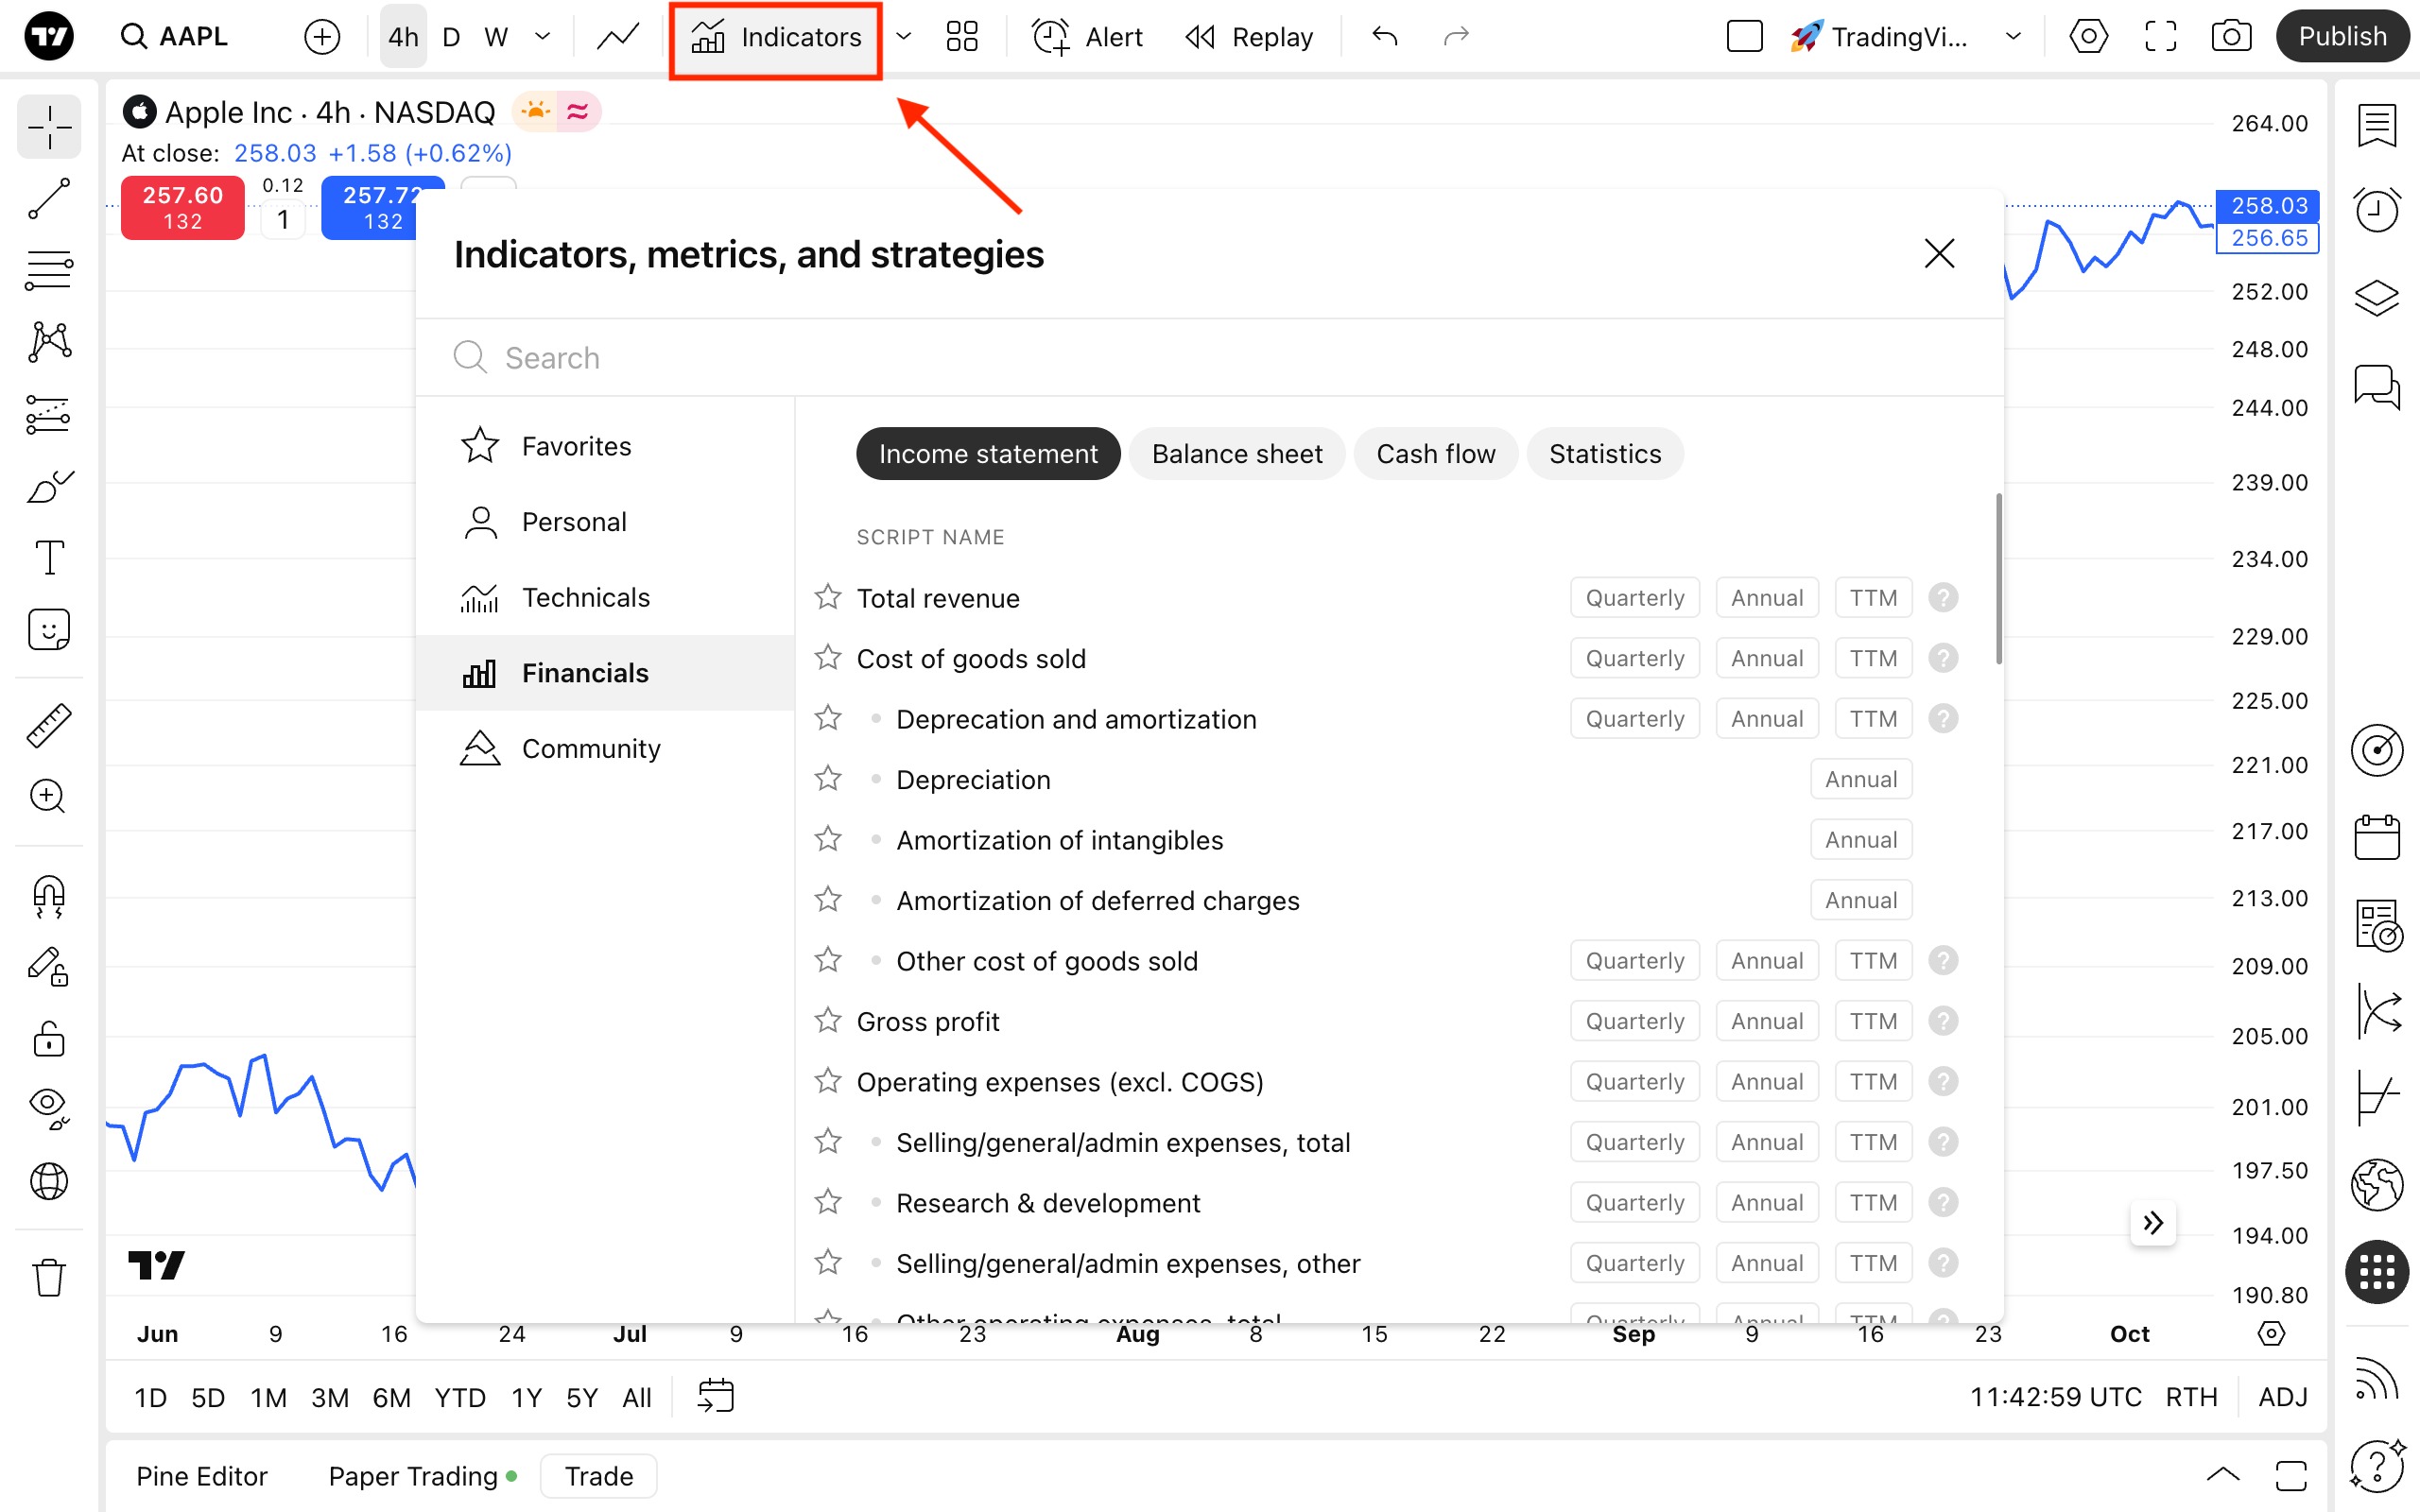
อินดิเคเตอร์ ตัวชี้วัด และกลยุทธ์
จากที่นี่คุณเตรียมตัวการเทรดของคุณ ด้วยเครื่องมืออันทรงพลังเหล่านี้ให้ข้อมูลเชิงลึกที่จำเป็นเพื่อช่วยนำทางคุณในตลาด- อินดิเคเตอร์ คือฟังก์ชันที่ใช้ในการวิเคราะห์ทางเทคนิคเพื่อคาดการณ์ราคาในอนาคตโดยอิงจากการเคลื่อนไหวและปริมาณการซื้อขายสินทรัพย์
- ทางพื้นฐาน หรือข้อมูลทางการเงินเป็นตัวแทนของ ข้อมูลทางการเงินสำหรับการวิเคราะห์พื้นฐาน มาจากรายงานผลการดำเนินงานของบริษัท
- กลยุทธ์ เป็นสคริปต์เฉพาะที่เขียนด้วย ภาษา Pine Script® ซึ่งสามารถส่ง แก้ไข ดำเนินการ และยกเลิกคำสั่งซื้อหรือขายและจำลองการซื้อขายจริงได้บนชาร์ตของคุณ
เลย์เอาท์
ในเมนูการตั้งค่าเลย์เอาท์ คุณสามารถกำหนดจำนวนและตำแหน่งของชาร์ตได้ โดยพื้นฐานแล้วเลย์เอาท์คือพื้นที่ทำงานที่บันทึกแยกกัน ชาร์ตแต่ละรายการภายในเลย์เอาท์ จะคงการตั้งค่าของตัวเองไว้และสามารถปรับแต่งได้อย่างอิสระ แต่คุณยังสามารถเลือกที่จะซิงค์ค่าเหล่านี้ได้ด้วยค้นหาเร่งด่วน
เพื่ออำนวยความสะดวกในการนำทาง ให้คลิกที่ปุ่ม ค้นหาเร่งด่วน นี่เป็นวิธีง่ายๆ ในการค้นหาเครื่องมือ ฟังก์ชัน ภาพวาด หรือการตั้งค่าการตั้งค่า
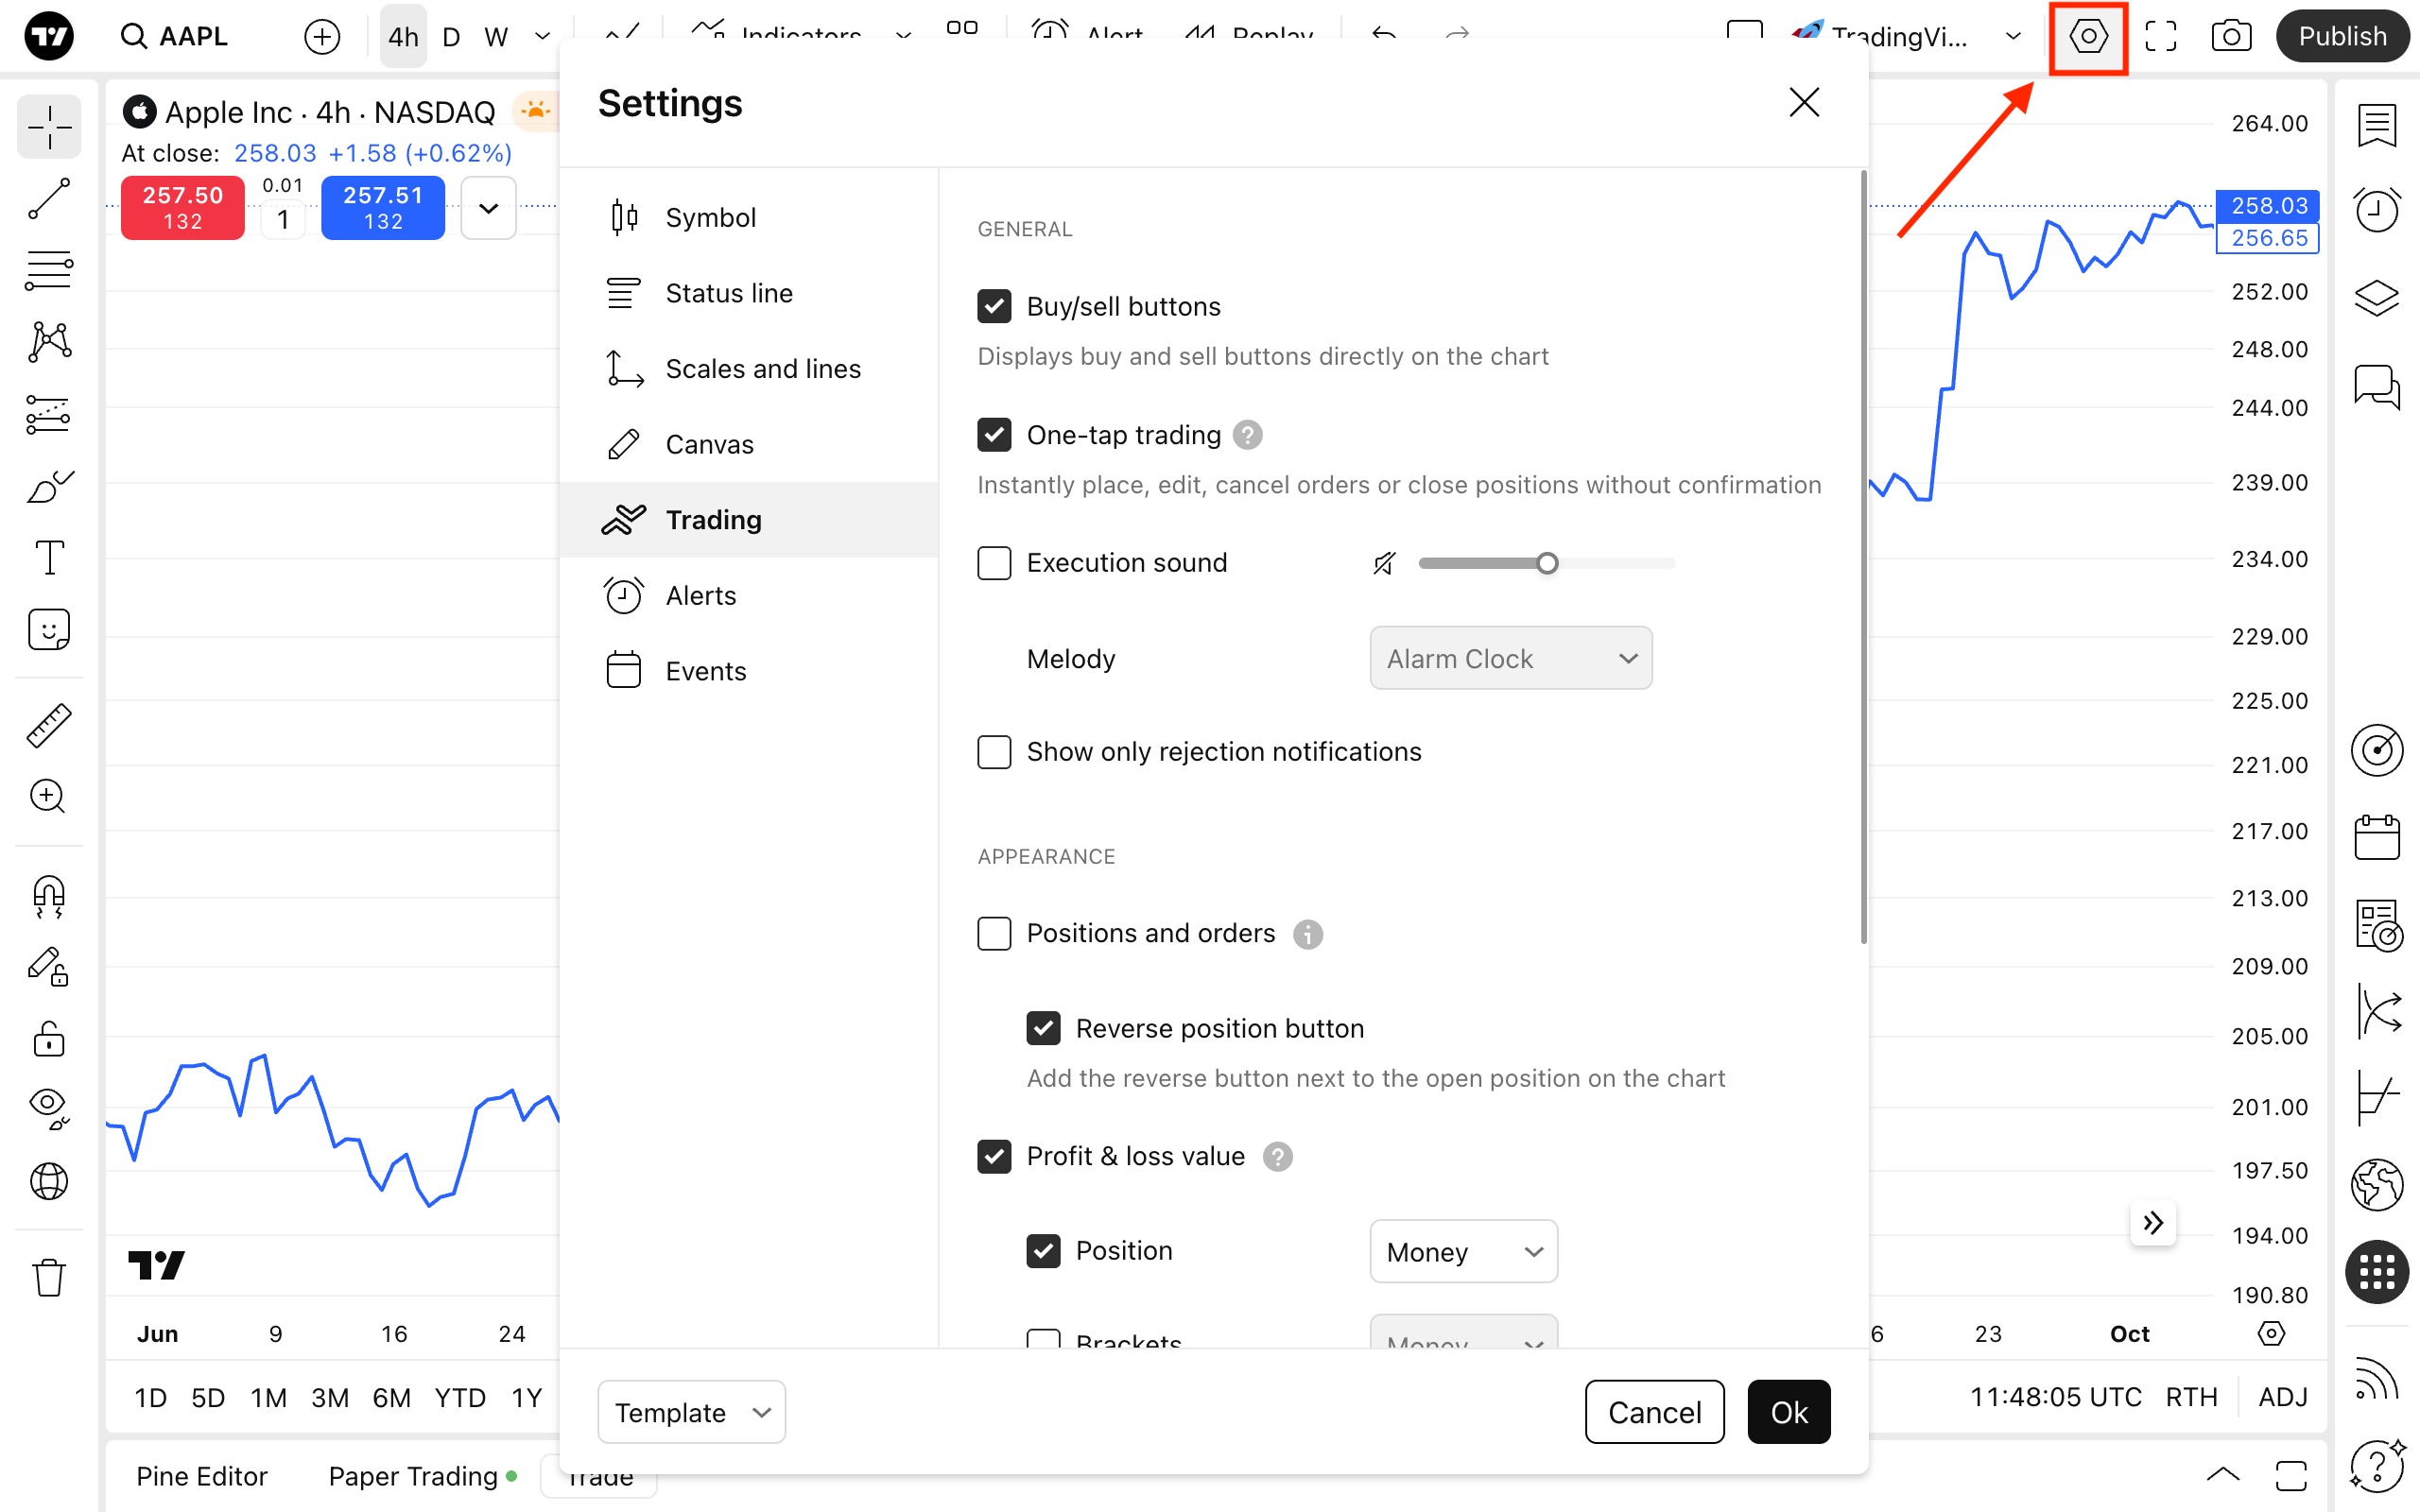
คุณสามารถกำหนดค่าชาร์ตได้ตามต้องการ หากต้องการเปิดเมนูการตั้งค่า ให้คลิกปุ่มการตั้งค่าที่มุมขวาบน หรือดับเบิลคลิกที่เส้นราคา/บาร์/แท่งเทียน- สัญลักษณ์: ตั้งค่าพารามิเตอร์สำหรับประเภทชาร์ต ชาร์ตแต่ละประเภทมีการทำงานที่แตกต่างกัน และจะมีการตั้งค่าเฉพาะตัวที่ใช้กับชาร์ตแต่ละประเภท ไปที่แหล่งความรู้เพื่ออ่านเกี่ยวกับ ประเภทชาร์ต
- บรรทัดสถานะ: เลือกค่าที่จะแสดงคู่กับชื่อสัญลักษณ์ที่ด้านบนของชาร์ต
- สเกลและเส้น: เลือกการมองเห็นของเส้นและสเกล สี และรูปแบบวันที่และเวลา
- ผ้าใบ: เปลี่ยนรูปแบบพื้นหลังของชาร์ต มาตราส่วนขนาดตัวอักษร ความสามารถในการมองเห็นปุ่ม และระยะขอบ
- พารามิเตอร์การซื้อขาย: สลับปุ่มซื้อและขายเปิด/ปิด การแจ้งเตือน และรูปลักษณ์
- การแจ้งเตือน: จัดการการมองเห็นและปริมาณการแจ้งเตือน
- เหตุการณ์: แสดงหรือซ่อนไอเดีย เหตุการณ์ทางเศรษฐกิจ หรือข่าวสารบนชาร์ตโดยตรง
บันทึกภาพ
ปุ่มนี้ช่วยให้คุณสามารถ จับภาพ ชาร์ตปัจจุบันของคุณได้ ดาวน์โหลด บันทึก โพสต์ หรือทวีต — ใช้ทุกฟีเจอร์ในการแบ่งปันไอเดียและรับคำติชมเผยแพร่
เราเชื่อมั่นว่าการเทรดควรมีส่วนร่วมในโซเชียล ด้วยปุ่ม เผยแพร่ คุณสามารถแบ่งปันไอเดีย — โพสต์พร้อมการวิเคราะห์ตลาดของคุณที่เป็นส่วนหนึ่งของชุมชน TradingView เรียนรู้วิธีการที่จะกลายเป็นผู้เขียนชั้นแนวหน้า ด้วยการสร้างและเผยแพร่แนวคิดคุณภาพสูงอย่างสม่ำเสมอแผงเครื่องมือด้านซ้าย
จากที่นี่ คุณสามารถเข้าถึง เครื่องมือวาดภาพ เพื่อการจดบันทึก เพิ่มความคิดเห็น วาดแนวโน้มและรูปแบบ ทำการวัดและคาดการณ์ รวมทั้งคำนวณระดับราคา- เคอร์เซอร์: เลือกประเภทเคอร์เซอร์ที่จะช่วยให้คุณนำทางชาร์ตของคุณได้ดีขึ้น
- เครื่องมือ เส้นแนวโน้ม: เลือกเส้น แชนแนล หรือ pitchforks เพื่อทำเครื่องหมายทิศทางการเคลื่อนไหวและระดับราคา
- เครื่องมือ Gann และ Fibonacci: สร้างระดับโดยอัตโนมัติโดยอิงตามสูตร Fibonacci และทฤษฎี Gann ปรับจำนวนระดับและค่าสัมประสิทธิ์ตามต้องการ
- รูปแบบ: ใช้งาน Elliott waves เพื่อทำเครื่องหมายจุดสูง จุดต่ำ และระยะห่างระหว่างจุดเหล่านั้น และระบุวัฏจักรของตลาด
- เครื่องมือการคาดการณ์และการวัดค่า: วัดช่วงของชาร์ต คาดการณ์การเคลื่อนไหวของราคา และประเมินสถานะการซื้อขาย
- รูปทรงเรขาคณิต: สำหรับใช้งาน แปรง ลูกศร และรูปทรงพื้นฐานอื่นๆ
- เครื่องมือคำอธิบายประกอบ: เพื่อเพิ่มข้อความลงในชาร์ตโดยตรง ทำให้การวิเคราะห์ทางเทคนิคชัดเจนยิ่งขึ้น
- ไอคอน: เพื่อเพิ่มอิโมจิ และสติ๊กเกอร์ สลับระหว่างกลุ่มโดยใช้แท็บที่ด้านล่างของเมนู
- การวัด: เพื่อใช้วัดระยะห่างระหว่างแท่ง
- ซูมเข้าไป: เพื่อขยายเข้าไปดูบริเวณที่เลือก
- โหมดแม่เหล็ก: เพื่อให้ภาพวาดไป "เกาะ" กับราคาเปิด ราคาสูง ราคาต่ำ หรือราคาปิดที่ใกล้ที่สุด
- อยู่ในโหมดการวาดภาพต่อ: เพื่อเพิ่มวัตถุหลายๆ ชิ้นลงในชาร์ตตามลำดับ
- ล็อครูปวาดทั้งหมด: เพื่อป้องกันการเคลื่อนไหวโดยไม่ได้ตั้งใจ
- ซ่อนตัวเลือก: เพื่อซ่อนการวาด อินดิเคเตอร์ ตำแหน่ง และคำสั่งซื้อ หรือทั้งหมด
- ซิงค์ตัวเลือกการวาดภาพ: เลย์เอาท์เพิ่มเติมทั้งหมดของคุณจะสะท้อนภาพวาดจากเลย์เอาท์เริ่มต้น
- ตัวเลือกการลบ: เพื่อลบรูปวาด อินดิเคเตอร์
แผงเครื่องมือด้านขวา
ช่วยให้คุณเข้าถึงรายการเฝ้าติดตาม ข่าวสาร การแจ้งเตือน และผลิตภัณฑ์อื่นๆ ของเราผ่านทางแผ่นที่ซ้อนขึ้นมาแผงเครื่องมือนี้ช่วยให้คุณติดตามสัญลักษณ์ในรายการเฝ้าติดตาม สร้างและจัดการการแจ้งเตือน ใช้ประโยชน์จากตัวคัดกรองและปฏิทิน และอื่นๆ อีกมากมายเครื่องมือที่คุณสามารถเข้าถึงได้:
- รายการเฝ้าติดตาม รายละเอียด และ ข่าวสาร: เพื่อให้ง่ายในการติดตามสัญลักษณ์ ตรวจสอบข้อมูลทางการเงินและข้อมูลทางเทคนิค และสำรวจข่าวสารล่าสุดได้อย่างง่ายดาย สร้างหรือทำการนำเข้ารายการใหม่ นำทางไปยังรายการที่มีอยู่ และจัดการรายการเหล่านั้นอย่างมีประสิทธิภาพ คุณสามารถตั้งค่าการแจ้งเตือนโดยเฉพาะสำหรับรายการเฝ้าติดตามได้
- การแจ้งเตือน: เพื่อจัดการการแจ้งเตือนของคุณในราคา อินดิเคเตอร์ และกลยุทธ์
- Object tree และหน้าต่างข้อมูล: เพื่อจัดการรูปวาดหรืออินดิเคเตอร์ที่คุณนำไปใช้กับชาร์ตได้
- ตัวช่วยคัดกรอง: เพื่อเปิดและสลับระหว่างโปรแกรมตัวคัดกรองของ TradingView เพื่อเรียกดูตลาดโดยไม่ต้องออกจากชาร์ตของคุณ
- ปฏิทิน: ช่วยให้คุณติดตามเหตุการณ์ทางเศรษฐกิจที่สำคัญที่สุดและกิจกรรมของบริษัทต่างๆ
- Options: เป็นเครื่องมือทางการเงินที่มีประสิทธิภาพสำหรับการซื้อขายเก็งกำไรและการป้องกันความเสี่ยง
- ฟีดชุมชน: คุณจะพบโพสต์ของคุณ ตัวเลือกของบรรณาธิการ และสิ่งที่ได้รับความนิยมในขณะนี้
- การแจ้งเตือน: ตรวจสอบ เครือข่ายโซเชียลจากชุมชน TradingView สำหรับความคิดเห็น การถูกกล่าวถึง หรือกิจกรรมอื่นๆ ของคุณ
- ผู้ช่วยแชท: ให้ข้อมูลเกี่ยวกับผลิตภัณฑ์ TradingView ชาร์ต อินดิเคเตอร์ และการสมัครสมาชิกได้ หากคุณต้องการความช่วยเหลือในระหว่างการจัดทำชาร์ต คุณสามารถเข้าถึง แหล่งความรู้ ได้จากที่นี่
แผงเครื่องมือด้านล่าง
ในแผงนี้ คุณสามารถสลับระหว่างช่วงเวลา ตั้งค่าโซนเวลา และปรับแต่งมาตราส่วนราคาได้
- Pine editor: สร้างอินดิเคเตอร์และกลยุทธ์ที่ไม่ซ้ำใครด้วย Pine Script® จัดการมัน เพิ่มลงในชาร์ตทันที และแบ่งปันกับผู้ซื้อขายรายอื่น
- หน้าต่างการซื้อขาย: คุณสามารถเชื่อมต่อโบรกเกอร์ที่คุณชื่นชอบเพื่อทำการซื้อขายจากชาร์ตของคุณได้