"Swap" - Bool/Position/Value : Array / Matrix / Var AutoswapLibrary "swap"
Side / Boundary Based All Types Swapper
- three automagical types for Arrays, Matrixes, and Variables
-- no signal : Long/ Short position autoswap
-- true / false : Boolean based side choice
-- Src / Thresh : if source is above or below the threshold
- two operating modes for variables, Holding mode only for arrays/matrixes
-- with two items, will automatically change between the two caveat is it does not delete table/box/line(fill VAR items automatically)
-- with three items, a neutral is available for NA input or neutral
- one function name for all of them. One import name that's easy to type/remember
-- make life easy for your conditional items.
side(source, thresh, _a, _b, _c)
side Change outputs based on position or a crossing level
Parameters:
source : (float) OPTIONAL value input
thresh : (float) OPTIONAL boundary line to cross
_a : (any) if Long/True/Above
_b : (any) if Short/False/Below
_c : (any) OPTIONAL NOT FOR MTX OR ARR... Neutral Item, if var/varip on a/b it will leave behind, ie, a table or box or line will not erase , if it's a varip you're sending in.
Returns: first, second, or third items based on input conditions
Please notify if bugs found.
Thanks.
Utility

No Active BarThis is probably the only script on TradingView that's clinically proven to lower your blood pressure!***
This script in conjunction with some chart settings changes can completely hide the active candle, only showing historic candles, thus, reducing risk of cardiac arrest and or panic attack.
What to do:
0. Make sure you are using a candlestick chart or this script won't work properly
1. Right click the chart and select "Settings..."
2. Select "Symbol" under the "Chart Settings" menu
3. Disable every item EXCEPT for the "Body"
4. Click on the boxes next to "Body" to access the color picker then change both box's transparency settings down to 0
(the script only colors closed bars, so the active bar will be present just transparent)
5. Right click on the price scale on the far left or far right side of the screen and hover the mouse over "Labels". If any selections have a check mark next to them click them to disable them (especially the "Ask & Bid" price setting since it tracks current price)
That's it! Instead of wicks the High & Low prices are plotted above and below the candles using a step line. It looks a bit strange at first but you'll get used to it. Check out the indicator settings to change the color and style of the High & Low lines.
***The statement could prove true for some but is mostly complete bullshit

matrixautotableLibrary "matrixautotable"
Automatic Table from Matrixes with pseudo correction for na values and default color override for missing values. uses overloads in cases of cheap float only, with additional addon for strings next, then cell colors, then text colors, and tooltips last.. basic size and location are auto, include the template to speed this up...
TODO : make bools version
var string group_table = ' Table'
var int _tblssizedemo = input.int ( 10 )
string tableYpos = input.string ( 'middle' , '↕' , inline = 'place' , group = group_table, options= )
string tableXpos = input.string ( 'center' , '↔' , inline = 'place' , group = group_table, options= , tooltip='Position on the chart.')
int _textSize = input.int ( 1 , 'Table Text Size' , inline = 'place' , group = group_table)
var matrix _floatmatrix = matrix.new (_tblssizedemo, _tblssizedemo, 0 )
var matrix _stringmatrix = matrix.new (_tblssizedemo, _tblssizedemo, 'test' )
var matrix _bgcolormatrix = matrix.new (_tblssizedemo, _tblssizedemo, color.white )
var matrix _textcolormatrix = matrix.new (_tblssizedemo, _tblssizedemo, color.black )
var matrix _tooltipmatrix = matrix.new (_tblssizedemo, _tblssizedemo, 'tool' )
// basic table ready to go with the aboec matrixes (replace in your code)
// for demo purpose, random colors, random nums, random na vals
if barstate.islast
varip _xsize = matrix.rows (_floatmatrix) -1
varip _ysize = matrix.columns (_floatmatrix) -1
for _xis = 0 to _xsize -1 by 1
for _yis = 0 to _ysize -1 by 1
_randomr = int(math.random(50,250))
_randomg = int(math.random(50,250))
_randomb = int(math.random(50,250))
_randomt = int(math.random(10,90 ))
bgcolor = color.rgb(250 - _randomr, 250 - _randomg, 250 - _randomb, 100 - _randomt )
txtcolor = color.rgb(_randomr, _randomg, _randomb, _randomt )
matrix.set(_bgcolormatrix ,_yis,_xis, bgcolor )
matrix.set(_textcolormatrix ,_yis,_xis, txtcolor)
matrix.set(_floatmatrix ,_yis,_xis, _randomr)
// random na
_ymiss = math.floor(math.random(0, _yis))
_xmiss = math.floor(math.random(0, _xis))
matrix.set( _floatmatrix ,_ymiss, _xis, na)
matrix.set( _stringmatrix ,_ymiss, _xis, na)
matrix.set( _bgcolormatrix ,_ymiss, _xis, na)
matrix.set( _textcolormatrix ,_ymiss, _xis, na)
matrix.set( _tooltipmatrix ,_ymiss, _xis, na)
// import here
import kaigouthro/matrixautotable/1 as mtxtbl
// and render table..
mtxtbl.matrixtable(_floatmatrix, _stringmatrix, _bgcolormatrix, _textcolormatrix, _tooltipmatrix, _textSize ,tableYpos ,tableXpos)
matrixtable(_floatmatrix, _stringmatrix, _bgcolormatrix, _textcolormatrix, _tooltipmatrix, _textSize, tableYpos, tableXpos) matrixtable
Parameters:
_floatmatrix : float vals
_stringmatrix : string
_bgcolormatrix : color
_textcolormatrix : color
_tooltipmatrix : string
_textSize : int
tableYpos : string
tableXpos : string
matrixtable(_floatmatrix, _stringmatrix, _bgcolormatrix, _textcolormatrix, _textSize, tableYpos, tableXpos) matrixtable
Parameters:
_floatmatrix : float vals
_stringmatrix : string
_bgcolormatrix : color
_textcolormatrix : color
_textSize : int
tableYpos : string
tableXpos : string
matrixtable(_floatmatrix, _stringmatrix, _bgcolormatrix, _txtdefcol, _textSize, tableYpos, tableXpos) matrixtable
Parameters:
_floatmatrix : float vals
_stringmatrix : string
_bgcolormatrix : color
_txtdefcol : color
_textSize : int
tableYpos : string
tableXpos : string
matrixtable(_floatmatrix, _stringmatrix, _txtdefcol, _bgdefcol, _textSize, tableYpos, tableXpos) matrixtable
Parameters:
_floatmatrix : float vals
_stringmatrix : string
_txtdefcol : color
_bgdefcol : color
_textSize : int
tableYpos : string
tableXpos : string
matrixtable(_floatmatrix, _txtdefcol, _bgdefcol, _textSize, tableYpos, tableXpos) matrixtable
Parameters:
_floatmatrix : float vals
_txtdefcol : color
_bgdefcol : color
_textSize : int
tableYpos : string
tableXpos : string

Syminfo [Epi]Hello! This little script tells you everything TradingView lets you access in a ticker's syminfo in Pine Script:
- description
- type: crypto, economic, forex, fund, futures, index, spread, stock
- tickerid, such as AMEX:BLOK
- prefix, such as AMEX
- Ticker, such as BLOK
- root: for derivatives such as futures contracts
- currency, such as USD
- base currency: returns 'BTC' for the ticker 'BTCUSD'
- mintick
- point value
- session: regular, extended
- timezone
Some surprises I found in my development:
- there are some more types than mentioned in the documentation,
- the tickerid takes on additional information if you adjust for dividends or show extended session,
- the prefix contains "_DL" additions depending on your data subscriptions, .e.g. "CME_MINI_DL:ES1!",
- with futures, TV will show session.regular both for the 'regular' and the 'electronic' session.
- Unfortunately, syminfo does not contain the 'sector', although TV has the information in the database (the sector is shown in the screener but not accessed in Pine Script).
I use this little utility in my development and hope it's useful for the community. I see such a great number of contributions from the community and would like to give back, even if it's not much.

[TEMPLATE] Code Block Comments█ OVERVIEW
Here I present to the community at large a collection of code comment blocks that I think will be useful, especially for larger script projects bordering on 2,000 lines or above of code.
█ PLANNED FUTURE UPDATES
Work with the community to expand this template to be even more useful with the inclusion of useful global colour sets, variables, tooltips, groups, etc.
better script thumbnail.
full-screen table or label outlining the script's use-cases.

AbdulLibraryLibrary "AbdulLibrary"
The library consists of three sections:
Technical Analysis Functions - A collection of tools commonly used by day traders
Trading Setup Filters Functions - A number of filters that help day traders to screen trading signals
Candlestick Pattern Detection Functions - To detect different candlestick patterns that are used in day trading setups
Note that this would have been possible without the help of @ZenAndTheArtOfTrading as I build-up this library after completing his pine script mastery course so big thanks to him
The content of the library are:-
fibLevels(preDayClose, preDayHigh, preDayLow) Calculates Daily Pivot Point and Fibonacci Key Levels
Parameters:
preDayClose : The previous day candle close
preDayHigh : The previous day candle high
preDayLow : The previous day candle low
Returns: Returns Daily Pivot Point and Fibonacci Key Levels as a tuple
bullishFib(canHigh, canLow, fibLevel) Calculates Fibonacci Levels in Bullish move
Parameters:
canHigh : The high of the move
canLow : The low of the move
fibLevel : The Fib level as % you want to calculate
Returns: Returns The Fib level for the Bullish move
bearishFib(canHigh, canLow, fibLevel) Calculates Fibonacci Levels in Bearish move
Parameters:
canHigh : The high of the move
canLow : The low of the move
fibLevel : The Fib level as % you want to calculate
Returns: Returns The Fib level for the Bearish move
getCandleSize() Calculates the size of candle (high - low) in points
Returns: Returns candle size in points
getCandleBodySize() Calculates the size of candle (close - open) in points
Returns: Returns candle body size in points
getHighWickSize() Calculates the high wick size of candle in points
Returns: Returns The high wick size of candle in points
getLowWickSize() Calculates the low wick size of candle in points
Returns: Returns The low wick size of candle in points
getBodyPercentage() Calculates the candle body size as % of overall candle size
Returns: Returns The candle body size as % of overall candle size
isSwingHigh(period) Checks if the price has created new swing high over a period of time
Parameters:
period : The lookback time we want to check for swing high
Returns: Returns True if the current candle or the previous candle is a swing high
isSwingLow(period) Checks if the price has created new swing low over a period of time
Parameters:
period : The lookback time we want to check for swing low
Returns: Returns True if the current candle or the previous candle is a swing low
isDojiSwingHigh(period) Checks if a doji is a swing high over a period of time
Parameters:
period : The lookback time we want to check for swing high
Returns: Returns True if the doji is a swing high
isDojiSwingLow(period) Checks if a doji is a swing low over a period of time
Parameters:
period : The lookback time we want to check for swing low
Returns: Returns True if the doji is a swing low
isBigBody(atrFilter, atr, candleBodySize, multiplier) Checks if a candle has big body compared to ATR
Parameters:
atrFilter : Check if user wants to use ATR to filter candle-setup signals
atr : The ATR value to be used to compare candle body size
candleBodySize : The candle body size
multiplier : The multiplier to be used to compare candle body size
Returns: Returns Boolean true if the candle setup is big
isSmallBody(atrFilter, atr, candleBodySize, multiplier) Checks if a candle has small body compared to ATR
Parameters:
atrFilter : Check if user wants to use ATR to filter candle-setup signals
atr : The ATR value to be used to compare candle body size
candleBodySize : The candle body size
multiplier : The multiplier to be used to compare candle body size
Returns: Returns Boolean true if the candle setup is small
isHammer(fibLevel, colorMatch) Checks if a candle is a hammer based on user input parameters and candle conditions
Parameters:
fibLevel : Fib level to base candle body on
colorMatch : Checks if user needs for the candel to be green
Returns: Returns Boolean - True if the candle setup is hammer
isShootingStar(fibLevel, colorMatch) Checks if a candle is a shooting star based on user input parameters and candle conditions
Parameters:
fibLevel : Fib level to base candle body on
colorMatch : Checks if user needs for the candel to be red
Returns: Returns Boolean - True if the candle setup is star
isBullEngCan(allowance, period) Check if a candle is a bullish engulfing candle
Parameters:
allowance : How many points the candle open is allowed to be off (To allow for gaps)
period : The lookback period for swing low check
Returns: Boolean - True only if the candle is a bullish engulfing candle
isBearEngCan(allowance, period) Check if a candle is a bearish engulfing candle
Parameters:
allowance : How many points the candle open is allowed to be off (To allow for gaps)
period : The lookback period for swing high check
Returns: Boolean - True only if the candle is a bearish engulfing candle
isBullDoji(maxSize, wickLimit, colorFilter) Check if a candle is a bullish doji candle
Parameters:
maxSize : Maximum candle body size as % of total candle size to be considered as doji
wickLimit : Maximum wick size of one wick compared to the other wick
colorFilter : Checks if the doji is green
Returns: Boolean - True if the candle is a bullish doji
isBearDoji(maxSize, wickLimit, colorFilter) Check if a candle is a bearish doji candle
Parameters:
maxSize : Maximum candle body size as % of total candle size to be considered as doji
wickLimit : Maximum wick size of one wick compared to the other wick
colorFilter : Checks if the doji is red
Returns: Boolean - True if the candle is a bearish doji
isBullOutBar() Check if a candle is a bullish outside bar
Returns: Boolean - True if the candle is a bullish outside bar
isInsideBar() Check if a candle is an inside bar
Returns: Returns Boolean - True if a candle is an inside bar

Punchline_LibLibrary "Punchline_Lib"
roundSmart(float) Truncates decimal points of a float value based on the amount of digits before the decimal point
Parameters:
float : _value any number
Returns: float
tostring_smart(float) converts a float to a string, intelligently cutting off decimal points
Parameters:
float : _value any number
Returns: string

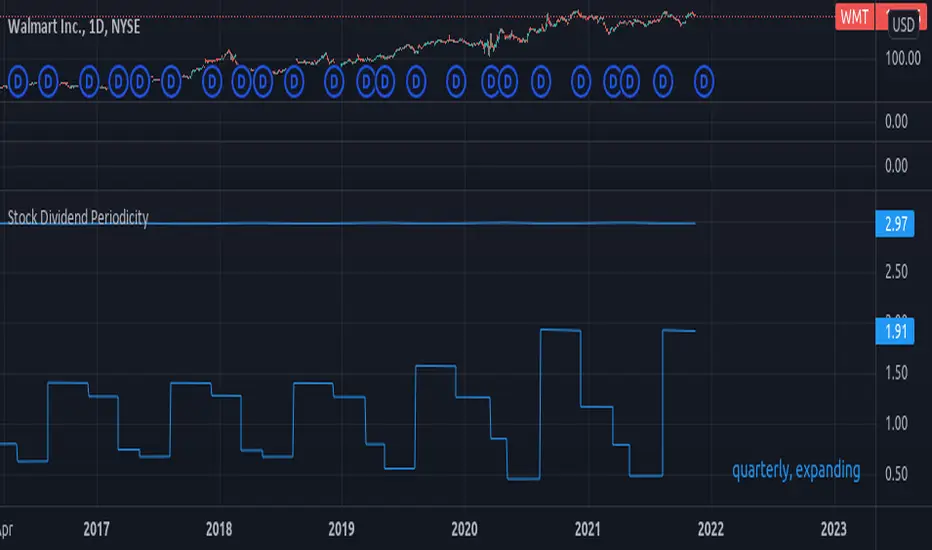
Stock Dividend Periodicityexperimental:
a basic method to evaluate stock dividend periodicity.
known issues:
* it does not adapt well to changes in periodicity, if there is a big enough change on the dividend period plan.
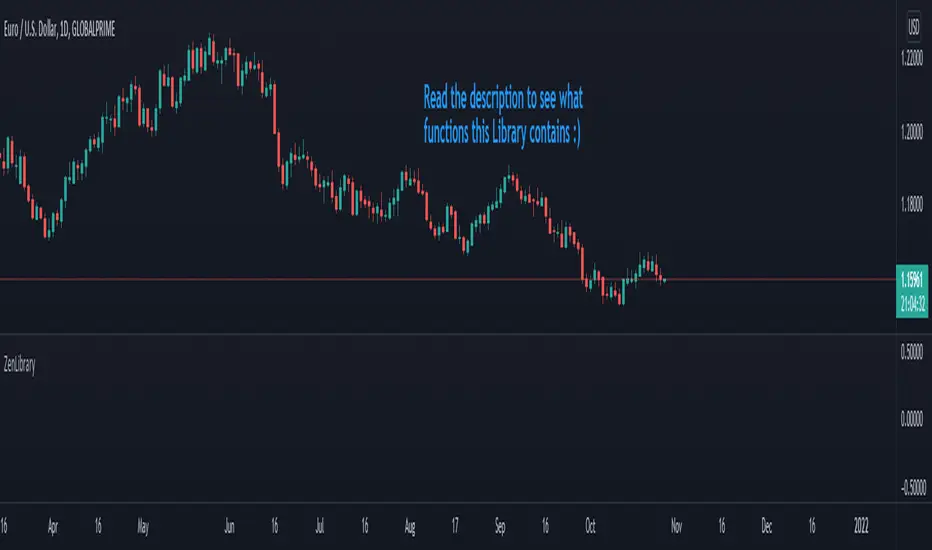
ZenLibraryLibrary "ZenLibrary"
A collection of custom tools & utility functions commonly used with my scripts.
getDecimals() Calculates how many decimals are on the quote price of the current market
Returns: The current decimal places on the market quote price
truncate(float, float) Truncates (cuts) excess decimal places
Parameters:
float : _number The number to truncate
float : _decimalPlaces (default=2) The number of decimal places to truncate to
Returns: The given _number truncated to the given _decimalPlaces
toWhole(float) Converts pips into whole numbers
Parameters:
float : _number The pip number to convert into a whole number
Returns: The converted number
toPips(float) Converts whole numbers back into pips
Parameters:
float : _number The whole number to convert into pips
Returns: The converted number
av_getPositionSize(float, float, float, float) Calculates OANDA forex position size for AutoView based on the given parameters
Parameters:
float : _balance The account balance to use
float : _risk The risk percentage amount (as a whole number - eg. 1 = 1% risk)
float : _stopPoints The stop loss distance in POINTS (not pips)
float : _conversionRate The conversion rate of our account balance currency
Returns: The calculated position size (in units - only compatible with OANDA)
getMA(int, string) Gets a Moving Average based on type
Parameters:
int : _length The MA period
string : _maType The type of MA
Returns: A moving average with the given parameters
getEAP(float) Performs EAP stop loss size calculation (eg. ATR >= 20.0 and ATR < 30, returns 20)
Parameters:
float : _atr The given ATR to base the EAP SL calculation on
Returns: The EAP SL converted ATR size
barsAboveMA(int, float) Counts how many candles are above the MA
Parameters:
int : _lookback The lookback period to look back over
float : _ma The moving average to check
Returns: The bar count of how many recent bars are above the MA
barsBelowMA(int, float) Counts how many candles are below the MA
Parameters:
int : _lookback The lookback period to look back over
float : _ma The moving average to reference
Returns: The bar count of how many recent bars are below the EMA
barsCrossedMA(int, float) Counts how many times the EMA was crossed recently
Parameters:
int : _lookback The lookback period to look back over
float : _ma The moving average to reference
Returns: The bar count of how many times price recently crossed the EMA
getPullbackBarCount(int, int) Counts how many green & red bars have printed recently (ie. pullback count)
Parameters:
int : _lookback The lookback period to look back over
int : _direction The color of the bar to count (1 = Green, -1 = Red)
Returns: The bar count of how many candles have retraced over the given lookback & direction
getBodySize() Gets the current candle's body size (in POINTS, divide by 10 to get pips)
Returns: The current candle's body size in POINTS
getTopWickSize() Gets the current candle's top wick size (in POINTS, divide by 10 to get pips)
Returns: The current candle's top wick size in POINTS
getBottomWickSize() Gets the current candle's bottom wick size (in POINTS, divide by 10 to get pips)
Returns: The current candle's bottom wick size in POINTS
getBodyPercent() Gets the current candle's body size as a percentage of its entire size including its wicks
Returns: The current candle's body size percentage
isHammer(float, bool) Checks if the current bar is a hammer candle based on the given parameters
Parameters:
float : _fib (default=0.382) The fib to base candle body on
bool : _colorMatch (default=false) Does the candle need to be green? (true/false)
Returns: A boolean - true if the current bar matches the requirements of a hammer candle
isStar(float, bool) Checks if the current bar is a shooting star candle based on the given parameters
Parameters:
float : _fib (default=0.382) The fib to base candle body on
bool : _colorMatch (default=false) Does the candle need to be red? (true/false)
Returns: A boolean - true if the current bar matches the requirements of a shooting star candle
isDoji(float, bool) Checks if the current bar is a doji candle based on the given parameters
Parameters:
float : _wickSize (default=2) The maximum top wick size compared to the bottom (and vice versa)
bool : _bodySize (default=0.05) The maximum body size as a percentage compared to the entire candle size
Returns: A boolean - true if the current bar matches the requirements of a doji candle
isBullishEC(float, float, bool) Checks if the current bar is a bullish engulfing candle
Parameters:
float : _allowance (default=0) How many POINTS to allow the open to be off by (useful for markets with micro gaps)
float : _rejectionWickSize (default=disabled) The maximum rejection wick size compared to the body as a percentage
bool : _engulfWick (default=false) Does the engulfing candle require the wick to be engulfed as well?
Returns: A boolean - true if the current bar matches the requirements of a bullish engulfing candle
isBearishEC(float, float, bool) Checks if the current bar is a bearish engulfing candle
Parameters:
float : _allowance (default=0) How many POINTS to allow the open to be off by (useful for markets with micro gaps)
float : _rejectionWickSize (default=disabled) The maximum rejection wick size compared to the body as a percentage
bool : _engulfWick (default=false) Does the engulfing candle require the wick to be engulfed as well?
Returns: A boolean - true if the current bar matches the requirements of a bearish engulfing candle
timeFilter(string, bool) Determines if the current price bar falls inside the specified session
Parameters:
string : _sess The session to check
bool : _useFilter (default=false) Whether or not to actually use this filter
Returns: A boolean - true if the current bar falls within the given time session
dateFilter(int, int) Determines if this bar's time falls within date filter range
Parameters:
int : _startTime The UNIX date timestamp to begin searching from
int : _endTime the UNIX date timestamp to stop searching from
Returns: A boolean - true if the current bar falls within the given dates
dayFilter(bool, bool, bool, bool, bool, bool, bool) Checks if the current bar's day is in the list of given days to analyze
Parameters:
bool : _monday Should the script analyze this day? (true/false)
bool : _tuesday Should the script analyze this day? (true/false)
bool : _wednesday Should the script analyze this day? (true/false)
bool : _thursday Should the script analyze this day? (true/false)
bool : _friday Should the script analyze this day? (true/false)
bool : _saturday Should the script analyze this day? (true/false)
bool : _sunday Should the script analyze this day? (true/false)
Returns: A boolean - true if the current bar's day is one of the given days
atrFilter(float, float) Checks the current bar's size against the given ATR and max size
Parameters:
float : _atr (default=ATR 14 period) The given ATR to check
float : _maxSize The maximum ATR multiplier of the current candle
Returns: A boolean - true if the current bar's size is less than or equal to _atr x _maxSize
fillCell(table, int, int, string, string, color, color) This updates the given table's cell with the given values
Parameters:
table : _table The table ID to update
int : _column The column to update
int : _row The row to update
string : _title The title of this cell
string : _value The value of this cell
color : _bgcolor The background color of this cell
color : _txtcolor The text color of this cell
Returns: A boolean - true if the current bar falls within the given dates
Run TimerThis is a simple utility which counts the number of bars and time elapsed after starting the script. This can be used in time or bars based conditions to modify script behavior.
This particular script does the following:
Starts timer when script is added to chart
Timer is green when starting and continues to be in green if the right Auth key is used in input (Which is hardcoded as 1234 here)
If right auth key is not provided in the input, timer background turns red after trial bars.
Script can be modified to use elapsed time instead.
Thanks to @Bjorgum on assisting on few calculations :)


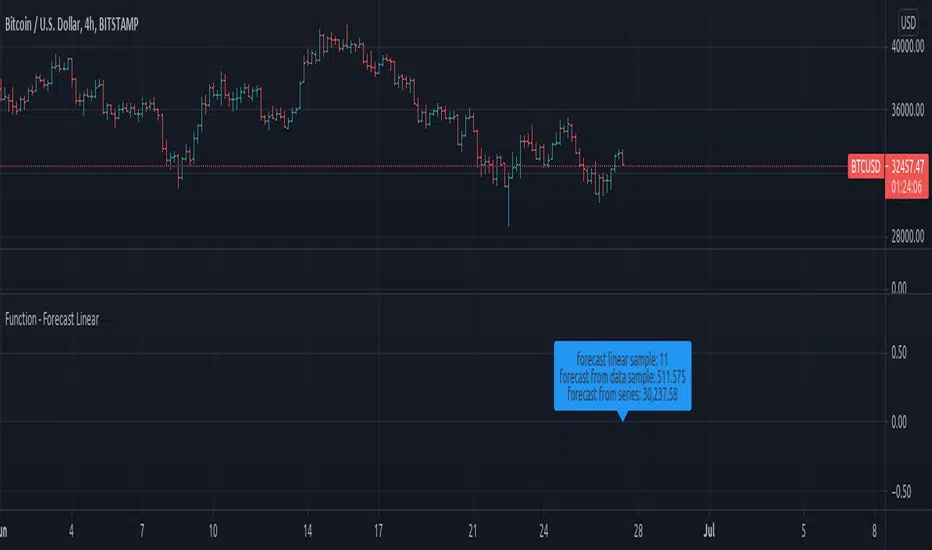
Function - Forecast LinearFunction to calculate a forecast using a linear regression approach, this is the same function used on excel and other data sheet programs.
reference:
- support.microsoft.com
- stackoverflow.com
Function - Sequence From SeriesFunction to create a array from a sample taken from a series (ex:. close, hlc3...).

[UTILS] Session Input ParserAn utility function to parse session inputs. Extracts hours, minutes and weekdays (if defined) and returns a tuple as the result.
_parseSession(sessionString) => (hourStart, minuteStart, hourEnd, minuteEnd, weekdaysArray)
Examples presented on the chart.


Filter Information Box - PineCoders FAQWhen designing filters it can be interesting to have information about their characteristics, which can be obtained from the set of filter coefficients (weights). The following script analyzes the impulse response of a filter in order to return the following information:
Lag
Smoothness via the Herfindahl index
Percentage Overshoot
Percentage Of Positive Weights
The script also attempts to determine the type of the analyzed filter, and will issue warnings when the filter shows signs of unwanted behavior.
DISPLAYED INFORMATION AND METHODS
The script displays one box on the chart containing two sections. The filter metrics section displays the following information:
- Lag : Measured in bars and calculated from the convolution between the filter's impulse response and a linearly increasing sequence of value 0,1,2,3... . This sequence resets when the impulse response crosses under/over 0.
- Herfindahl index : A measure of the filter's smoothness described by Valeriy Zakamulin. The Herfindahl index measures the concentration of the filter weights by summing the squared filter weights, with lower values suggesting a smoother filter. With normalized weights the minimum value of the Herfindahl index for low-pass filters is 1/N where N is the filter length.
- Percentage Overshoot : Defined as the maximum value of the filter step response, minus 1 multiplied by 100. Larger values suggest higher overshoots.
- Percentage Positive Weights : Percentage of filter weights greater than 0.
Each of these calculations is based on the filter's impulse response, with the impulse position controlled by the Impulse Position setting (its default is 1000). Make sure the number of inputs the filter uses is smaller than Impulse Position and that the number of bars on the chart is also greater than Impulse Position . In order for these metrics to be as accurate as possible, make sure the filter weights add up to 1 for low-pass and band-stop filters, and 0 for high-pass and band-pass filters.
The comments section displays information related to the type of filter analyzed. The detection algorithm is based on the metrics described above. The script can detect the following type of filters:
All-Pass
Low-Pass
High-Pass
Band-Pass
Band-Stop
It is assumed that the user is analyzing one of these types of filters. The comments box also displays various warnings. For example, a warning will be displayed when a low-pass/band-stop filter has a non-unity pass-band, and another is displayed if the filter overshoot is considered too important.
HOW TO SET THE SCRIPT UP
In order to use this script, the user must first enter the filter settings in the section provided for this purpose in the top section of the script. The filter to be analyzed must then be entered into the:
f(input)
function, where `input` is the filter's input source. By default, this function is a simple moving average of period length . Be sure to remove it.
If, for example, we wanted to analyze a Blackman filter, we would enter the following:
f(input)=>
pi = 3.14159,sum = 0.,sumw = 0.
for i = 0 to length-1
k = i/length
w = 0.42 - 0.5 * cos(2 * pi * k) + 0.08 * cos(4 * pi * k)
sumw := sumw + w
sum := sum + w*input
sum/sumw
EXAMPLES
In this section we will look at the information given by the script using various filters. The first filter we will showcase is the linearly weighted moving average (WMA) of period 9.
As we can see, its lag is 2.6667, which is indeed correct as the closed form of the lag of the WMA is equal to (period-1)/3 , which for period 9 gives (9-1)/3 which is approximately equal to 2.6667. The WMA does not have overshoots, this is shown by the the percentage overshoot value being equal to 0%. Finally, the percentage of positive weights is 100%, as the WMA does not possess negative weights.
Lets now analyze the Hull moving average of period 9. This moving average aims to provide a low-lag response.
Here we can see how the lag is way lower than that of the WMA. We can also see that the Herfindahl index is higher which indicates the WMA is smoother than the HMA. In order to reduce lag the HMA use negative weights, here 55% (as there are 45% of positive ones). The use of negative weights creates overshoots, we can see with the percentage overshoot being 26.6667%.
The WMA and HMA are both low-pass filters. In both cases the script correctly detected this information. Let's now analyze a simple high-pass filter, calculated as follows:
input - sma(input,length)
Most weights of a high-pass filters are negative, which is why the lag value is negative. This would suggest the indicator is able to predict future input values, which of course is not possible. In the case of high-pass filters, the Herfindahl index is greater than 0.5 and converges toward 1, with higher values of length . The comment box correctly detected the type of filter we were using.
Let's now test the script using the simple center of gravity bandpass filter calculated as follows:
wma(input,length) - sma(input,length)
The script correctly detected the type of filter we are using. Another type of filter that the script can detect is band-stop filters. A simple band-stop filter can be made as follows:
input - (wma(input,length) - sma(input,length))
The script correctly detect the type of filter. Like high-pass filters the Herfindahl index is greater than 0.5 and converges toward 1, with greater values of length . Finally the script can detect all-pass filters, which are filters that do not change the frequency content of the input.
WARNING COMMENTS
The script can give warning when certain filter characteristics are detected. One of them is non-unity pass-band for low-pass filters. This warning comment is displayed when the weights of the filter do not add up to 1. As an example, let's use the following function as a filter:
sum(input,length)
Here the filter pass-band has non unity, and the sum of the weights is equal to length . Therefore the script would display the following comments:
We can also see how the metrics go wild (note that no filter type is detected, as the detected filter could be of the wrong type). The comment mentioning the detection of high overshoot appears when the percentage overshoot is greater than 50%. For example if we use the following filter:
5*wma(input,length) - 4*sma(input,length)
The script would display the following comment:
We can indeed see high overshoots from the filter:
@alexgrover for PineCoders
Look first. Then leap.

Bands-Trailing Stop UtilityIntroduction
Bands and trailing stops are important indicators in technical analysis, while we could think that both are different they can be in fact closely related, at least in the way they are made. Bands and trailing stops can be made from a simple central tendency estimator, like a moving average, and from a volatility estimator like standard deviation, atr...etc.
This is why i propose this utility that allow you to make bands and trailing stops from any indicator in the price chart.
How To Use
All you have to do is select the indicator you want to make bands from in the settings, so just open the Bands-Trailing Stop Utility indicator settings and select your indicator in "Source". Make sure your source indicator is not in "hide" mode.
For example here i'am using a moving average as source for the indicator. Mult control how spread the bands are from each others, by default mult = 1, if we use mult = 2 we get :
Mult can be non-integer as well as lower than 1 (when lower than 1 the bands would be closer to each others)
Error/Volatility Estimators
You can choose from a wide variety of volatility estimators, select the estimator from the "Method" scrolling parameter in settings, by default the indicator will use the running mean absolute error (MAE) which don't use length. Other estimators use length, making length = to the period of the source indicator can help get better results.
The root moving averaged squared error (RMASE) is just the square root of the simple moving average of the squared difference between the closing price and the source indicator. length control the period of the moving average of RMASE.
You can also use the average true range with period length. It might work better with low lagging moving averages.
The range is simply the difference between the highest and lowest over length periods of the source indicator.
Stdev is simply the price running standard deviation.
Trailing Stop
When the trailing stop mode is checked the bands will be replaced by a trailing stop, the trailing stop will still depend on every settings of the indicator like mult/volatility estimator...etc.
Conclusion
You might find an use to this tool if you want to make bands/trailing stops from pretty much everything. The indicator used as source for the examples is a smooth exponential averager that i could share if i see interest from peoples.
Thanks for reading !

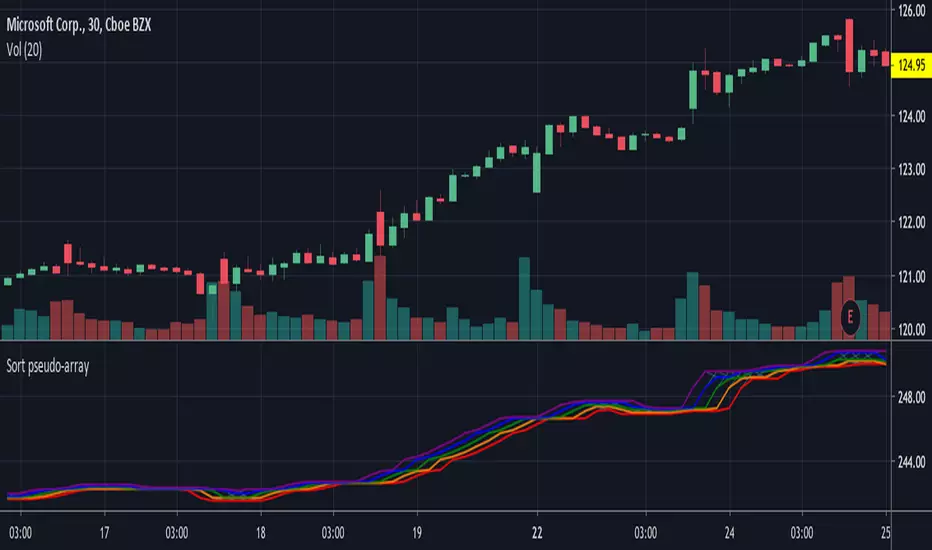
Sort pseudo-array v3Based on Sort pseudo-array v2 by apozdnyakov
- fixed issue where if the same number is repeated in the list it gets skipped
- replaced hardcoded 10000 and -10000 values with na in case those values are in the list
- added sort_all to demonstrate how to sort a list if the length is fixed
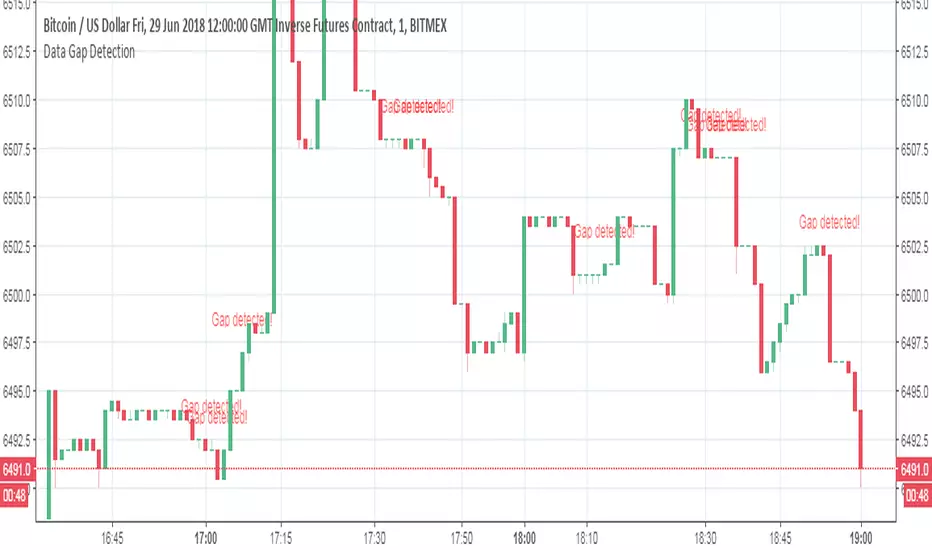
Data Gap DetectionThis simple script checks for data gaps in an intra-day TradingView chart. I have found that BitMEX 1-minute data is coming in rather holey lately, so I wrote this just to see how prevalent the problem is. It should work on any intra-day timeframe, not just 1-minute.
V1: initial release.