Uptrick: Price Memory TrendIntroduction
Uptrick: Price Memory Trend is a custom indicator designed to detect directional shifts and volatility changes using a non-traditional price memory approach. Unlike moving average systems, it builds a dynamic memory of price that adapts gradually over time, allowing it to detect significant deviations and trend transitions with reduced noise.
Overview
This script identifies trend changes by comparing the current price to a memory-based baseline. When price deviates significantly from this memory base, it triggers a trend regime shift—either bullish or bearish. Adaptive deviation bands are calculated using absolute deviation from the memory base, not ATR or standard deviation, which allows the indicator to capture volatility uniquely. Visual components include color-coded candles, labeled signals, optional bands, and a live status table summarizing current trend metrics.
Originality
The indicator’s core innovation lies in its use of a decaying memory function to track trend direction, replacing moving averages with a price memory that responds only to significant deviations. This method avoids lag typically associated with smoothing techniques, enabling timely trend detection. Furthermore, deviation is measured directly in price terms, rather than through volatility surrogates like ATR or Bollinger Bands, resulting in a more raw and responsive depiction of price behavior.
Inputs
Core Engine
Memory Strength: Sets how strongly the memory responds to price changes. Higher values make the memory base more reactive.
Memory Decay: Controls how much past memory is retained. Lower values weight new prices more heavily.
Deviation Length: Length of the EMA used to smooth absolute price deviation. A longer setting results in smoother bands.
Band Multiplier: Expands or contracts the dynamic bands. Higher values widen the bands, reducing sensitivity.
Customization
Color Palette: Selects one of six predefined color schemes for bull and bear visuals.
Show Bands: Enables or disables the display of deviation bands.
Look: Chooses between 'Bands', 'Trail', or 'Intense' styles, affecting how bands and fills are drawn.
Bands
Trail
Intense
Show Info Table: Toggles display of the real-time trend and volatility status panel.
Table Position: Determines which corner of the chart the info panel appears in.
Text Size: Adjusts font size used within the info table.
Features
Trend Detection
Bullish Shift: Triggered when price crosses above the upper band, entering a new bullish regime.
Bearish Shift: Triggered when price crosses below the lower band, entering a new bearish regime.
Trend state is persistent and updated only on confirmed transitions, avoiding repeated entries in the same direction.
Candle Coloring
Candles are dynamically recolored based on current trend direction: bull, bear, or neutral.
Signal Labels
Visual labels marked "Up" or "Down" are placed on the chart when a regime shift occurs, helping to mark turning points.
Deviation Bands
Dynamic upper and lower bands are drawn based on smoothed absolute deviation from the memory base.
Additional outer bands based on ATR may be drawn to highlight zone intensity when the 'Intense' or 'Trail' styles are selected.
Bands visually indicate overextension and help frame price context relative to memory.
Alerts
Built-in alert conditions trigger on bullish or bearish trend shifts, useful for automation or notifications.
Info Table
The optional info table displays:
Current trend direction
Band state (calm, hot, or cool)
Price stretch from base
Trend age in bars
Confidence level based on deviation
Memory slope and acceleration
Band width and compression state
Reversion risk based on stretch level
Info Table:
Trade Example:
Logic
Price Memory
A recursive formula updates a memory variable based on the current price.
The memory adjusts only when the price deviates meaningfully from its previous value.
The formula uses a combination of delta-weighting and exponential decay:
> memory := previous_memory + delta × memory_strength
> memory := memory × memory_decay + price × (1 - memory_decay)
This produces a smooth, adaptive base that responds gradually to directional price moves.
Deviation and Bands
Absolute deviation between price and the memory base is calculated and smoothed using an EMA.
The upper and lower bands are then calculated as:
> Upper Band = memory base + (smoothed deviation × band multiplier)
> Lower Band = memory base - (smoothed deviation × band multiplier)
ATR-based extensions can optionally be drawn around these bands for added visual structure.
Trend Logic
Bullish and bearish states are tracked using crossovers and crossunders of price against the upper and lower bands.
The indicator maintains a persistent trend state variable that updates only when a confirmed regime change occurs.
This prevents multiple signals within the same trend direction (non-pyramiding behavior).
Stretch and Band Analysis
Stretch is measured as the deviation of price from memory, normalized by smoothed deviation.
Band width is tracked over time and used to detect compression or expansion.
Band position is calculated to identify where price sits between the upper and lower bands.
Info Table Metrics
Memory Slope and Acceleration: Show first and second derivative of the memory base to capture trend speed and change.
Confidence Level: Based on stretch intensity, indicating trend strength.
Reversion Risk: Inferred from how extended price is beyond the band.
Compression: Evaluated by comparing current band width to its recent average.
Summary
Uptrick: Price Memory Trend provides an alternative framework for trend identification by replacing traditional smoothing with adaptive memory logic. It measures price deviation without reliance on ATR or standard deviation, instead focusing on distance from a reactive baseline. With regime-based trend tracking, customizable visuals, and a detailed status table, it supports both discretionary and system-driven trading styles.
Disclaimer
This script is for informational and educational purposes only. It does not provide financial advice or guarantees. Trading involves risk, and past performance is not indicative of future results. Always perform your own research before making trading decisions.
Uptrick

Uptrick: Dynamic Z-Score DivergenceIntroduction
Uptrick: Dynamic Z-Score Divergence is an oscillator that combines multiple momentum sources within a Z-Score framework, allowing for the detection of statistically significant mean-reversion setups, directional shifts, and divergence signals. It integrates a multi-source normalized oscillator, a slope-based signal engine, structured divergence logic, a slope-adaptive EMA with dynamic bands, and a modular bar coloring system. This script is designed to help traders identify statistically stretched conditions, evolving trend dynamics, and classical divergence behavior using a unified statistical approach.
Overview
At its core, this script calculates the Z-Score of three momentum sources—RSI, Stochastic RSI, and MACD—using a user-defined lookback period. These are averaged and smoothed to form the main oscillator line. This normalized oscillator reflects how far short-term momentum deviates from its mean, highlighting statistically extreme areas.
Signals are triggered when the oscillator reverses slope within defined inner zones, indicating a shift in direction while the signal remains in a statistically stretched state. These mean-reversion flips (referred to as TP signals) help identify turning points when price momentum begins to revert from extended zones.
In addition, the script includes a divergence detection engine that compares oscillator pivot points with price pivot points. It confirms regular bullish and bearish divergence by validating spacing between pivots and visualizes both the oscillator-side and chart-side divergences clearly.
A dynamic trend overlay system is included using a Slope Adaptive EMA (SA-EMA). This trend line becomes more responsive when Z-Score deviation increases, allowing the trend line to adapt to market conditions. It is paired with ATR-based bands that are slope-sensitive and selectively visible—offering context for dynamic support and resistance.
The script includes configurable bar coloring logic, allowing users to color candles based on oscillator slope, last confirmed divergence, or the most recent signal of any type. A full alert system is also built-in for key signals.
Originality
The script is based on the well-known concept of Z-Score valuation, which is a standard statistical method for identifying how far a signal deviates from its mean. This foundation—normalizing momentum values such as RSI or MACD to measure relative strength or weakness—is not unique to this script and is widely used in quantitative analysis.
What makes this implementation original is how it expands the Z-Score foundation into a fully featured, signal-producing system. First, it introduces a multi-source composite oscillator by combining three momentum inputs—RSI, Stochastic RSI, and MACD—into a unified Z-Score stream. Second, it builds on that stream with a directional slope logic that identifies turning points inside statistical zones.
The most distinctive additions are the layered features placed on top of this normalized oscillator:
A structured divergence detection engine that compares oscillator pivots with price pivots to validate regular bullish and bearish divergence using precise spacing and timing filters.
A fully integrated slope-adaptive EMA overlay, where the smoothing dynamically adjusts based on real-time Z-Score movement of RSI, allowing the trend line to become more reactive during high-momentum environments and slower during consolidation.
ATR-based dynamic bands that adapt to slope direction and offer real-time visual zones for support and resistance within trend structures.
These features are not typically found in standard Z-Score indicators and collectively provide a unique approach that bridges statistical normalization, structure detection, and adaptive trend modeling within one script.
Features
Z-Score-based oscillator combining RSI, StochRSI, and MACD
Configurable smoothing for stable composite signal output
Buy/Sell TP signals based on slope flips in defined zones
Background highlighting for extreme outer bands
Inner and outer zones with fill logic for statistical context
Pivot-based divergence detection (regular bullish/bearish)
Divergence markers on oscillator and price chart
Slope-Adaptive EMA (SA-EMA) with real-time adaptivity based on RSI Z-Score
ATR-based upper and lower bands around the SA-EMA, visibility tied to slope direction
Configurable bar coloring (oscillator slope, divergence, or most recent signal)
Alerts for TP signals and confirmed divergences
Optional fixed Y-axis scaling for consistent oscillator view
The full setup mode can be seen below:
Input Parameters
General Settings
Full Setup: Enables rendering of the full visual system (lines, bands, signals)
Z-Score Lookback: Lookback period for normalization (mean and standard deviation)
Main Line Smoothing: EMA length applied to the averaged Z-Score
Slope Detection Index: Used to calculate directional flips for signal logic
Enable Background Highlighting: Enables visual region coloring in
overbought/oversold areas
Force Visible Y-Axis Scale: Forces max/min bounds for a consistent oscillator range
Divergence Settings
Enable Divergence Detection: Toggles divergence logic
Pivot Lookback Left / Right: Defines the structure of oscillator pivot points
Minimum / Maximum Bars Between Pivots: Controls the allowed spacing range for divergence validation
Bar Coloring Settings
Bar Coloring Mode:
➜ Line Color: Colors bars based on oscillator slope
➜ Latest Confirmed Signal: Colors bars based on the most recent confirmed divergence
➜ Any Latest Signal: Colors based on the most recent signal (TP or divergence)
SA-EMA Settings
RSI Length: RSI period used to determine adaptivity
Z-Score Length: Lookback for normalizing RSI in adaptive logic
Base EMA Length: Base length for smoothing before adaptivity
Adaptivity Intensity: Scales the smoothing responsiveness based on RSI deviation
Slope Index: Determines slope direction for coloring and band logic
Band ATR Length / Band Multiplier: Controls the width and responsiveness of the trend-following bands
Alerts
The script includes the following alert conditions:
Buy Signal (TP reversal detected in oversold zone)
Sell Signal (TP reversal detected in overbought zone)
Confirmed Bullish Divergence (oscillator HL, price LL)
Confirmed Bearish Divergence (oscillator LH, price HH)
These alerts allow integration into automation systems or signal monitoring setups.
Summary
Uptrick: Dynamic Z-Score Divergence is a statistically grounded trading indicator that merges normalized multi-momentum analysis with real-time slope logic, divergence detection, and adaptive trend overlays. It helps traders identify mean-reversion conditions, divergence structures, and evolving trend zones using a modular system of statistical and structural tools. Its alert system, layered visuals, and flexible input design make it suitable for discretionary traders seeking to combine quantitative momentum logic with structural pattern recognition.
Disclaimer
This script is for educational and informational purposes only. No indicator can guarantee future performance, and trading involves risk. Always use risk management and test strategies in a simulated environment before deploying with live capital.

Uptrick: Volume Weighted BandsIntroduction
This indicator, Uptrick: Volume Weighted Bands, overlays dynamic, volume-informed trend channels directly on the chart. By fusing price and volume data through volume-weighted and exponential moving averages, the script forms a core trend line with adaptive bandwidth controlled by volatility. It is designed to help traders identify trend direction, breakout entries, and extended conditions that may warrant take-profits or pullback re-entries.
Overview
The Volume Weighted Bands system is built around a trend line calculated by averaging a Volume Weighted Moving Average (VWMA) and an Exponential Moving Average (EMA), both over a configurable lookback period. This hybrid trend baseline is then smoothed further and expanded into dynamic upper and lower bands using an Average True Range (ATR) multiplier. These bands adapt with market volatility and shift color based on prevailing price action, helping traders quickly identify bullish, bearish, or neutral conditions.
Originality and Unique Features
This script introduces originality by blending both price and volume in the core trend calculation, a technique that is more responsive than traditional moving average bands. Its multi-mode visualization (cloud, single-band, or line-only), combined with selective buy/sell signals, makes it flexible for discretionary and algorithmic strategies alike. Optional modules for take-profit signals based on z-score deviation and RSI slope, as well as buy-back detection logic with cooldown filters, offer practical tools for managing trades beyond simple entries.
Explanation of Inputs
Every user input in this script is included to give the trader control over behavior and visual presentation:
Trend Length (len): Defines the lookback window for both the VWMA and EMA, controlling the sensitivity of the core trend baseline. A lower value makes the bands more reactive, while a higher value smooths out short-term noise.
Extra Smoothing (smoothLen): Applies an additional EMA to the blended VWMA/EMA average. This second-level smoothing ensures the central trend line reacts gradually to shifts in price.
Band Width (ATR Multiplier) (bandMult): Multiplies the ATR to create the width of the upper and lower bands around the trend line. Larger values widen the bands, capturing more volatility, while smaller values narrow them.
ATR Length (atrLen): Sets the length of the ATR used in calculating band width and signal offsets. Longer values produce smoother band boundaries.
Show Buy/Sell Signals (showSignals): Toggles the primary crossover/crossunder entry signals, which are labeled when the close crosses the upper or lower band.
Visual Mode (visualMode): Allows selection between three display modes:
--> Cloud: Shows both bands and the central trend line with a shaded background.
--> Single Band: Displays only the active (upper or lower) band depending on trend state, with gradient fill to price.
--> Line Only: Shows only the trend line for a minimal visual profile.
Take Profit Signals (enableTP): Enables a z-score-based profit-taking signal system. Signals occur when price deviates significantly from the trend line and RSI confirms exhaustion.
TP Z-Score Threshold (tpThreshold): Sets the z-score deviation required to trigger a take-profit signal. Higher values reduce the frequency of signals, focusing on more extreme moves.
Re-Entries (enableBuyBack): Enables logic to signal when price reverts into the band after an initial breakout, suggesting a possible re-entry or pullback setup.
Buy Back Cooldown (bars) (buyBackCooldown): Defines a minimum bar count before a new buy-back signal is allowed, preventing rapid retriggering in choppy conditions.
Buy Offset and Sell Offset: Hidden inputs used to vertically adjust the placement of the Buy ("𝓤𝓹") and Sell ("𝓓𝓸𝔀𝓷") labels relative to the bands. These use ATR units to maintain proportionality across different instruments and timeframes.
Take-Profit Signal Module
The take-profit module uses a z-score of the distance between price and the trend line to detect extended conditions. In bullish trends, a signal appears when price is well above the band and RSI indicates exhaustion; the opposite applies for bearish conditions. A boolean flag is used to prevent retriggering until RSI resets. These signals are plotted with minimalist “X” markers near recent highs or lows, based on whether the market is extended upward or downward.
Re-Entry Logic
The re-entry system identifies instances where price momentarily dips or spikes into the opposite band but closes back inside, implying a continuation of the prevailing trend. This module can be particularly useful for traders managing entries after brief pullbacks. A built-in cooldown period helps filter out noise and prevents signal overloading during fast markets. Visual markers are shown as upward or downward arrows near the relevant candle wicks.
How to Use This Indicator
The basic usage of this indicator follows a directional, signal-driven approach. When a buy signal appears, it suggests entering a long position. The recommended stop loss placement is below the lower band, allowing for some breathing space to accommodate natural volatility. As the position progresses, take partial profits—typically 10% to 15% of the position—each time a take-profit signal (marked with an "X") is shown on the chart.
An optional feature is the buy-back signal, which can be used to re-enter after partial exits or missed entries. Utilizing this can help reduce losses during false breakouts or trend reversals by scaling in more gradually. However, it also means that in strong, clean trends, the full position may not be captured from the start, potentially reducing the total return. It is up to the trader to decide whether to enter fully on the initial signal or incrementally using buy-backs.
When a sell signal appears, the strategy advises fully exiting any long positions and immediately switching to a short position. The short trade follows the same logic: place your stop loss above the upper band with some margin, and again, take partial profits at each take-profit signal.
Visual Presentation and Signal Labels
All signals are plotted with clean, minimal labels that avoid clutter, and are color-coded using a custom palette designed to remain clear across light and dark chart themes. Bullish trends are marked in teal and bearish trends in magenta. Candles and wicks are also colored accordingly to align price action with the detected trend state. Buy and sell entries are marked with "𝓤𝓹" and "𝓓𝓸𝔀𝓷" labels.
Summary
In summary, the Uptrick: Volume Weighted Bands indicator provides a versatile, visually adaptive trend and volatility tool that can serve multiple styles of trading. Through its integration of price, volume, and volatility, along with modular take-profit and buy-back signaling, it aims to provide actionable structure across a range of market conditions.
Disclaimer
This indicator is for educational purposes only. Trading involves risk, and past performance does not guarantee future results. Always test strategies before applying them in live markets.

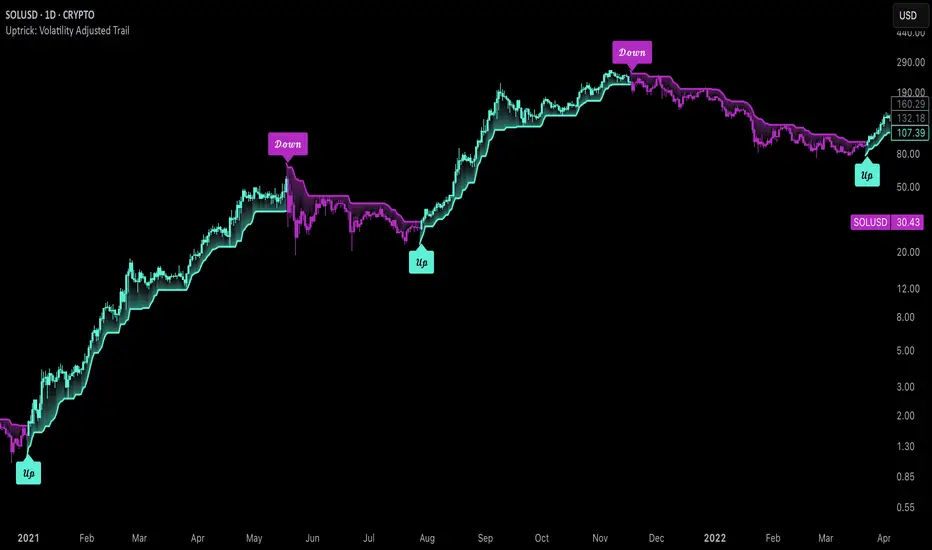
Uptrick: Volatility Adjusted TrailIntroduction
The "Uptrick: Volatility Adjusted Trail" is a dynamic trailing band indicator. It adapts in real time to changing market conditions by adjusting both to volatility and trend consistency. Inspired by Supertrend-style logic, it enhances traditional approaches by introducing adaptive mechanisms for more context-sensitive behavior in both trending and consolidating environments.
Overview
This indicator combines an exponential moving average (EMA) as its basis with an Average True Range (ATR)-derived multiplier that adjusts dynamically. Unlike fixed-multiplier tools, this indicator modifies its band distances in real time according to volatility expansion and trend persistence. The result is a trailing system that adapts to the prevailing market regime, providing traders with clearer signals for trend bias, stop placement, and potential momentum shifts.
Originality
The script’s originality lies in its multi-layered approach to trail calculation. It introduces a real-time ATR multiplier adjustment driven by two factors: a volatility expansion ratio and a trend persistence model. The expansion ratio compares the current ATR to its moving average, making the indicator more sensitive during volatile conditions and less sensitive during quieter periods. The trend persistence model assesses directional consistency to widen the bands during sustained trends. This dual adjustment method creates a system that evolves with market behavior, making it more responsive and adaptive than static-band or fixed-multiplier alternatives.
Components & Inspiration
This indicator was designed with specific components that work together:
Exponential Moving Average (EMA): Chosen as the central baseline because it responds faster to recent price changes than a simple moving average, providing a more current reference for trailing bands.
Average True Range (ATR): Used as the volatility measure because it accounts for both intraday and gap movement, making it a robust and widely accepted standard for market volatility.
Dynamic Multiplier: The multiplier is adjusted by both volatility expansion and trend persistence to produce bands that tighten during low volatility and widen during consistent trends. This combination was chosen to give the indicator the ability to self-regulate across different market regimes.
Trend Persistence Model: Integrated to assess directional consistency, ensuring the bands expand during strong trends, which can prevent premature stop-outs.
Flip Confirmation Logic: Added to filter out noise by requiring multiple bar closes beyond a band before confirming a state change, reducing false reversals.
For inspiration, the indicator draws on the core idea behind Supertrend—using a baseline and volatility-derived bands to define trailing stop levels. However, while Supertrend uses a fixed ATR multiplier, this indicator introduces a dynamic multiplier system and persistence weighting, making it more adaptive and suited for varying conditions.
Inputs and Parameters
Basis EMA Length
Defines the period for the EMA that serves as the core price reference.
ATR Length
Sets the lookback period for the Average True Range calculation used in band spacing.
Base ATR Mult
The base multiplier applied to ATR before adjustments. Forms the starting scale of the band offset.
Volatility Expansion Sensitivity
Controls how strongly the band spacing reacts to short-term volatility bursts. Higher values create more pronounced band expansions or contractions.
Trend Persistence Window
Determines how many bars are used to calculate directional trend consistency using a smoothed step function.
Persistence Impact
Scales how much influence the trend persistence has on band widening. Values range from 0 (no effect) to 1 (maximum effect).
Min Effective Mult
Sets the minimum value that the adjusted multiplier can reach. Prevents the bands from becoming too narrow.
Max Effective Mult
Sets the maximum value the adjusted multiplier can reach. Prevents the bands from over-expanding during high volatility.
Bars Above/Below to Confirm Flip
Number of consecutive bars required to close above or below the opposing trail before confirming a bullish or bearish flip. Helps reduce noise and false signals.
Show Flip Labels
Enables or disables the display of flip markers on the chart.
Label Size
Allows users to adjust the size of flip labels from Tiny to Huge.
Label ATR Offset
Adjusts the vertical placement of flip labels in relation to the trail using an ATR-based offset.
Features and Logic
EMA Basis: All calculations stem from an EMA that tracks the centerline of price action.
Dynamic ATR Multiplier: The ATR multiplier adjusts in real time based on volatility expansion and trend persistence.
Clamped Multiplier: The adjusted multiplier is limited between user-defined minimum and maximum values to keep the band scale practical.
Upper and Lower Bands: Bands are plotted above and below the EMA using the dynamic multiplier and ATR values.
Trailing Logic: The script uses Supertrend-style trailing logic, updating the active band in the current trend direction and resetting the opposite band.
Trend State Detection: A state variable tracks the current market regime (bullish, bearish, or neutral). Transitions are confirmed only after a user-specified number of bars close beyond the respective bands.
Visual Elements: Trail lines and fill zones are color-coded (bullish cyan, bearish magenta). Candlestick and bar colors match the trend state. Optional flip labels mark confirmed transitions.
Alerts: Built-in alert conditions allow users to receive real-time notifications for bullish or bearish flips.
Usage Guidelines
This indicator can be used for:
Defining context-aware dynamic stop levels that adjust with market behavior.
Identifying trend direction and reversal points based on adaptive logic.
Filtering entry or exit signals during trending vs. consolidating conditions.
Supplementing trade management strategies with responsive visual markers.
Entering long or short positions based on the appearance of flip labels and managing stop losses by following the adaptive trail.
Traders may tune the parameters to suit different trading styles or timeframes. For example, lower ATR and EMA values may suit intraday setups, while longer settings may benefit swing or positional trading.
Summary
The "Uptrick: Volatility Adjusted Trail" provides a flexible, adaptive trailing band system that accounts for both volatility and directional consistency. By combining an EMA baseline with a dynamic ATR multiplier influenced by volatility expansion and trend persistence, it creates a context-sensitive trailing system that aligns with changing market conditions. Customizable confirmation, flip labels, alerts, and dynamic visual cues make it a versatile tool for trend-following, breakout filtering, and trailing stop logic.
Disclaimer
This indicator is provided for educational and research purposes only. It does not constitute financial advice. Trading involves risk, and past performance does not guarantee future results. Always conduct your own analysis and risk management before making trading decisions.
Uptrick: Volatility Weighted CloudIntroduction
The Volatility Weighted Cloud (VWC) is a trend-tracking overlay that combines adaptive volatility-based bands with a multi-source smoothed price cloud to visualize market bias. It provides users with a dynamic structure that adapts to volatility conditions while maintaining a persistent visual record of trend direction. By incorporating configurable smoothing techniques, percentile-ranked volatility, and multi-line cloud construction, the indicator allows traders to interpret price context more effectively without relying on raw price movement alone.
Overview
The script builds a smoothed price basis using the open, and close prices independently, and uses these to construct a layered visual cloud. This cloud serves both as a reference for price structure and a potential area of dynamic support and resistance. Alongside this cloud, adaptive upper and lower bands are plotted using volatility that scales with percentile rank. When price closes above or below these bands, the script interprets that as a breakout and updates the trend bias accordingly.
Candle coloring is persistent and reflects the most recent confirmed signal. Labels can optionally be placed on the chart when the trend bias flips, giving traders additional visual reference points. The indicator is designed to be both flexible and visually compact, supporting different strategies and timeframes through its detailed configuration options.
Originality
This script introduces originality through its combined use of percentile-ranked volatility, adaptive envelope sizing, and multi-source cloud construction. Unlike static-band indicators, the Volatility Weighted Cloud adjusts its band width based on where current volatility ranks within a defined lookback range. This dynamic scaling allows for smoother signal behavior during low-volatility environments and more responsive behavior during high-volatility phases.
Additionally, instead of using a single basis line, the indicator computes two separate smoothed lines for open and close. These are rendered into a shaded visual cloud that reflects price structure more completely than traditional moving average overlays. The use of ALMA and MAD, both less commonly applied in volatility-band overlays, adds further control over smoothing behavior and volatility measurement, enhancing its adaptability across different market types.
Inputs
Group: Core
Basis Length (short-term): The number of bars used for calculating the primary basis line. Affects how quickly the basis responds to price changes.
Basis Type: Option to choose between EMA and ALMA. EMA provides a standard exponential average; ALMA offers a centered, Gaussian-weighted average with reduced lag.
ALMA Offset: Determines the balance point of the ALMA window. Only applies when ALMA is selected.
Sigma: Sets the width of the ALMA smoothing window, influencing how much smoothing is applied.
Basis Smoothing EMA: Adds additional EMA-based smoothing to the computed basis line for noise reduction.
Group: Volatility & Bands
Volatility: Choose between StDev (standard deviation) and MAD (median absolute deviation) for measuring price volatility.
Vol Length (short-term): Length of the window used for calculating volatility.
Vol Smoothing EMA: Smooths the raw volatility value to stabilize band behavior.
Min Multiplier: Minimum multiplier applied to volatility when forming the adaptive bands.
Max Multiplier: Maximum multiplier applied at high volatility percentile.
Volatility Rank Lookback: Number of bars used to calculate the percentile rank of current volatility.
Show Adaptive Bands: Enables or disables the display of upper and lower volatility bands on the chart.
Group: Trend Switch Labels
Show Trend Switch Labels: Toggles the appearance of labels when the trend direction changes.
Label Anchor: Defines whether the labels are anchored to recent highs/lows or to the main basis line.
ATR Length (offset): Length used for calculating ATR, which determines label offset distance.
ATR Offset (multiplier): Multiplies the ATR value to place labels away from price bars for better visibility.
Label Size: Allows selection of label size (tiny to huge) to suit different chart setups.
Features
Adaptive Volatility Bands: The indicator calculates volatility using either standard deviation or MAD. It then applies an EMA smoothing layer and scales the band width dynamically based on the percentile rank of volatility over a user-defined lookback window. This avoids fixed-width bands and allows the indicator to adapt to changing volatility regimes in real time.
Volatility Method Options: Users can switch between two volatility measurement methods:
➤ Standard Deviation (StDev): Captures overall price dispersion, but may be sensitive to spikes.
➤ Median Absolute Deviation (MAD): A more robust measure that reduces the effect of outliers, making the bands less jumpy during erratic price behavior.
Basis Type Options: The core price basis used for cloud and bands can be built from:
➤ Exponential Moving Average (EMA): Fast-reacting and widely used in trend systems.
➤ Arnaud Legoux Moving Average (ALMA): A smoother, more centered alternative that offers greater control through offset and sigma parameters.
Multi-Line Basis Cloud: The cloud is formed by plotting two individually smoothed basis lines from open and close prices. A filled area is created between the open and close basis lines. This cloud serves as a dynamic support or resistance zone, allowing users to identify possible reversal areas. Price moving through or rejecting from the cloud can be interpreted contextually, especially when combined with band-based signals.
Persistent Trend Bias Coloring: The indicator uses the last confirmed breakout (above upper band or below lower band) to determine bias. This bias is reflected in the color of every subsequent candle, offering a persistent visual cue until a new signal is triggered. It helps simplify trend recognition, especially in choppy or sideways markets.
Trend Switch Labels: When enabled, the script places labeled markers at the exact bar where the bias direction switches. Labels are anchored either to recent highs/lows or to the main basis line, and spaced vertically using an ATR-based offset. This allows the trader to quickly locate historical trend transitions.
Alert Conditions: Two built-in alert conditions are available:
➤ Long Signal: Triggered when the close crosses above the upper adaptive band.
➤ Short Signal: Triggered when the close crosses below the lower adaptive band.
These conditions can be used for custom alerts, automation, or external signaling tools.
Display Control and Flexibility: Users can disable the adaptive bands for a cleaner layout while keeping the basis cloud and candle coloring active. The indicator can be tuned for fast or slow response depending on the strategy in use, and is suitable for intraday, swing, or position trading.
Summary
The Volatility Weighted Cloud is a configurable trend-following overlay that uses adaptive volatility bands and a structured cloud system to help visualize market bias. By combining EMA or ALMA smoothing with percentile-ranked volatility and a four-line price structure, it provides a flexible and informative charting layer. Its key strengths lie in the use of dynamic envelopes, visually persistent trend indication, and clearly defined breakout zones that adapt to current volatility conditions.
Disclaimer
This indicator is for informational and educational purposes only. Trading involves risk and may not be suitable for all investors. Past performance does not guarantee future results.

Uptrick: Universal Z-Score ValuationOverview
The Uptrick: Universal Z-Score Valuation is a tool designed to help traders spot when the market might be overreacting—whether that’s on the upside or the downside. It does this by combining the Z-scores of multiple key indicators into a single average, letting you see how far the current market conditions have stretched away from “normal.” This average is shown as a smooth line, supported by color-coded visuals, signal markers, optional background highlights, and a live breakdown table that shows the contribution of each indicator in real time. The focus here is on spotting potential reversals, not following trends. The indicator works well across all timeframes and asset classes, from fast intraday charts like the 1-minute and 5-minute, to higher timeframes such as the 4-hour, daily, or even weekly. Its universal design makes it suitable for any market — whether you're trading crypto, stocks, forex, or commodities.
Introduction
To understand what this indicator does, let’s start with the idea of a Z-score. In simple terms, a Z-score tells you how far a number is from the average of its recent history, measured in standard deviations. If the price of an asset is two standard deviations above its mean, that means it’s statistically “rare” or extended. That doesn’t guarantee a reversal—but it suggests the move is unusual enough to pay attention.
This concept isn’t new, but what this indicator does differently is apply the Z-score to a wide set of market signals—not just price. It looks at momentum, volatility, volume, risk-adjusted performance, and even institutional price baselines. Each of those indicators is normalized using Z-scores, and then they’re combined into one average. This gives you a single, easy-to-read line that summarizes whether the entire market is behaving abnormally. Instead of reacting to one indicator, you’re reacting to a statistically balanced blend.
Purpose
The goal of this script is to catch turning points—places where the market may be topping out or bottoming after becoming overstretched. It’s built for traders who want to fade sharp moves rather than follow trends. Think of moments when price explodes upward and starts pulling away from every moving average, volume spikes, volatility rises, and RSI shoots up. This tool is meant to spot those situations—not just when price is stretched, but when multiple different indicators agree that something is overdone.
Originality and Uniqueness
Most indicators that use Z-scores only apply them to one thing—price, RSI, or maybe Bollinger Bands. This one is different because it treats each indicator as a contributor to the full picture. You decide which ones to include, and the script averages them out. This makes the tool flexible but also deeply informative.
It doesn’t rely on complex or hidden math. It uses basic Z-score formulas, applies them to well-known indicators, and shows you the result. What makes it unique is the way it brings those signals together—statistically, visually, and interactively—so you can see what’s happening in the moment with full transparency. It’s not trying to be flashy or predictive. It’s just showing you when things have gone too far, too fast.
Inputs and Parameters
This indicator includes a wide range of configurable inputs, allowing users to customize which components are included in the Z-score average, how each indicator is calculated, and how results are displayed visually. Below is a detailed explanation of each input:
General Settings
Z-Score Lookback (default: 100): Number of bars used to calculate the mean and standard deviation for Z-score normalization. Larger values smooth the Z-scores; smaller values make them more reactive.
Bar Color Mode (default: None): Determines how bars are visually colored. Options include: None: No candle coloring applied. - Heat: Smooth gradient based on the Z-score value. - Latest Signal: Applies a solid color based on the most recent buy or sell signal
Boolean - General
Plot Universal Valuation Line (default: true): If enabled, plots the average Z-score (zAvg) line in the separate pane.
Show Signals (default: true): Displays labels ("𝓤𝓹" for buy, "𝓓𝓸𝔀𝓷" for sell) when zAvg crosses above or below user-defined thresholds.
Show Z-Score Table (default: true): Displays a live table listing each enabled indicator's Z-score and the current average.
Select Indicators
These toggles enable or disable each indicator from contributing to the Z-score average:
Use VWAP Z-Score (default: true)
Use Sortino Z-Score (default: true)
Use ROC Z-Score (default: true)
Use Price Z-Score (default: true)
Use MACD Histogram Z-Score (default: false)
Use Bollinger %B Z-Score (default: false)
Use Stochastic K Z-Score (default: false)
Use Volume Z-Score (default: false)
Use ATR Z-Score (default: false)
Use RSI Z-Score (default: false)
Use Omega Z-Score (default: true)
Use Sharpe Z-Score (default: true)
Only enabled indicators are included in the average. This modular design allows traders to tailor the signal mix to their preferences.
Indicator Lengths
These inputs control how each individual indicator is calculated:
MACD Fast Length (default: 12)
MACD Slow Length (default: 26)
MACD Signal Length (default: 9)
Bollinger Basis Length (default: 20): Used to compute the Bollinger %B.
Bollinger Deviation Multiplier (default: 2.0): Standard deviation multiplier for the Bollinger Band calculation.
Stochastic Length (default: 14)
ATR Length (default: 14)
RSI Length (default: 14)
ROC Length (default: 10)
Zones
These thresholds define key signal levels for the Z-score average:
Neutral Line Level (default: 0): Baseline for the average Z-score.
Bullish Zone Level (default: -1): Optional intermediate zone suggesting early bullish conditions.
Bearish Zone Level (default: 1): Optional intermediate zone suggesting early bearish conditions.
Z = +2 Line Level (default: 2): Primary threshold for bearish signals.
Z = +3 Line Level (default: 3): Extreme bearish warning level.
Z = -2 Line Level (default: -2): Primary threshold for bullish signals.
Z = -3 Line Level (default: -3): Extreme bullish warning level.
These zone levels are used to generate signals, fill background shading, and draw horizontal lines for visual reference.
Why These Indicators Were Merged
Each indicator in this script was chosen for a specific reason. They all measure something different but complementary.
The VWAP Z-score helps you see when price has moved far from the volume-weighted average, often used by institutions.
Sortino Ratio Z-score focuses only on downside risk, which is often more relevant to traders than overall volatility.
ROC Z-score shows how fast price is changing—strong momentum may burn out quickly.
Price Z-score is the raw measure of how far current price has moved from its mean.
RSI Z-score shows whether momentum itself is stretched.
MACD Histogram Z-score captures shifts in trend strength and acceleration.
%B (Bollinger) Z-score indicates how close price is to the upper or lower volatility envelope.
Stochastic K Z-score gives a sense of how high or low price is relative to its recent range.
Volume Z-score shows when trading activity is unusually high or low.
ATR Z-score gives a read on volatility, showing if price movement is expanding or contracting.
Sharpe Z-score measures reward-to-risk performance, useful for evaluating trend quality.
Omega Z-score looks at the ratio of good returns to bad ones, offering a more nuanced view of efficiency.
By normalizing each of these using Z-scores and averaging only the ones you turn on, the script creates a flexible, balanced view of the market’s statistical stretch.
Calculations
The core formula is the standard Z-score:
Z = (current value - average) / standard deviation
Every indicator uses this formula after it’s calculated using your chosen settings. For example, RSI is first calculated as usual, then its Z-score is calculated over your selected lookback period. The script does this for every indicator you enable. Then it averages those Z-scores together to create a single value: zAvg. That value is plotted and used to generate visual cues, signals, table values, background color changes, and candle coloring.
Sequence
Each selected indicator is calculated using your custom input lengths.
The Z-score of each indicator is computed using the shared lookback period.
All active Z-scores are added up and averaged.
The resulting zAvg value is plotted as a line.
Signal conditions check if zAvg crosses user-defined thresholds (default: ±2).
If enabled, the script plots buy/sell signal labels at those crossover points.
The candle color is updated using your selected mode (heatmap or signal-based).
If extreme Z-scores are reached, background highlighting is applied.
A live table updates with each individual Z-score so you know what’s driving the signal.
Features
This script isn’t just about stats—it’s about making them usable in real time. Every feature has a clear reason to exist, and they’re all there to give you a better read on market conditions.
1. Universal Z-Score Line
This is your primary reference. It reflects the average Z-score across all selected indicators. The line updates live and is color-coded to show how far it is from neutral. The further it gets from 0, the brighter the color becomes—cyan for deeply oversold conditions, magenta for overbought. This gives you instant feedback on how statistically “hot” or “cold” the market is, without needing to read any numbers.
2. Signal Labels (“𝓤𝓹” and “𝓓𝓸𝔀𝓷”)
When the average Z-score drops below your lower bound, you’ll see a "𝓤𝓹" label below the bar, suggesting potential bullish reversal conditions. When it rises above the upper bound, a "𝓓𝓸𝔀𝓷" label is shown above the bar—indicating possible bearish exhaustion. These labels are visually clear and minimal so they don’t clutter your chart. They're based on clear crossover logic and do not repaint.
3. Real-Time Z-Score Table
The table shows each indicator's individual Z-score and the final average. It updates every bar, giving you a transparent breakdown of what’s happening under the hood. If the market is showing an extreme average score, this table helps you pinpoint which indicators are contributing the most—so you’re not just guessing where the pressure is coming from.
4. Bar Coloring Modes
You can choose from three modes:
None: Keeps your candles clean and untouched.
Heat: Applies a smooth gradient color based on Z-score intensity. As conditions become more extreme, candle color transitions from neutral to either cyan (bullish pressure) or magenta (bearish pressure).
Latest Signal: Applies hard coloring based on the most recent signal—greenish for a buy, purple for a sell. This mode is great for tracking market state at a glance without relying on a gradient.
Every part of the candle is colored—body, wick, and border—for full visibility.
5. Background Highlighting
When zAvg enters an extreme zone (typically above +2 or below -2), the background shifts color to reflect the market’s intensity. These changes aren’t overwhelming—they’re light fills that act as ambient warnings, helping you stay aware of when price might be reaching a tipping point.
6. Customizable Zone Lines and Fills
You can define what counts as neutral, overbought, and oversold using manual inputs. Horizontal lines show your thresholds, and shaded regions highlight the most extreme zones (+2 to +3 and -2 to -3). These lines give you visual structure to understand where price currently stands in relation to your personal reversal model.
7. Modular Indicator Control
You don’t have to use all the indicators. You can enable or disable any of the 12 with a simple checkbox. This means you can build your own “blend” of market context—maybe you only care about RSI, price, and volume. Or maybe you want everything on. The script adapts accordingly, only averaging what you select.
8. Fully Customizable Sensitivity and Lengths
You can adjust the Z-score lookback length globally (default 100), and tweak individual indicator lengths separately. This lets you tune the indicator’s responsiveness to suit your trading style—slower for longer swings, faster for scalping.
9. Clean Integration with Any Chart Layout
All visual elements are designed to be informative without taking over your chart. The coloring is soft but clear, the labels are readable without being huge, and you can turn off any feature you don’t need. The indicator can work as a full dashboard or as a simple line with a couple of alerts—it’s up to you.
10. Precise, Real-Time Signal Logic
The crossover logic for signals is exact and only fires when the Z-score moves across your defined boundary. No estimation, no delay. Everything is calculated based on current and previous bar data, and nothing repaints or back-adjusts.
Conclusion
The Universal Z-Score Valuation indicator is a tool for traders who want a clear, unbiased way to detect overextension. Instead of relying on a single signal, you get a composite of several market perspectives—momentum, volatility, volume, and more—all standardized into a single view. The script gives you the freedom to control the logic, the visuals, and the components. Whether you use it as a confirmation tool or a primary signal source, it’s designed to give you clarity when markets become chaotic.
Disclaimer
This indicator is for research and educational use only. It does not constitute financial advice or guarantees of performance. All trading involves risk, and users should test any strategy thoroughly before applying it to live markets. Use this tool at your own discretion.

Uptrick: Z-Trend BandsOverview
Uptrick: Z-Trend Bands is a Pine Script overlay crafted to capture high-probability mean-reversion opportunities. It dynamically plots upper and lower statistical bands around an EMA baseline by converting price deviations into z-scores. Once price moves outside these bands and then reenters, the indicator verifies that momentum is genuinely reversing via an EMA-smoothed RSI slope. Signal memory ensures only one entry per momentum swing, and traders receive clear, real-time feedback through customizable bar-coloring modes, a semi-transparent fill highlighting the statistical zone, concise “Up”/“Down” labels, and a live five-metric scoring table.
Introduction
Markets often oscillate between trending and reverting, and simple thresholds or static envelopes frequently misfire when volatility shifts. Standard deviation quantifies how “wide” recent price moves have been, and a z-score transforms each deviation into a measure of how rare it is relative to its own history. By anchoring these bands to an exponential moving average, the script maintains a fluid statistical envelope that adapts instantly to both calm and turbulent regimes. Meanwhile, the Relative Strength Index (RSI) tracks momentum; smoothing RSI with an EMA and observing its slope filters out erratic spikes, ensuring that only genuine momentum flips—upward for longs and downward for shorts—qualify.
Purpose
This indicator is purpose-built for short-term mean-reversion traders operating on lower–timeframe charts. It reveals when price has strayed into the outer 5 percent of its recent range, signaling an increased likelihood of a bounce back toward fair value. Rather than firing on price alone, it demands that momentum follow suit: the smoothed RSI slope must flip in the opposite direction before any trade marker appears. This dual-filter approach dramatically reduces noise-driven, false setups. Traders then see immediate visual confirmation—bar colors that reflect the latest signal and age over time, clear entry labels, and an always-visible table of metric scores—so they can gauge both the validity and freshness of each signal at a glance.
Originality and Uniqueness
Uptrick: Z-Trend Bands stands apart from typical envelope or oscillator tools in four key ways. First, it employs fully normalized z-score bands, meaning ±2 always captures roughly the top and bottom 5 percent of moves, regardless of volatility regime. Second, it insists on two simultaneous conditions—price reentry into the bands and a confirming RSI slope flip—dramatically reducing whipsaw signals. Third, it uses slope-phase memory to lock out duplicate signals until momentum truly reverses again, enforcing disciplined entries. Finally, it offers four distinct bar-coloring schemes (solid reversal, fading reversal, exceeding bands, and classic heatmap) plus a dynamic scoring table, rather than a single, opaque alert, giving traders deep insight into every layer of analysis.
Why Each Component Was Picked
The EMA baseline was chosen for its blend of responsiveness—weighting recent price heavily—and smoothness, which filters market noise. Z-score deviation bands standardize price extremes relative to their own history, adapting automatically to shifting volatility so that “extreme” always means statistically rare. The RSI, smoothed with an EMA before slope calculation, captures true momentum shifts without the false spikes that raw RSI often produces. Slope-phase memory flags prevent repeated alerts within a single swing, curbing over-trading in choppy conditions. Bar-coloring modes provide flexible visual contexts—whether you prefer to track the latest reversal, see signal age, highlight every breakout, or view a continuous gradient—and the scoring table breaks down all five core checks for complete transparency.
Features
This indicator offers a suite of configurable visual and logical tools designed to make reversal signals both robust and transparent:
Dynamic z-score bands that expand or contract in real time to reflect current volatility regimes, ensuring the outer ±zThreshold levels always represent statistically rare extremes.
A smooth EMA baseline that weights recent price more heavily, serving as a fair-value anchor around which deviations are measured.
EMA-smoothed RSI slope confirmation, which filters out erratic momentum spikes by first smoothing raw RSI and then requiring its bar-to-bar slope to flip before any signal is allowed.
Slope-phase memory logic that locks out duplicate buy or sell markers until the RSI slope crosses back through zero, preventing over-trading during choppy swings.
Four distinct bar-coloring modes—Reversal Solid, Reversal Fade, Exceeding Bands, Classic Heat—plus a “None” option, so traders can choose whether to highlight the latest signal, show signal age, emphasize breakout bars, or view a continuous heat gradient within the bands.
A semi-transparent fill between the EMA and the upper/lower bands that visually frames the statistical zone and makes extremes immediately obvious.
Concise “Up” and “Down” labels that plot exactly when price re-enters a band with confirming momentum, keeping chart clutter to a minimum.
A real-time, five-metric scoring table (z-score, RSI slope, price vs. EMA, trend state, re-entry) that updates every two bars, displaying individual +1/–1/0 scores and an averaged Buy/Sell/Neutral verdict for complete transparency.
Calculations
Compute the fair-value EMA over fairLen bars.
Subtract that EMA from current price each bar to derive the raw deviation.
Over zLen bars, calculate the rolling mean and standard deviation of those deviations.
Convert each deviation into a z-score by subtracting the mean and dividing by the standard deviation.
Plot the upper and lower bands at ±zThreshold × standard deviation around the EMA.
Calculate raw RSI over rsiLen bars, then smooth it with an EMA of length rsiEmaLen.
Derive the RSI slope by taking the difference between the current and previous smoothed RSI.
Detect a potential reentry when price exits one of the bands on the prior bar and re-enters on the current bar.
Require that reentry coincide with an RSI slope flip (positive for a lower-band reentry, negative for an upper-band reentry).
On first valid reentry per momentum swing, fire a buy or sell signal and set a memory flag; reset that flag only when the RSI slope crosses back through zero.
For each bar, assign scores of +1, –1, or 0 for the z-score direction, RSI slope, price vs. EMA, trend-state, and reentry status.
Average those five scores; if the result exceeds +0.1, label “Buy,” if below –0.1, label “Sell,” otherwise “Neutral.”
Update bar colors, the semi-transparent fill, reversal labels, and the scoring table every two bars to reflect the latest calculations.
How It Actually Works
On each new candle, the EMA baseline and band widths update to reflect current volatility. The RSI is smoothed and its slope recalculated. The script then looks back one bar to see if price exited either band and forward to see if it reentered. If that reentry coincides with an appropriate RSI slope flip—and no signal has yet been generated in that swing—a concise label appears. Bar colors refresh according to your selected mode, and the scoring table updates to show which of the five conditions passed or failed, along with the overall verdict. This process repeats seamlessly at each bar, giving traders a continuous feed of disciplined, statistically filtered reversal cues.
Inputs
All parameters are fully user-configurable, allowing you to tailor sensitivity, lookbacks, and visuals to your trading style:
EMA length (fairLen): number of bars for the fair-value EMA; higher values smooth more but lag further behind price.
Z-Score lookback (zLen): window for calculating the mean and standard deviation of price deviations; longer lookbacks reduce noise but respond more slowly to new volatility.
Z-Score threshold (zThreshold): number of standard deviations defining the upper and lower bands; common default is 2.0 for roughly the outer 5 percent of moves.
Source (src): choice of price series (close, hl2, etc.) used for EMA, deviation, and RSI calculations.
RSI length (rsiLen): period for raw RSI calculation; shorter values react faster to momentum changes but can be choppier.
RSI EMA length (rsiEmaLen): period for smoothing raw RSI before taking its slope; higher values filter more noise.
Bar coloring mode (colorMode): select from None, Reversal Solid, Reversal Fade, Exceeding Bands, or Classic Heat to control how bars are shaded in relation to signals and band positions.
Show signals (showSignals): toggle on-chart “Up” and “Down” labels for reversal entries.
Show scoring table (enableTable): toggle the display of the five-metric breakdown table.
Table position (tablePos): choose which corner (Top Left, Top Right, Bottom Left, Bottom Right) hosts the scoring table.
Conclusion
By merging a normalized z-score framework, momentum slope confirmation, disciplined signal memory, flexible visuals, and transparent scoring into one Pine Script overlay, Uptrick: Z-Trend Bands offers a powerful yet intuitive tool for intraday mean-reversion trading. Its adaptability to real-time volatility and multi-layered filter logic deliver clear, high-confidence reversal cues without the clutter or confusion of simpler indicators.
Disclaimer
This indicator is provided solely for educational and informational purposes. It does not constitute financial advice. Trading involves substantial risk and may not be suitable for all investors. Past performance is not indicative of future results. Always conduct your own testing and apply careful risk management before trading live.

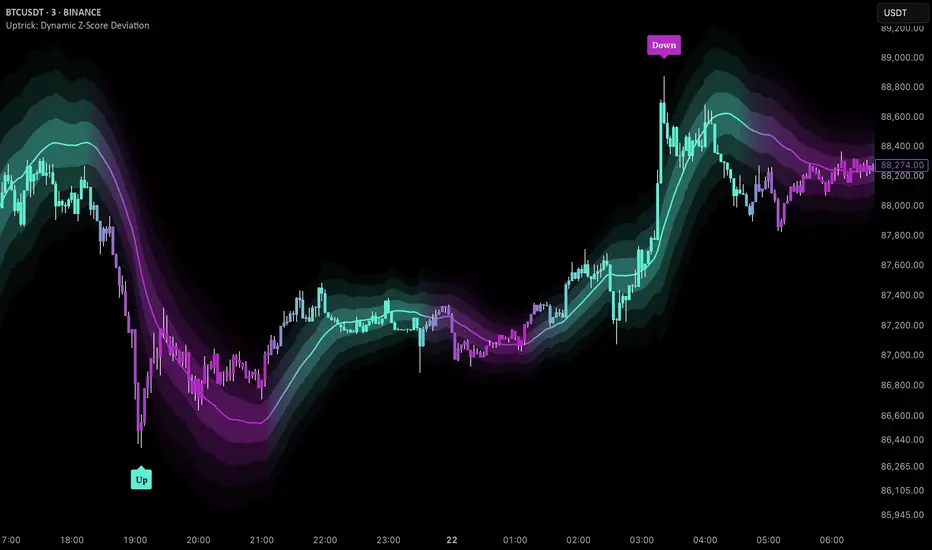
Uptrick: Dynamic Z-Score DeviationOverview
Uptrick: Dynamic Z‑Score Deviation is a trading indicator built in Pine Script that combines statistical filters and adaptive smoothing to highlight potential reversal points in price action. It combines a hybrid moving average, dual Z‑Score analysis on both price and RSI, and visual enhancements like slope‑based coloring, ATR‑based shadow bands, and dynamically scaled reversal signals.
Introduction
Statistical indicators like Z‑Scores measure how far a value deviates from its average relative to the typical variation (standard deviation). Standard deviation quantifies how dispersed a set of values is around its mean. A Z‑Score of +2 indicates a value two standard deviations above the mean, while -2 is two below. Traders use Z‑Scores to spot unusually high or low readings that may signal overbought or oversold conditions.
Moving averages smooth out price data to reveal trends. The Arnaud Legoux Moving Average (ALMA) reduces lag and noise through weighted averaging. A Zero‑Lag EMA (approximated here using a time‑shifted EMA) seeks to further minimize delay in following price. The RSI (Relative Strength Index) is a momentum oscillator that measures recent gains against losses over a set period.
ATR (Average True Range) gauges market volatility by averaging the range between high and low over a lookback period. Shadow bands built using ATR give a visual mood of volatility around a central trend line. Together, these tools inform a dynamic but statistically grounded view of market extremes.
Purpose
The main goal of this indicator is to help traders spot short‑term reversal opportunities on lower timeframes. By requiring both price and momentum (RSI) to exhibit statistically significant deviations from their norms, it filters out weak setups and focuses on higher‑probability mean‑reversion zones. Reversal signals appear when price deviates far enough from its hybrid moving average and RSI deviates similarly in the same direction. This makes it suitable for discretionary traders seeking clean entry cues in volatile environments.
Originality and Uniqueness
Uptrick: Dynamic Z‑Score Deviation distinguishes itself from standard reversal or mean‑reversion tools by combining several elements into a single framework:
A composite moving average (ALMA + Zero‑Lag EMA) for a smooth yet responsive baseline
Dual Z‑Score filters on price and RSI rather than relying on a single measure
Adaptive visual elements, including slope‑aware coloring, multi‑layer ATR shadows, and signal sizing based on combined Z‑Score magnitude
Most indicators focus on one aspect—price envelopes or RSI thresholds—whereas Uptrick: Dynamic Z‑Score Deviation requires both layers to align before signaling. Its visual design aids quick interpretation without overwhelming the chart.
Why these indicators were merged
Every component in Uptrick: Dynamic Z‑Score Deviation has a purpose:
• ALMA: provides a smooth moving average with reduced lag and fewer false crossovers than a simple SMA or EMA.
• Zero‑Lag EMA (ZLMA approximation): further reduces the delay relative to price by applying a time shift to EMA inputs. This keeps the composite MA closer to current price action.
• RSI and its EMA filter: RSI measures momentum. Applying an EMA filter on RSI smooths out false spikes and confirms genuine overbought or oversold momentum.
• Dual Z‑Scores: computing Z‑Scores on both the distance between price and the composite MA, and on smoothed RSI, ensures that signals only fire when both price and momentum are unusually stretched.
• ATR bands: using ATR‑based shadow layers visualizes volatility around the MA, guiding traders on potential support and resistance zones.
At the end, these pieces merge into a single indicator that detects statistically significant mean reversions while staying adaptive to real‑time volatility and momentum.
Calculations
1. Compute ALMA over the chosen MA length, offset, and sigma.
2. Approximate ZLMA by applying EMA to twice the price minus the price shifted by the MA length.
3. Calculate the composite moving average as the average of ALMA and ZLMA.
4. Compute raw RSI and smooth it with ALMA. Apply an EMA filter to raw RSI to reduce noise.
5. For both price and smoothed RSI, calculate the mean and standard deviation over the Z‑Score lookback period.
6. Compute Z‑Scores:
• z_price = (current price − composite MA mean) / standard deviation of price deviations
• z_rsi = (smoothed RSI − mean RSI) / standard deviation of RSI
7. Determine reversal conditions: both Z‑Scores exceed their thresholds in the same direction, RSI EMA is in oversold/overbought zones (below 40 or above 60), and price movement confirms directionality.
8. Compute signal strength as the sum of the absolute Z‑Scores, then classify into weak, medium, or strong.
9. Calculate ATR over the chosen period and multiply by layer multipliers to form shadow widths.
10.Derive slope over the chosen slope length and color the MA line and bars based on direction, optionally smoothing color transitions via EMA on RGB channels.
How this indicator actually works
1. The script begins by smoothing price data with ALMA and approximating a zero‑lag EMA, then averaging them for the main MA.
2. RSI is calculated, then smoothed and filtered.
3. Using a rolling window, the script computes statistical measures for both price deviations and RSI.
4. Z‑Scores tell how far current values lie from their recent norms.
5. When both Z‑Scores cross configured thresholds and momentum conditions align, reversal signals are flagged.
6. Signals are drawn with size and color reflecting strength.
7. The MA is plotted with dynamic coloring; ATR shadows are layered beneath to show volatility envelopes.
8. Bars can be colored to match MA slope, reinforcing trend context.
9. Alert conditions allow automated notifications when signals occur.
Inputs
Main Length: Main MA Length. Sets the period for ALMA and ZLMA.
RSI Length: RSI Length. Determines the lookback for momentum calculations.
Z-Score Lookback: Z‑Score Lookback. Window for mean and standard deviation computations.
Price Z-Score Threshold: Price Z‑Score Threshold. Minimum deviation required for price.
RSI Z-Score threshold: RSI Z‑Score Threshold. Minimum deviation required for momentum.
RSI EMA Filter Length: RSI EMA Filter Length. Smooths raw RSI readings.
ALMA Offset: Controls ALMA’s focal point in the window.
ALMA Sigma: Adjusts ALMA’s smoothing strength.
Show Reversal Signals : Toggle to display reversal signal markers.
Slope Sensitivity: Length for slope calculation. Higher values smooth slope changes.
Use Bar Coloring: Enables coloring of price bars based on MA slope.
Show MA Shadow: Toggle for ATR‑based shadow bands.
Shadow Layer Count: Number of shadow layers (1–4).
Base Shadow ATR Multiplier: Multiplier for ATR when sizing the first band.
Smooth Color Transitions (boolean): Smooths RGB transitions for line and shadows, if enabled.
ATR Length for Shadow: ATR Period for computing volatility bands.
Use Dynamic Signal Size: Toggles dynamic scaling of reversal symbols.
Features
Moving average smoothing: a hybrid of ALMA and Zero‑Lag EMA that balances responsiveness and noise reduction.
Slope coloring: MA line and optionally price bars change color based on trend direction; color transitions can be smoothed for visual continuity.
ATR shadow layers: translucent bands around the MA show volatility envelopes; up to four concentric layers help gauge distance from normal price swings.
Dual Z‑Score filters: price and momentum must both deviate beyond thresholds to trigger signals, reducing false positives.
Dynamic signal sizing: reversal markers scale in size based on the combined Z‑Score magnitude, making stronger signals more prominent.
Adaptive visuals: optional smoothing of color channels creates gradient effects on lines and fills for a polished look.
Alert conditions: built‑in buy and sell alerts notify traders when reversal setups emerge.
Conclusion
Uptrick: Dynamic Z‑Score Deviation delivers a structured way to identify short‑term reversal opportunities by fusing statistical rigor with adaptive smoothing and clear visual cues. It guides traders through multiple confirmation layers—hybrid moving average, dual Z‑Score analysis, momentum filtering, and volatility envelopes—while keeping the chart clean and informative.
Disclaimer
This indicator is provided for informational and educational purposes only and does not constitute financial advice. Trading carries risk and may not be suitable for all participants. Past performance is not indicative of future results. Always do your own analysis and risk management before making trading decisions.
Uptrick X PineIndicators: Z-Score Flow StrategyThis strategy is based on the Z-Score Flow Indicator developed by Uptrick. Full credit for the original concept and logic goes to Uptrick.
The Z-Score Flow Strategy combines statistical mean-reversion logic with trend filtering, RSI confirmation, and multi-mode trade execution, offering a flexible and structured approach to trading both reversals and trend continuations.
Core Concepts Behind Z-Score Flow
1. Z-Score Mean Reversion Logic
The Z-score measures how far current price deviates from its statistical mean, in standard deviations.
A high positive Z-score (e.g. > 2) suggests price is overbought and may revert downward.
A low negative Z-score (e.g. < -2) suggests price is oversold and may revert upward.
The strategy uses Z-score thresholds to trigger signals when price deviates far enough from its mean.
2. Trend Filtering with EMA
To prevent counter-trend entries, the strategy includes a trend filter based on a 50-period EMA:
Only allows long entries if price is below EMA (mean-reversion in downtrends).
Only allows short entries if price is above EMA (mean-reversion in uptrends).
3. RSI Confirmation and Lockout System
An RSI smoothing mechanism helps confirm signals and avoid whipsaws:
RSI must be below 30 and rising to allow buys.
RSI must be above 70 and falling to allow sells.
Once a signal occurs, it is "locked out" until RSI re-enters the neutral zone (30–70).
This avoids multiple signals in overextended zones and reduces overtrading.
Entry Signal Logic
A buy or sell is triggered when:
Z-score crosses below (buy) or above (sell) the threshold.
RSI smoothed condition is met (oversold and rising / overbought and falling).
The trend condition (EMA filter) aligns.
A cooldown period has passed since the last opposite trade.
This layered approach helps ensure signal quality and timing precision.
Trade Modes
The strategy includes three distinct trade modes to adapt to various market behaviors:
1. Standard Mode
Trades are opened using the Z-score + RSI + trend filter logic.
Each signal must pass all layered conditions.
2. Zero Cross Mode
Trades are based on the Z-score crossing zero.
This mode is useful in trend continuation setups, rather than mean reversion.
3. Trend Reversal Mode
Trades occur when the mean slope direction changes, i.e., basis line changes color.
Helps capture early trend shifts with less lag.
Each mode can be customized for long-only, short-only, or long & short execution.
Visual Components
1. Z-Score Mean Line
The basis (mean) line is colored based on slope direction.
Green = bullish slope, Purple = bearish slope, Gray = flat.
A wide shadow band underneath reflects current trend momentum.
2. Gradient Fill to Price
A gradient zone between price and the mean reflects:
Price above mean = bearish zone with purple overlay.
Price below mean = bullish zone with teal overlay.
This visual aid quickly reveals market positioning relative to equilibrium.
3. Signal Markers
"𝓤𝓹" labels appear for buy signals.
"𝓓𝓸𝔀𝓷" labels appear for sell signals.
These are colored and positioned according to trend context.
Customization Options
Z-Score Period & Thresholds: Define sensitivity to price deviations.
EMA Trend Filter Length: Filter entries with long-term bias.
RSI & Smoothing Periods: Fine-tune RSI confirmation conditions.
Cooldown Period: Prevent signal spam and enforce timing gaps.
Slope Index: Adjust how far back to compare mean slope.
Visual Settings: Toggle mean lines, gradients, and more.
Use Cases & Strategy Strengths
1. Mean-Reversion Trading
Ideal for catching pullbacks in trending markets or fading overextended price moves.
2. Trend Continuation or Reversal
With multiple trade modes, traders can choose between fading price extremes or trading slope momentum.
3. Signal Clarity and Risk Control
The combination of Z-score, RSI, EMA trend, and cooldown logic provides high-confidence signals with built-in filters.
Conclusion
The Z-Score Flow Strategy by Uptrick X PineIndicators is a versatile and structured trading system that:
Fuses statistical deviation (Z-score) with technical filters.
Provides both mean-reversion and trend-based entry logic.
Uses visual overlays and signal labels for clarity.
Prevents noise-driven trades via cooldown and lockout systems.
This strategy is well-suited for traders seeking a data-driven, multi-condition entry framework that can adapt to various market types.
Full credit for the original concept and indicator goes to Uptrick.

Uptrick: Z-Score FlowOverview
Uptrick: Z-Score Flow is a technical indicator that integrates trend-sensitive momentum analysi s with mean-reversion logic derived from Z-Score calculations. Its primary objective is to identify market conditions where price has either stretched too far from its mean (overbought or oversold) or sits at a statistically “normal” range, and then cross-reference this observation with trend direction and RSI-based momentum signals. The result is a more contextual approach to trade entry and exit, emphasizing precision, clarity, and adaptability across varying market regimes.
Introduction
Financial instruments frequently transition between trending modes, where price extends strongly in one direction, and ranging modes, where price oscillates around a central value. A simple statistical measure like Z-Score can highlight price extremes by comparing the current price against its historical mean and standard deviation. However, such extremes alone can be misleading if the broader market structure is trending forcefully. Uptrick: Z-Score Flow aims to solve this gap by combining Z-Score with an exponential moving average (EMA) trend filter and a smoothed RSI momentum check, thus filtering out signals that contradict the prevailing market environment.
Purpose
The purpose of this script is to help traders pinpoint both mean-reversion opportunities and trend-based pullbacks in a way that is statistically grounded yet still mindful of overarching price action. By pairing Z-Score thresholds with supportive conditions, the script reduces the likelihood of acting on random price spikes or dips and instead focuses on movements that are significant within both historical and current contextual frameworks.
Originality and Uniquness
Layered Signal Verification: Signals require the fulfillment of multiple layers (Z-Score extreme, EMA trend bias, and RSI momentum posture) rather than merely breaching a statistical threshold.
RSI Zone Lockout: Once RSI enters an overbought/oversold zone and triggers a signal, the script locks out subsequent signals until RSI recovers above or below those zones, limiting back-to-back triggers.
Controlled Cooldown: A dedicated cooldown mechanic ensures that the script waits a specified number of bars before issuing a new signal in the opposite direction.
Gradient-Based Visualization: Distinct gradient fills between price and the Z-Mean line enhance readability, showing at a glance whether price is trading above or below its statistical average.
Comprehensive Metrics Panel: An optional on-chart table summarizes the Z-Score’s key metrics, streamlining the process of verifying current statistical extremes, mean levels, and momentum directions.
Why these indicators were merged
Z-Score measurements excel at identifying when price deviates from its mean, but they do not intrinsically reveal whether the market’s trajectory supports a reversion or if price might continue along its trend. The EMA, commonly used for spotting trend directions, offers valuable insight into whether price is predominantly ascending or descending. However, relying solely on a trend filter overlooks the intensity of price moves. RSI then adds a dedicated measure of momentum, helping confirm if the market’s energy aligns with a potential reversal (for example, price is statistically low but RSI suggests looming upward momentum). By uniting these three lenses—Z-Score for statistical context, EMA for trend direction, and RSI for momentum force—the script offers a more comprehensive and adaptable system, aiming to avoid false positives caused by focusing on just one aspect of price behavior.
Calculations
The core calculation begins with a simple moving average (SMA) of price over zLen bars, referred to as the basis. Next, the script computes the standard deviation of price over the same window. Dividing the difference between the current price and the basis by this standard deviation produces the Z-Score, indicating how many standard deviations the price is from its mean. A positive Z-Score reveals price is above its average; a negative reading indicates the opposite.
To detect overall market direction, the script calculates an exponential moving average (emaTrend) over emaTrendLen bars. If price is above this EMA, the script deems the market bullish; if below, it’s considered bearish. For momentum confirmation, the script computes a standard RSI over rsiLen bars, then applies a smoothing EMA over rsiEmaLen bars. This smoothed RSI (rsiEma) is monitored for both its absolute level (oversold or overbought) and its slope (the difference between the current and previous value). Finally, slopeIndex determines how many bars back the script compares the basis to check whether the Z-Mean line is generally rising, falling, or flat, which then informs the coloring scheme on the chart.
Calculations and Rational
Simple Moving Average for Baseline: An SMA is used for the core mean because it places equal weight on each bar in the lookback period. This helps maintain a straightforward interpretation of overbought or oversold conditions in the context of a uniform historical average.
Standard Deviation for Volatility: Standard deviation measures the variability of the data around the mean. By dividing price’s difference from the mean by this value, the Z-Score can highlight whether price is unusually stretched given typical volatility.
Exponential Moving Average for Trend: Unlike an SMA, an EMA places more emphasis on recent data, reacting quicker to new price developments. This quicker response helps the script promptly identify trend shifts, which can be crucial for filtering out signals that go against a strong directional move.
RSI for Momentum Confirmation: RSI is an oscillator that gauges price movement strength by comparing average gains to average losses over a set period. By further smoothing this RSI with another EMA, short-lived oscillations become less influential, making signals more robust.
SlopeIndex for Slope-Based Coloring: To clarify whether the market’s central tendency is rising or falling, the script compares the basis now to its level slopeIndex bars ago. A higher current reading indicates an upward slope; a lower reading, a downward slope; and similar readings, a flat slope. This is visually represented on the chart, providing an immediate sense of the directionality.
Inputs
zLen (Z-Score Period)
Specifies how many bars to include for computing the SMA and standard deviation that form the basis of the Z-Score calculation. Larger values produce smoother but slower signals; smaller values catch quick changes but may generate noise.
emaTrendLen (EMA Trend Filter)
Sets the length of the EMA used to detect the market’s primary direction. This is pivotal for distinguishing whether signals should be considered (price aligning with an uptrend or downtrend) or filtered out.
rsiLen (RSI Length)
Defines the window for the initial RSI calculation. This RSI, when combined with the subsequent smoothing EMA, forms the foundation for momentum-based signal confirmations.
rsiEmaLen (EMA of RSI Period)
Applies an exponential moving average over the RSI readings for additional smoothing. This step helps mitigate rapid RSI fluctuations that might otherwise produce whipsaw signals.
zBuyLevel (Z-Score Buy Threshold)
Determines how negative the Z-Score must be for the script to consider a potential oversold signal. If the Z-Score dives below this threshold (and other criteria are met), a buy signal is generated.
zSellLevel (Z-Score Sell Threshold)
Determines how positive the Z-Score must be for a potential overbought signal. If the Z-Score surpasses this threshold (and other checks are satisfied), a sell signal is generated.
cooldownBars (Cooldown (Bars))
Enforces a bar-based delay between opposite signals. Once a buy signal has fired, the script must wait the specified number of bars before registering a new sell signal, and vice versa.
slopeIndex (Slope Sensitivity (Bars))
Specifies how many bars back the script compares the current basis for slope coloration. A bigger slopeIndex highlights larger directional trends, while a smaller number emphasizes shorter-term shifts.
showMeanLine (Show Z-Score Mean Line)
Enables or disables the plotting of the Z-Mean and its slope-based coloring. Traders who prefer minimal chart clutter may turn this off while still retaining signals.
Features
Statistical Core (Z-Score Detection):
This feature computes the Z-Score by taking the difference between the current price and the basis (SMA) and dividing by the standard deviation. In effect, it translates price fluctuations into a standardized measure that reveals how significant a move is relative to the typical variation seen over the lookback. When the Z-Score crosses predefined thresholds (zBuyLevel for oversold and zSellLevel for overbought), it signals that price could be at an extreme.
How It Works: On each bar, the script updates the SMA and standard deviation. The Z-Score is then refreshed accordingly. Traders can interpret particularly large negative or positive Z-Score values as scenarios where price is abnormally low or high.
EMA Trend Filter:
An EMA over emaTrendLen bars is used to classify the market as bullish if the price is above it and bearish if the price is below it. This classification is applied to the Z-Score signals, accepting them only when they align with the broader price direction.
How It Works: If the script detects a Z-Score below zBuyLevel, it further checks if price is actually in a downtrend (below EMA) before issuing a buy signal. This might seem counterintuitive, but a “downtrend” environment plus an oversold reading often signals a potential bounce or a mean-reversion play. Conversely, for sell signals, the script checks if the market is in an uptrend first. If it is, an overbought reading aligns with potential profit-taking.
RSI Momentum Confirmation with Oversold/Overbought Lockout:
RSI is calculated over rsiLen, then smoothed by an EMA over rsiEmaLen. If this smoothed RSI dips below a certain threshold (for example, 30) and then begins to slope upward, the indicator treats it as a potential sign of recovering momentum. Similarly, if RSI climbs above a certain threshold (for instance, 70) and starts to slope downward, that suggests dwindling momentum. Additionally, once RSI is in these zones, the indicator locks out repetitive signals until RSI fully exits and re-enters those extreme territories.
How It Works: Each bar, the script measures whether RSI has dropped below the oversold threshold (like 30) and has a positive slope. If it does, the buy side is considered “unlocked.” For sell signals, RSI must exceed an overbought threshold (70) and slope downward. The combination of threshold and slope helps confirm that a reversal is genuinely in progress instead of issuing signals while momentum remains weak or stuck in extremes.
Cooldown Mechanism:
The script features a custom bar-based cooldown that prevents issuing new signals in the opposite direction immediately after one is triggered. This helps avoid whipsaw situations where the market quickly flips from oversold to overbought or vice versa.
How It Works: When a buy signal fires, the indicator notes the bar index. If the Z-Score and RSI conditions later suggest a sell, the script compares the current bar index to the last buy signal’s bar index. If the difference is within cooldownBars, the signal is disallowed. This ensures a predefined “quiet period” before switching signals.
Slope-Based Coloring (Z-Mean Line and Shadow):
The script compares the current basis value to its value slopeIndex bars ago. A higher reading now indicates a generally upward slope, while a lower reading indicates a downward slope. The script then shades the Z-Mean line in a corresponding bullish or bearish color, or remains neutral if little change is detected.
How It Works: This slope calculation is refreshingly straightforward: basis – basis . If the result is positive, the line is colored bullish; if negative, it is colored bearish; if approximately zero, it remains neutral. This provides a quick visual cue of the medium-term directional bias.
Gradient Overlays:
With gradient fills, the script highlights where price stands in relation to the Z-Mean. When price is above the basis, a purple-shaded region is painted, visually indicating a “bearish zone” for potential overbought conditions. When price is below, a teal-like overlay is used, suggesting a “bullish zone” for potential oversold conditions.
How It Works: Each bar, the script checks if price is above or below the basis. It then applies a fill between close and basis, using distinct colors to show whether the market is trading above or below its mean. This creates an immediate sense of how extended the market might be.
Buy and Sell Labels (with Alerts):
When a legitimate buy or sell condition passes every check (Z-Score threshold, EMA trend alignment, RSI gating, and cooldown clearance), the script plots a corresponding label directly on the chart. It also fires an alert (if alerts are set up), making it convenient for traders who want timely notifications.
How It Works: If rawBuy or rawSell conditions are met (refined by RSI, EMA trend, and cooldown constraints), the script calls the respective plot function to paint an arrow label on the chart. Alerts are triggered simultaneously, carrying easily recognizable messages.
Metrics Table:
The optional on-chart table (activated by showMetrics) presents real-time Z-Score data, including the current Z-Score, its rolling mean, the maximum and minimum Z-Score values observed over the last zLen bars, a percentile position, and a short-term directional note (rising, falling, or flat).
Current – The present Z-Score reading
Mean – Average Z-Score over the zLen period
Min/Max – Lowest and highest Z-Score values within zLen
Position – Where the current Z-Score sits between the min and max (as a percentile)
Trend – Whether the Z-Score is increasing, decreasing, or flat
Conclusion
Uptrick: Z-Score Flow offers a versatile solution for traders who need a statistically informed perspective on price extremes combined with practical checks for overall trend and momentum. By leveraging a well-defined combination of Z-Score, EMA trend classification, RSI-based momentum gating, slope-based visualization, and a cooldown mechanic, the script reduces the occurrence of false or premature signals. Its gradient fills and optional metrics table contribute further clarity, ensuring that users can quickly assess market posture and make more confident trading decisions in real time.
Disclaimer
This script is intended solely for informational and educational purposes. Trading in any financial market comes with substantial risk, and there is no guarantee of success or the avoidance of loss. Historical performance does not ensure future results. Always conduct thorough research and consider professional guidance prior to making any investment or trading decisions.

Uptrick: Acceleration ShiftsIntroduction
Uptrick: Acceleration Shifts is designed to measure and visualize price momentum shifts by focusing on acceleration —the rate of change in velocity over time. It uses various moving average techniques as a trend filter, providing traders with a clearer perspective on market direction and potential trade entries or exits.
Purpose
The main goal of this indicator is to spot strong momentum changes (accelerations) and confirm them with a chosen trend filter. It attempts to distinguish genuine market moves from noise, helping traders make more informed decisions. The script can also trigger multiple entries (smart pyramiding) within the same trend, if desired.
Overview
By measuring how quickly price velocity changes (acceleration) and comparing it against a smoothed average of itself, this script generates buy or sell signals once the acceleration surpasses a given threshold. A trend filter is added for further validation. Users can choose from multiple smoothing methods and color schemes, and they can optionally enable a small table that displays real-time acceleration values.
Originality and Uniqueness
This script offers an acceleration-based approach, backed by several different moving average choices. The blend of acceleration thresholds, a trend filter, and an optional extra-entry (pyramiding) feature provides a flexible toolkit for various trading styles. The inclusion of multiple color themes and a slope-based coloring of the trend line adds clarity and user customization.
Inputs & Features
1. Acceleration Length (length)
This input determines the number of bars used when calculating velocity. Specifically, the script computes velocity by taking the difference in closing prices over length bars, and then calculates acceleration based on how that velocity changes over an additional length. The default is 14.
2. Trend Filter Length (smoothing)
This sets the lookback period for the chosen trend filter method. The default of 50 results in a moderately smooth trend line. A higher smoothing value will create a slower-moving trend filter.
3. Acceleration Threshold (threshold)
This multiplier determines when acceleration is considered strong enough to trigger a main buy or sell signal. A default value of 2.5 means the current acceleration must exceed 2.5 times the average acceleration before signaling.
4. Smart Pyramiding Strength (pyramidingThreshold)
This lower threshold is used for additional (pyramiding) entries once the main trend has already been identified. For instance, if set to 0.5, the script looks for acceleration crossing ±0.5 times its average acceleration to add extra positions.
5. Max Pyramiding Entries (maxPyramidingEntries)
This sets a limit on how many extra positions can be opened (beyond the first main signal) in a single directional trend. The default of 3 ensures traders do not become overexposed.
6. Show Acceleration Table (showTable)
When enabled, a small table displaying the current acceleration and its average is added to the top-right corner of the chart. This table helps monitor real-time momentum changes.
7. Smart Pyramiding (enablePyramiding)
This toggle decides whether additional entries (buy or sell) will be generated once a main signal is active. If enabled, these extra signals act as filtered entries, only firing when acceleration re-crosses a smaller threshold (pyramidingThreshold). These signals have a '+' next to their signal on the label.
8. Select Color Scheme (selectedColorScheme)
Allows choosing between various pre-coded color themes, such as Default, Emerald, Sapphire, Golden Blaze, Mystic, Monochrome, Pastel, Vibrant, Earth, or Neon. Each theme applies a distinct pair of colors for bullish and bearish conditions.
9. Trend Filter (TrendFilter)
Lets the user pick one of several moving average approaches to determine the prevailing trend. The options include:
Short Term (TEMA)
EWMA
Medium Term (HMA)
Classic (SMA)
Quick Reaction (DEMA)
Each method behaves differently, balancing reactivity and smoothness.
10. Slope Lookback (slopeOffset)
Used to measure the slope of the trend filter over a set number of bars (default is 10). This slope then influences the coloring of the trend filter line, indicating bullish or bearish tilt.
Note: The script refers to this as the "Massive Slope Index," but it effectively serves as a Trend Slope Calculation, measuring how the chosen trend filter changes over a specified period.
11. Alerts for Buy/Sell and Pyramiding Signals
The script includes built-in alert conditions that can be enabled or configured. These alerts trigger whenever the script detects a main Buy or Sell signal, as well as extra (pyramiding) signals if Smart Pyramiding is active. This feature allows traders to receive immediate notifications or automate a trading response.
Calculation Methodology
1. Velocity and Acceleration
Velocity is derived by subtracting the closing price from its value length bars ago. Acceleration is the difference in velocity over an additional length period. This highlights how quickly momentum is shifting.
2. Average Acceleration
The script smooths raw acceleration with a simple moving average (SMA) using the smoothing input. Comparing current acceleration against this average provides a threshold-based signal mechanism.
3. Trend Filter
Users can pick one of five moving average types to form a trend baseline. These range from quick-reacting methods (DEMA, TEMA) to smoother options (SMA, HMA, EWMA). The script checks whether the price is above or below this filter to confirm trend direction.
4. Buy/Sell Logic
A buy occurs when acceleration surpasses avgAcceleration * threshold and price closes above the trend filter. A sell occurs under the opposite conditions. An additional overbought/oversold check (based on a longer SMA) refines these signals further.
When price is considered oversold (i.e., close is below a longer-term SMA), a bullish acceleration signal has a higher likelihood of success because it indicates that the market is attempting to reverse from a lower price region. Conversely, when price is considered overbought (close is above this longer-term SMA), a bearish acceleration signal is more likely to be valid. This helps reduce false signals by waiting until the market is extended enough that a reversal or continuation has a stronger chance of following through.
5. Smart Pyramiding
Once a main buy or sell signal is triggered, additional (filtered) entries can be taken if acceleration crosses a smaller multiplier (pyramidingThreshold). This helps traders scale into strong moves. The script enforces a cap (maxPyramidingEntries) to limit risk.
6. Visual Elements
Candles can be recolored based on the active signal. Labels appear on the chart whenever a main or pyramiding entry signal is triggered. An optional table can show real-time acceleration values.
Color Schemes
The script includes a variety of predefined color themes. For bullish conditions, it might use turquoise or green, and for bearish conditions, magenta or red—depending on which color scheme the user selects. Each scheme aims to provide clear visual differentiation between bullish and bearish market states.
Why Each Indicator Was Part of This Component
Acceleration is employed to detect swift changes in momentum, capturing shifts that may not yet appear in more traditional measures. To further adapt to different trading styles and market conditions, several moving average methods are incorporated:
• TEMA (Triple Exponential Moving Average) is chosen for its ability to reduce lag more effectively than a standard EMA while still reacting swiftly to price changes. Its construction layers exponential smoothing in a way that can highlight sudden momentum shifts without sacrificing too much smoothness.
• DEMA (Double Exponential Moving Average) provides a faster response than a single EMA by using two layers of exponential smoothing. It is slightly less smoothed than TEMA but can alert traders to momentum changes earlier, though with a higher risk of noise in choppier markets.
• HMA (Hull Moving Average) is known for its balance of smoothness and reduced lag. Its weighted calculations help track trend direction clearly, making it useful for traders who want a smoother line that still reacts fairly quickly.
• SMA (Simple Moving Average) is the classic baseline for smoothing price data. It offers a clear, stable perspective on long-term trends, though it reacts more slowly than other methods. Its simplicity can be beneficial in lower-volatility or more stable market environments.
• EWMA (Exponentially Weighted Moving Average) provides a middle ground by emphasizing recent price data while still retaining some degree of smoothing. It typically responds faster than an SMA but is less aggressive than DEMA or TEMA.
Alongside these moving average techniques, the script employs a slope calculation (referred to as the “Massive Slope Index”) to visually indicate whether the chosen filter is sloping upward or downward. This adds an extra layer of clarity to directional analysis. The indicator also uses overbought/oversold checks, based on a longer-term SMA, to help filter out signals in overstretched markets—reducing the likelihood of false entries in conditions where the price is already extensively extended.
Additional Features
Alerts can be set up for both main signals and additional pyramiding signals, which is helpful for automated or semi-automated trading. The optional acceleration table offers quick reference values, making momentum monitoring more intuitive. Including explicit alert conditions for Buy/Sell and Pyramiding ensures traders can respond promptly to market movements or integrate these triggers into automated strategies.
Summary
This script serves as a comprehensive momentum-based trading framework, leveraging acceleration metrics and multiple moving average filters to identify potential shifts in market direction. By combining overbought/oversold checks with threshold-based triggers, it aims to reduce the noise that commonly plagues purely reactive indicators. The flexibility of Smart Pyramiding, customizable color schemes, and built-in alerts allows users to tailor their experience and respond swiftly to valid signals, potentially enhancing trading decisions across various market conditions.
Disclaimer
All trading involves significant risk, and users should apply their own judgment, risk management, and broader analysis before making investment decisions.

Uptrick: Time Based ReversionIntroduction
The Uptrick: Time Based Reversion indicator is designed to provide a comprehensive view of market momentum and potential trend shifts by combining multiple moving averages, a streak-based trend analysis system, and adaptive color visualization. It helps traders identify strong trends, spot potential reversals, and make more informed trading decisions.
Purpose
The primary goal of this indicator is to assist traders in distinguishing between sustained market movements and short-lived fluctuations. By evaluating how price behaves relative to its moving averages, and by measuring consecutive streaks above or below these averages, the indicator highlights areas where trends are likely to continue or lose momentum.
Overview
Uptrick: Time Based Reversion calculates one or more moving averages of price data and then tracks the number of consecutive bars (streaks) above or below these averages. This streak-based detection provides insight into whether a trend is gaining strength or nearing a potential reversal point. The indicator offers:
• Multiple moving average types (SMA, EMA, WMA)
• Optional second and third moving average layers for additional smoothing of first moving average
• A streak detection system to quantify trend intensity
• A dynamic color scheme that changes with streak strength
• Optional buy and sell signals for potential trade entries and exits
• A ribbon mode that applies moving averages to Open, High, Low, and Close prices for a more detailed visualization of overall trend alignment
Originality and Uniqueness
Unlike traditional moving average indicators, Uptrick: Time Based Reversion incorporates a streak measurement system to detect trend strength. This approach helps clarify whether a price movement is merely a quick fluctuation or part of a longer-lasting trend. Additionally, the optional ribbon mode extends this logic to Open, High, Low, and Close prices, creating a layered and intuitive visualization that shows complete trend alignment.
Inputs and Features
1. Enable Ribbon Mode
This input lets you activate or deactivate the ribbon display of multiple moving averages. When enabled, the script plots moving averages for the Open, High, Low, and Close prices and uses color fills to show whether these four data points are collectively above or below their respective moving averages.
2. Color Scheme Selection
Users can choose from several predefined color schemes, such as Default, Emerald, Crimson, Sapphire, Gold, Purple, Teal, Orange, Gray, Lime, or Aqua. Each scheme assigns distinct bullish, bearish and neutral colors..
3. Show Buy/Sell Signals
The indicator can display buy or sell signals based on its streak analysis logic. These signals appear as markers on the chart, indicating a “Safe Uptrend” (buy) or “Safe Downtrend” (sell).
4. Moving Average Types and Lengths
• First MA Type and Length: Choose SMA, EMA, or WMA along with a customizable period.
• Second and Third MA Types and Lengths: You can optionally stack additional moving averages for further smoothing, each with its own customizable type and period.
5. Streak Threshold Multiplier
This numeric input determines how strong a streak must be before the script considers it a “safe” trend. A higher multiplier requires a longer or more intense streak for a buy or sell signal.
6. Dynamic Transparency Calculation
The color intensity adapts to the streak’s strength. Longer streaks increase the transparency of the opposing color, making the current dominant color stand out. This feature ensures that a vigorous uptrend or downtrend is visually distinct from short-lived or weaker moves.
7. Ribbon Moving Averages
In ribbon mode, the script calculates moving averages for the Open, High, Low, and Close prices. Each of these is optionally smoothed again if the second and/or third moving average layers are active. The final result is a ribbon of moving averages that helps confirm whether the market is uniformly aligned above or below these key reference points.
Calculation Methodology
1. Initial Moving Average
The script calculates the first moving average (SMA, EMA, or WMA) of the closing price over a user-defined period.
2. Optional Secondary and Tertiary Averages
If selected, the script then applies a second and/or third smoothing step. Each of these steps can be a different type of moving average (SMA, EMA, or WMA) with its own period length.
3. Streak Detection
The indicator counts consecutive bars above or below the smoothed moving average. A running total (streakUp or streakDown) increments with every bar that remains above or below that average.
4. Reversion Intensity
The script compares the current streak value to its own average (calculated over the final chosen period). This ratio determines whether the streak is nearing a likely reversion or is strong enough to continue.
5. Color Assignment and Signals
The indicator calculates color transparency based on streak intensity. Buy and sell signals appear when the streak meets or exceeds the threshold multiplier, indicating a safe uptrend or downtrend.
Color Schemes and Visualization
This indicator offers multiple predefined color sets. Each scheme specifies a unique bullish color, bearish color and neutral color. The script automatically varies transparency to highlight strong trends and fade weaker ones, making it visually clear when a trend is intensifying or losing momentum.
Smoothing Techniques
By allowing up to three layers of moving average smoothing, the indicator accommodates different trading styles. A single layer provides faster reactions to market changes, while more layers reduce noise at the cost of slower responsiveness. Traders can choose the right balance between responsiveness and stability for their strategy, whether it is short-term scalping or long-term trend following.
Why It Combines Specific Smoothing Techniques
The Uptrick: Time Based Reversion indicator strategically combines specific smoothing techniques—SMA, EMA, and WMA—to leverage their complementary strengths. The SMA provides stable and consistent trend identification by equally weighting all data points, while the EMA emphasizes recent price movements, allowing quicker responses to market changes. WMA enhances sensitivity to recent price shifts, which helps in detecting subtle momentum changes early. By integrating these methods in layers, the indicator effectively balances responsiveness with stability, helping traders clearly identify genuine trend changes while filtering out short-term noise and false signals.
Ribbon Mode
If Open, High, Low, and Close prices remain above or below their respective moving averages consistently, the script colors the bars fully bullish or bearish. When the data points are mixed, a neutral color is applied. This mode provides a thorough perspective on whether the entire price range is aligned in one direction or showing conflicting signals.
Summary
Uptrick: Time Based Reversion combines multiple moving averages, streak detection, and dynamic color adjustments to help traders identify significant trends and potential reversal areas. Its flexibility allows it to be used either in a simpler form, with one moving average and streak analysis, or in a more advanced configuration with ribbon mode that charts multiple smoothed averages for a deeper understanding of price alignment. By adapting color intensities based on streak strength and providing optional buy/sell signals, this indicator delivers a clear and flexible tool suited to various trading strategies.
Disclaimer
This indicator is designed as an analysis aid and does not guarantee profitable trades. Past performance does not indicate future success, and market conditions can change unexpectedly. Users are advised to employ proper risk management and thoroughly evaluate trades before taking positions. Use this indicator as part of a broader strategy, not as a sole decision-making tool.

Uptrick: Alpha TrendIntroduction
Uptrick: Alpha Trend is a comprehensive technical analysis indicator designed to provide traders with detailed insights into market trends, momentum, and risk metrics. It adapts to various trading styles—from quick scalps to longer-term positions—by dynamically adjusting its calculations and visual elements. By combining multiple smoothing techniques, advanced color schemes, and customizable data tables, the indicator offers a holistic view of market behavior.
Originality
The Alpha Trend indicator distinguishes itself by blending established technical concepts with innovative adaptations. It employs three different smoothing techniques tailored to specific trading modes (Scalp, Swing, and Position), and it dynamically adjusts its parameters to match the chosen mode. The indicator also offers a wide range of color palettes and multiple on-screen tables that display key metrics. This unique combination of features, along with its ability to adapt in real time, sets it apart as a versatile tool for both novice and experienced traders.
Features
1. Multi-Mode Trend Line
The indicator automatically selects a smoothing method based on the trading mode:
- Scalp Mode uses the Hull Moving Average (HMA) for rapid responsiveness.
- Swing Mode employs the Exponential Moving Average (EMA) for balanced reactivity.
- Position Mode applies the Weighted Moving Average (WMA) for smoother, long-term trends.
Each method is chosen to best capture the price action dynamics appropriate to the trader’s timeframe.
2. Adaptive Momentum Thresholds
It tracks bullish and bearish momentum with counters that increment as the trend confirms directional movement. When these counters exceed a user-defined threshold, the indicator generates optional buy or sell signals. This approach helps filter out minor fluctuations and highlights significant market moves.
3. Gradient Fills
Two types of fills enhance visual clarity:
- Standard Gradient Fill displays ATR-based zones above and below the trend line, indicating potential bullish and bearish areas.
- Fading Gradient Fill creates a smooth transition between the trend line and the price, visually emphasizing the distance between them.
4. Bar Coloring and Signal Markers
The indicator can color-code bars based on market conditions—bullish, bearish, or neutral—allowing for immediate visual assessment. Additionally, signal markers such as buy and sell arrows are plotted when momentum thresholds are breached.
5. Comprehensive Data Tables
Uptrick: Alpha Trend offers several optional tables for detailed analysis:
- Insider Info: Displays key metrics like the current trend value, bullish/bearish momentum counts, and ATR.
- Indicator Metrics: Lists input settings such as trend length, damping, signal threshold, and net momentum.
- Market Analysis: Summarizes overall trend direction, trend strength, Sortino ratio, return, and volatility.
- Price & Trend Dynamics: Details price deviation from the trend, trend slope, and ATR ratio.
- Momentum & Volatility Insights: Presents RSI, standard deviation (volatility), and net momentum.
- Performance & Acceleration Metrics: Focuses on the Sortino ratio, trend acceleration, return, and trend strength.
Each table can be positioned flexibly on the chart, allowing traders to customize the layout according to their needs.
Why It Combines Specific Smoothing Techniques
Smoothing techniques are essential for filtering out market noise and revealing underlying trends. The indicator combines three smoothing methods for the following reasons:
- The Hull Moving Average (HMA) in Scalp Mode minimizes lag and responds quickly to price changes, which is critical for short-term trading.
- The Exponential Moving Average (EMA) in Swing Mode gives more weight to recent data, striking a balance between speed and smoothness. This makes it suitable for mid-term trend analysis.
- The Weighted Moving Average (WMA) in Position Mode smooths out short-term fluctuations, offering a clear view of longer-term trends and reducing the impact of transient market volatility.
By using these specific methods in their respective trading modes, the indicator ensures that the trend line is appropriately responsive for the intended time frame, enhancing decision-making while maintaining clarity.
Inputs
1. Trend Length (Default: 30)
Defines the lookback period for the smoothing calculation. A shorter trend length results in a more responsive line, while a longer length produces a smoother, less volatile trend.
2. Trend Damping (Default: 0.75)
Controls the degree of smoothing applied to the trend line. Lower values lead to a smoother curve, whereas higher values increase sensitivity to price fluctuations.
3. Signal Strength Threshold (Default: 5)
Specifies the number of consecutive bullish or bearish bars required to trigger a signal. Higher thresholds reduce the frequency of signals, focusing on stronger moves.
4. Enable Bar Coloring (Default: True)
Toggles whether each price bar is colored to indicate bullish, bearish, or neutral conditions.
5. Enable Signals (Default: True)
When enabled, this option plots buy or sell arrows on the chart once the momentum thresholds are met.
6. Enable Standard Gradient Fill (Default: False)
Activates ATR-based gradient fills around the trend line to visualize potential support and resistance zones.
7. Enable Fading Gradient Fill (Default: True)
Draws a gradual color transition between the trend line and the current price, emphasizing their divergence.
8. Trading Mode (Options: Scalp, Swing, Position)
Determines which smoothing method and ATR period to use, adapting the indicator’s behavior to short-term, medium-term, or long-term trading.
9. Table Position Inputs
Allows users to select from nine possible chart positions (top, middle, bottom; left, center, right) for each data table.
10. Show Table Booleans
Separate toggles control the display of each table (Insider Info, Indicator Metrics, Market Analysis, and the three Deep Tables), enabling a customized view of the data.
Color Schemes
(Default) - The colors in the preview image of the indicator.
(Emerald)
(Sapphire)
(Golden Blaze)
(Mystic)
(Monochrome)
(Pastel)
(Vibrant)
(Earth)
(Neon)
Calculations
1. Trend Line Methods
- Scalp Mode: Utilizes the Hull Moving Average (HMA), which computes two weighted moving averages (one at half the length and one at full length), subtracts them, and then applies a final weighted average based on the square root of the length. This method minimizes lag and increases responsiveness.
- Swing Mode: Uses the Exponential Moving Average (EMA), which assigns greater weight to recent prices, thus balancing quick reaction with smoothness.
- Position Mode: Applies the Weighted Moving Average (WMA) to focus on longer-term trends by emphasizing the entire lookback period and reducing the impact of short-term volatility.
2. Momentum Tracking
The indicator maintains separate counters for bullish and bearish momentum. These counters increase as the trend confirms directional movement and reset when the trend reverses. When a counter exceeds the defined signal strength threshold, a corresponding signal (buy or sell) is triggered.
3. Volatility and ATR Zones
The Average True Range (ATR) is calculated using a period that adapts to the selected trading mode (shorter for Scalp, longer for Position). The ATR value is then used to define upper and lower zones around the trend line, highlighting the current level of market volatility.
4. Return and Trend Acceleration
- Return is calculated as the difference between the current and previous closing prices, providing a simple measure of price change.
- Trend Acceleration is derived from the change in the trend line’s movement (its first derivative) compared to the previous bar. This metric indicates whether the trend is gaining or losing momentum.
5. Sortino Ratio and Standard Deviation
- The Sortino Ratio measures risk-adjusted performance by comparing returns to downside volatility (only considering negative price changes).
- Standard Deviation is computed over the lookback period to assess the extent of price fluctuations, offering insights into market stability.
Usage
This indicator is suitable for various time frames and market instruments. Traders can enable or disable specific visual elements such as gradient fills, bar coloring, and signal markers based on their preference. For a minimalist approach, one might choose to display only the primary trend line. For a deeper analysis, enabling multiple tables can provide extensive data on momentum, volatility, trend dynamics, and risk metrics.
Important Note on Risk
Trading involves inherent risk, and no indicator can eliminate the uncertainty of the markets. Past performance is not indicative of future results. It is essential to use proper risk management, test any new tool thoroughly, and consult multiple sources or professional advice before making trading decisions.
Conclusion
Uptrick: Alpha Trend unifies a diverse set of calculations, adaptive smoothing techniques, and customizable visual elements into one powerful tool. By combining the Hull, Exponential, and Weighted Moving Averages, the indicator is able to provide a trend line that is both responsive and smooth, depending on the trading mode. Its advanced color schemes, gradient fills, and detailed data tables deliver a comprehensive analysis of market trends, momentum, and risk. Whether you are a short-term trader or a long-term investor, this indicator aims to clarify price action and assist you in making more informed trading decisions.

Uptrick: FRAMA Matrix RSIUptrick: FRAMA Matrix RSI
Introduction
The Uptrick: FRAMA Matrix RSI is a momentum-based indicator that integrates the Relative Strength Index (RSI) with the Fractal Adaptive Moving Average (FRAMA). By applying FRAMA's adaptive smoothing to RSI—and further refining it with a Zero-Lag Moving Average (ZLMA)—this script creates a refined and reliable momentum oscillator. The indicator now includes enhanced divergence detection, potential reversal signals, customizable buy/sell signal options, an internal stats table, and a fully customizable bar coloring system for an enhanced visual trading experience.
Why Combine RSI with FRAMA
Traditional RSI is a well-known momentum indicator but has several limitations. It is highly sensitive to price fluctuations, often generating false signals in choppy or volatile markets. FRAMA, in contrast, adapts dynamically to price changes by adjusting its smoothing factor based on market conditions.
By integrating FRAMA into RSI calculations, this indicator reduces noise while preserving RSI's ability to track momentum, adapts to volatility by reducing lag in trending markets and smoothing out choppiness in ranging conditions, enhances trend-following capability for more reliable momentum shifts, and refines overbought and oversold signals by adjusting to the current market structure.
With the new enhancements, such as a manual alpha input, noise filtering, divergence detection, and multiple buy/sell signal options, the indicator offers even greater flexibility and precision for traders. This combination improves the standard RSI by making it more adaptive and responsive to market changes.
Originality
This indicator is unique because it applies FRAMA's adaptive smoothing technique to RSI, creating a dynamic momentum oscillator that adjusts to different market conditions. Many traditional RSI-based indicators either use fixed smoothing methods like exponential moving averages or employ basic RSI calculations without adjusting for volatility.
This script stands out by integrating several elements, including the fractal dimension-based smoothing of FRAMA to reduce noise while retaining responsiveness, the use of Zero-Lag Moving Average smoothing to enhance trend sensitivity and reduce lag, divergence detection to highlight mismatches between price action and RSI momentum, a noise filter and manual alpha option to prevent minor fluctuations from generating false signals, customizable buy/sell signal options that let traders choose between ZLMA-based or FRAMA RSI-based signals, an internal stats table displaying real-time FRAMA calculations such as fractal dimension and the adaptive alpha factor, and a fully customizable bar coloring system to visually distinguish bullish, bearish, and neutral conditions.
Features
Adaptive FRAMA RSI
The indicator applies FRAMA to RSI values, making the momentum oscillator adaptive to volatility while filtering out noise. Unlike a traditional RSI that reacts equally to all price movements, FRAMA RSI adjusts its smoothing factor based on market structure, making it more effective for identifying true momentum shifts.
Zero-Lag Moving Average (ZLMA)
A smoothing technique that minimizes lag while preserving the responsiveness of price movements. It is applied to the FRAMA RSI to further refine signals and ensure smoother trend detection.
Bullish and Bearish Threshold Crossovers
This system compares FRAMA RSI to a user-defined threshold (default is 50). When FRAMA RSI moves above the threshold, it indicates bullish momentum, while movement below signals bearish conditions. The enhanced noise filter ensures that only significant moves trigger signals.
Noise Filter and Manual Alpha
A new noise filter input prevents tiny fluctuations from triggering false signals. In addition, a manual alpha option allows traders to override the automatically computed smoothing factor with a custom value, providing extra control over the indicator’s sensitivity.
Divergence Detection
The indicator identifies divergence patterns by comparing FRAMA RSI pivots to price action. Bullish divergence occurs when price makes a lower low while FRAMA RSI makes a higher low, and bearish divergence occurs when price makes a higher high while FRAMA RSI makes a lower high. These signals can help traders anticipate potential reversals.
Reversal Signals
Labels appear on the chart when FRAMA RSI confirms classic RSI overbought (70) or oversold (30) conditions, providing visual cues for potential trend reversals.
Buy and Sell Signal Options
Traders can now choose between two signal-generation methods. ZLMA-based signals trigger when the ZLMA of FRAMA RSI crosses key overbought (70) or oversold (30) levels, while FRAMA RSI-based signals trigger when FRAMA RSI itself crosses these levels. This added flexibility allows users to tailor the indicator to their preferred trading style.
ZLMA:
FRAMA:
Customizable Alerts
Alerts notify traders when FRAMA RSI crosses key levels, divergence signals occur, reversal conditions are met, or buy/sell signals trigger. This ensures that important trading events are not missed.
Fully Customizable Bar Coloring System
Users can color bars based on different conditions, enhancing visual clarity. Bar coloring modes include: FRAMA RSI threshold (bars change color based on whether FRAMA RSI is above or below the threshold), ZLMA crossover (bars change when ZLMA crosses overbought or oversold levels), buy/sell signals (bars change when official signals trigger), divergence (bars highlight when bullish or bearish divergence is detected), and reversals (bars indicate when RSI reaches overbought or oversold conditions confirmed by FRAMA RSI). The system also remembers the last applied bar color, ensuring a smooth visual transition.
Input Parameters and Features
Core Inputs
RSI Length (default: 14) defines the period for RSI calculations.
FRAMA Lookback (default: 16) determines the length for the FRAMA smoothing function.
RSI Bull Threshold (default: 50) sets the level above which the market is considered bullish and below which it is bearish.
Noise Filter (default: 1.0) ensures that small fluctuations do not trigger false bullish or bearish signals.
Additional Features
Show Bull and Bear Alerts (default: true) enables notifications when FRAMA RSI crosses the threshold.
Enable Divergence Detection (default: false) highlights bullish and bearish divergences based on price and FRAMA RSI pivots.
Show Potential Reversal Signals (default: false) identifies overbought (70) and oversold (30) levels as possible trend reversal points.
Buy and Sell Signal Option (default: ZLMA) allows traders to choose between ZLMA-based signals or FRAMA RSI-based signals for trade entry.
ZLMA Enhancements
ZLMA Length (default: 14) determines the period for the Zero-Lag Moving Average applied to FRAMA RSI.
Visualization Options
Show Internal Stats Table (default: false) displays real-time FRAMA calculations, including fractal dimension and the adaptive alpha smoothing factor.
Show Threshold FRAMA Signals (default: false) plots buy and sell labels when FRAMA RSI crosses the threshold level.
How It Works
FRAMA Calculation
FRAMA dynamically adjusts smoothing based on the price fractal dimension. The alpha smoothing factor is derived from the fractal dimension or can be set manually to maintain responsiveness.
RSI with FRAMA Smoothing
RSI is calculated using the user-defined lookback period. FRAMA is then applied to the RSI to make it more adaptive to volatility. Optionally, ZLMA is applied to further refine the signals and reduce lag.
Bullish and Bearish Threshold Crosses
A bullish condition occurs when FRAMA RSI crosses above the threshold, while a bearish condition occurs when it falls below. The noise filter ensures that only significant trend shifts generate signals.
Buy and Sell Signal Options
Traders can choose between ZLMA crossovers or FRAMA RSI crossovers as the basis for buy and sell signals, offering flexibility in trade entry timing.
Divergence Detection
The indicator identifies divergences where price action and FRAMA RSI momentum do not align, potentially signaling upcoming reversals.
Reversal Signal Labels
When classic RSI overbought or oversold levels are confirmed by FRAMA RSI conditions, reversal labels are added on the chart to highlight potential exhaustion points.
Bar Coloring System
Bars are dynamically colored based on various conditions such as RSI thresholds, ZLMA crossovers, buy/sell signals, divergence, and reversals, allowing traders to quickly interpret market sentiment.
Alerts and Internal Stats
Customizable alerts notify traders of key events, and an optional internal stats table displays real-time calculations (fractal dimension, alpha value, and RSI values) to help users understand the underlying dynamics of the indicator.
Summary
The Uptrick: FRAMA Matrix RSI offers an enhanced approach to momentum analysis by combining RSI with adaptive FRAMA smoothing and additional layers of signal refinement. The indicator now includes adaptive RSI smoothing to reduce noise and improve responsiveness, Zero-Lag Moving Average filtering to minimize lag, divergence and reversal detection to identify potential turning points, customizable buy/sell signal options that let traders choose between different signal methodologies, a fully customizable bar coloring system to visually distinguish market conditions, and an internal stats table for real-time insight into FRAMA calculation parameters.
Whether used for trend confirmation, divergence detection, or momentum-based strategies, this indicator provides a powerful and adaptive approach to trading.
Disclaimer
This script is for informational and educational purposes only. Trading involves risk, and past performance does not guarantee future results. Always conduct proper research and consult with a financial advisor before making trading decisions.

Uptrick: Momentum Channel Indicator
### 🌟 **Uptrick: Momentum Channel Indicator (MC_Ind)** 🌟
The **"Uptrick: Momentum Channel Indicator"** is a powerful tool designed to help traders gauge market momentum and identify potential overbought or oversold conditions. Whether you're a day trader, swing trader, or long-term investor, this indicator can be your compass 🧭 in the complex world of trading.
### 🎯 **Purpose of the Indicator**
The primary goal of the **Momentum Channel Indicator** is to measure the deviation of price from its moving average (the mid-point) and to smooth this deviation to identify momentum shifts. By plotting overbought and oversold levels, the indicator helps traders spot potential reversal points where the market might change direction, offering valuable entry or exit signals.
### 🔧 **Inputs & Parameters**
Let's break down the input parameters that you can adjust to tailor the indicator to your trading style:
1. **`length1` (Channel Length) 📏**: This is the period over which the moving average (mid-point) and price deviation are calculated. The default value is 14, meaning the last 14 bars are considered for calculations.
2. **`length2` (Smoothing Length) 🧘**: This parameter controls the smoothing of the channel index, with a default value of 28. The higher the value, the smoother the momentum line, reducing noise and making trends more visible.
3. **`overbought1` & `overbought2` (Overbought Levels) 🔴**: These levels, set at 70 and 65 by default, represent the threshold above which the market is considered overbought, potentially signaling a selling opportunity.
4. **`oversold1` & `oversold2` (Oversold Levels) 🟢**: Similarly, these levels, set at -70 and -65, mark the threshold below which the market is considered oversold, indicating a potential buying opportunity.
### 🛠️ **How the Indicator Works**
Now, let's dive into the mechanics of the Momentum Channel Indicator:
1. **Mid-Point Calculation 🏁**: The mid-point is calculated using a simple moving average (SMA) of the closing prices over the `length1` period. This mid-point acts as a reference line from which deviations are measured.
2. **Price Deviation 📊**: The price deviation is the absolute difference between the closing price and the mid-point, smoothed over the same period (`length1`). This represents the typical price movement away from the mid-point.
3. **Channel Index 📉**: The channel index is calculated by dividing the price deviation by a fraction (0.01) of the mid-point, providing a normalized measure of how far the price has deviated from the average.
4. **Smoothing of the Channel Index 🌊**: The smoothed index (`mci1`) is calculated by applying a smoothing filter (SMA) over the channel index using the `length2` parameter. This helps reduce noise and highlight the true momentum of the market.
5. **Momentum Lines 📈**:
- **`mci1`**: The main momentum line, representing the smoothed channel index.
- **`mci2`**: A secondary momentum line, which is a further smoothed version of `mci1` using a 6-period SMA.
6. **Signal Lines 🚦**:
- **Overbought & Oversold Levels**: Horizontal lines plotted at `overbought1`, `overbought2`, `oversold1`, and `oversold2` levels serve as visual cues for overbought and oversold conditions.
- **Zero Line**: A central reference line at 0, indicating neutral momentum.
### 📈 **How to Use the Indicator**
#### 1. **Day Traders ⚡**
For day traders, the Momentum Channel Indicator can be a quick signal generator for short-term trades. Here's how you can use it:
- **Identify Entry Points 🎯**: Look for a **bullish crossover** when `mci1` crosses above `mci2` from below the `oversold1` level. This signals a potential upward reversal.
- **Spot Exit Points 🏁**: Watch for a **bearish crossunder** when `mci1` crosses below `mci2` from above the `overbought1` level. This could indicate a downward reversal.
- **Scalping 🔄**: In a fast-moving market, use the indicator to scalp by entering and exiting trades at these crossover points, with a tight stop-loss strategy.
#### 2. **Swing Traders 🎢**
Swing traders benefit from using the Momentum Channel Indicator to identify potential reversal points over a longer period:
- **Trend Confirmation 📊**: Use the smoothing effect of `mci2` to confirm trends. If `mci2` remains consistently above 0, it indicates a strong bullish trend, and vice versa.
- **Overbought/Oversold Reversals 🚀**: Enter trades when the price approaches the overbought or oversold levels (`overbought1`, `oversold1`). Combine this with other indicators, such as RSI, for more reliable signals.
- **Hold Positions 🧗**: Let the momentum lines guide your hold strategy. If the momentum lines stay aligned (both `mci1` and `mci2` are moving in the same direction), consider holding the position until a crossover or reversal signal appears.
#### 3. **Long-Term Investors 🏦**
For long-term investors, the Momentum Channel Indicator helps in fine-tuning entry and exit points based on broader market momentum:
- **Divergence Analysis 📐**: Look for divergence between the price and the momentum lines. If the price makes new highs but the momentum lines do not, it could signal a weakening trend and a potential reversal.
- **Strategic Entry/Exit 🏹**: Use the `overbought2` and `oversold2` levels to strategically enter or exit positions. These secondary levels provide an early warning before the market reaches extreme conditions.
- **Risk Management 🛡️**: The indicator can also be used as part of a risk management strategy by identifying when to reduce exposure in overbought markets or increase exposure in oversold markets.
### 🖼️ **Visualization & Interpretation**
The Momentum Channel Indicator is visually intuitive, with each component providing key insights:
1. **Momentum Lines (MCI1 & MCI2) 📈**:
- **Blue Line (`mci1`)**: Represents the main momentum line, providing immediate insights into market direction.
- **Orange Line (`mci2`)**: A secondary momentum line, further smoothed to confirm trends.
2. **Overbought/Oversold Levels 🔴🟢**:
- **Solid & Dashed Lines**: These lines highlight overbought and oversold regions, guiding traders on when to consider entering or exiting trades.
3. **MCI Difference (Purple Area) 🌌**:
- **Shaded Area**: The difference between `mci1` and `mci2`, shaded in purple, helps visualize the strength of the momentum. The larger the shaded area, the stronger the momentum.
### 🚀 **Advanced Tips & Tricks**
For those looking to maximize the potential of the Momentum Channel Indicator, here are some advanced strategies:
1. **Combine with Volume Indicators 📊**: Use volume indicators like OBV (On-Balance Volume) or Volume Oscillator to confirm momentum signals. For instance, a bullish crossover combined with increasing volume can reinforce a buy signal.
2. **Multiple Timeframe Analysis 🕒**: Apply the Momentum Channel Indicator across multiple timeframes (e.g., daily and weekly) to get a more comprehensive view of the market. This can help in aligning short-term trades with long-term trends.
3. **Adjusting Parameters 🔄**: Depending on market conditions, tweak the `length1` and `length2` parameters. In a highly volatile market, shorter lengths might provide quicker signals, whereas in a stable market, longer lengths could smooth out noise.
4. **Divergence & Convergence 📐**: Watch for divergence between price and momentum lines as a leading indicator of potential reversals. Convergence (when the price and momentum move in sync) can confirm the strength of the trend.
### **Conclusion**
The **Uptrick: Momentum Channel Indicator** is a versatile tool that can be customized for various trading styles and market conditions. Whether you're trading in fast-paced environments or analyzing long-term trends, this indicator offers a clear and intuitive way to gauge market momentum, identify potential reversals, and make informed trading decisions.
By understanding and applying the principles outlined above, you can harness the full power of this indicator, transforming your trading strategy from good to great! 🌟

Uptrick: MultiTrend Squeeze System**Uptrick: MultiTrend Squeeze System Indicator: The Ultimate Trading Tool for Precision and Versatility 📈🔥**
### Introduction
The MultiTrend Squeeze System is a powerful, multi-faceted trading indicator designed to provide traders with precise buy and sell signals by combining the strengths of multiple technical analysis tools. This script isn't just an indicator; it's a comprehensive trading system that merges the power of SuperTrend, RSI, Volume Filtering, and Squeeze Momentum to give you an unparalleled edge in the market. Whether you're a day trader looking for short-term opportunities or a swing trader aiming to catch longer-term trends, this indicator is tailored to meet your needs.
### Key Features and Unique Aspects
1. **SuperTrend with Dynamic Adjustments 📊**
- **Adaptive SuperTrend Calculation:** The SuperTrend is a popular trend-following indicator that adjusts dynamically based on market conditions. It uses the Average True Range (ATR) to calculate upper and lower bands, which shift according to market volatility. This script takes it further by combining it with the RSI and Volume filtering to provide more accurate signals.
- **Direction Sensitivity:** The SuperTrend here is not static. It adjusts based on the direction of the previous SuperTrend value, ensuring that the indicator remains relevant even in choppy markets.
2. **RSI Integration for Overbought/Oversold Conditions 💹**
- **RSI Calculation:** The Relative Strength Index (RSI) is incorporated to identify overbought and oversold conditions, adding an extra layer of precision. This helps in filtering out false signals and ensuring that trades are taken only in optimal conditions.
- **Customizable RSI Settings:** The RSI settings are fully customizable, allowing traders to adjust the RSI length and the overbought/oversold levels according to their trading style and market.
3. **Volume Filtering for Enhanced Signal Confirmation 📉**
- **Volume Multiplier:** This unique feature integrates volume analysis, ensuring that signals are only generated when there is sufficient market participation. The Volume Multiplier can be adjusted to filter out weak signals that occur during low-volume periods.
- **Optional Volume Filtering:** Traders have the flexibility to turn the volume filter on or off, depending on their preference or market conditions. This makes the indicator versatile, allowing it to be used across different asset classes and market conditions.
4. **Squeeze Momentum Indicator (SMI) for Market Pressure Analysis 💥**
- **Squeeze Detection:** The Squeeze Momentum Indicator detects periods of market compression and expansion. This script goes beyond the traditional Bollinger Bands and Keltner Channels by incorporating true range calculations, offering a more nuanced view of market momentum.
- **Customizable Squeeze Settings:** The lengths and multipliers for both Bollinger Bands and Keltner Channels are customizable, giving traders the flexibility to fine-tune the indicator based on their specific needs.
5. **Visual and Aesthetic Customization 🎨**
- **Color-Coding for Clarity:** The indicator is color-coded to make it easy to interpret signals. Bullish trends are marked with a vibrant green color, while bearish trends are highlighted in red. Neutral or unconfirmed signals are displayed in softer tones to reduce noise.
- **Histogram Visualization:** The primary trend direction and strength are displayed as a histogram, making it easy to visualize the market's momentum at a glance. The height and color of the bars provide immediate feedback on the strength and direction of the trend.
6. **Alerts for Real-Time Trading 🚨**
- **Custom Alerts:** The script is equipped with custom alerts that notify traders when a buy or sell signal is generated. These alerts can be configured to send notifications through various channels, including email, SMS, or directly to the trading platform.
- **Immediate Reaction:** The alerts are triggered based on the confluence of SuperTrend, RSI, and Volume signals, ensuring that traders are notified only when the most robust trading opportunities arise.
7. **Comprehensive Input Customization ⚙️**
- **SuperTrend Settings:** Adjust the ATR length and factor to control the sensitivity of the SuperTrend. This allows you to adapt the indicator to different market conditions, whether you're trading a volatile cryptocurrency or a more stable stock.
- **RSI Settings:** Customize the RSI length and thresholds for overbought and oversold conditions, enabling you to tailor the indicator to your specific trading strategy.
- **Volume Settings:** The Volume Multiplier and the option to toggle the volume filter provide an additional layer of customization, allowing you to fine-tune the indicator based on market liquidity and participation.
- **Squeeze Momentum Settings:** The lengths and multipliers for Bollinger Bands and Keltner Channels can be adjusted to detect different levels of market compression, providing flexibility for both short-term and long-term traders.
### How It Works: A Deep Dive Into the Mechanics 🛠️
1. **SuperTrend Calculation:**
- The SuperTrend is calculated using the ATR, which measures market volatility. The indicator creates upper and lower bands around the price, adjusting these bands based on the current level of market volatility. The direction of the trend is determined by the position of the price relative to these bands.
- The script enhances the standard SuperTrend by ensuring that the bands do not flip-flop too quickly, reducing the chances of false signals in a choppy market. The direction is confirmed by checking the position of the close relative to the previous band, making the trend detection more reliable.
2. **RSI Integration:**
- The RSI is calculated over a customizable length and compared to user-defined overbought and oversold levels. When the RSI crosses below the oversold level, and the SuperTrend indicates a bullish trend, a buy signal is generated. Conversely, when the RSI crosses above the overbought level, and the SuperTrend indicates a bearish trend, a sell signal is triggered.
- The combination of RSI with SuperTrend ensures that trades are only taken when there is a strong confluence of signals, reducing the chances of entering trades during weak or indecisive market phases.
3. **Volume Filtering:**
- The script calculates the average volume over a 20-period simple moving average. The volume filter ensures that buy and sell signals are only valid when the current volume exceeds a multiple of this average, which can be adjusted by the user. This feature helps filter out weak signals that might occur during low-volume periods, such as just before a major news event or during after-hours trading.
- The volume filter is particularly useful in markets where volume spikes are common, as it ensures that signals are only generated when there is significant market interest in the direction of the trend.
4. **Squeeze Momentum:**
- The Squeeze Momentum Indicator (SMI) adds a layer of market pressure analysis. The script calculates Bollinger Bands and Keltner Channels, detecting when the market is in a "squeeze" — a period of low volatility that typically precedes a significant price move.
- When the Bollinger Bands are inside the Keltner Channels, the market is in a squeeze (compression phase). This is often a precursor to a breakout or breakdown. The script colors the histogram bars black during this phase, indicating a potential for a strong move. Once the squeeze is released, the bars are colored according to the direction of the SuperTrend, signaling a potential entry point.
5. **Integration and Signal Generation:**
- The script brings together the SuperTrend, RSI, Volume, and Squeeze Momentum to generate highly accurate buy and sell signals. A buy signal is triggered when the SuperTrend is bullish, the RSI indicates oversold conditions, and the volume filter confirms strong market participation. Similarly, a sell signal is generated when the SuperTrend is bearish, the RSI indicates overbought conditions, and the volume filter is met.
- The combination of these elements ensures that the signals are robust, reducing the likelihood of entering trades during weak or indecisive market conditions.
### Practical Applications: How to Use the MultiTrend Squeeze System 📅
1. **Day Trading:**
- For day traders, this indicator provides quick and reliable signals that can be used to enter and exit trades multiple times within a day. The volume filter ensures that you are trading during the most liquid times of the day, increasing the chances of successful trades. The Squeeze Momentum aspect helps you catch breakouts or breakdowns, which are common in intraday trading.
2. **Swing Trading:**
- Swing traders can use the MultiTrend Squeeze System to identify longer-term trends. By adjusting the ATR length and factor, you can make the SuperTrend more sensitive to catch longer-term moves. The RSI and Squeeze Momentum aspects help you time your entries and exits, ensuring that you get in early on a trend and exit before it reverses.
3. **Scalping:**
- For scalpers, the quick signals provided by this system, especially in combination with the volume filter, make it easier to take small profits repeatedly. The histogram bars give you a clear visual cue of the market's momentum, making it easier to scalp effectively.
4. **Position Trading:**
- Even position traders can benefit from this indicator by using it to confirm long-term trends. By adjusting the settings to less sensitive parameters, you can ensure that you are only entering trades when a strong trend is confirmed. The Squeeze Momentum indicator will help you stay in the trade during periods of consolidation, waiting for the next big move.
### Conclusion: Why the MultiTrend Squeeze System is a Game-Changer 🚀
The MultiTrend Squeeze System is not just another trading indicator; it’s a comprehensive trading strategy encapsulated within a single script. By combining the power
of SuperTrend, RSI, Volume Filtering, and Squeeze Momentum, this indicator provides a robust and versatile tool that can be adapted to various trading styles and market conditions.
**Why is it Unique?**
- **Multi-Dimensional Analysis:** Unlike many other indicators that rely on a single data point or calculation, this script incorporates multiple layers of analysis, ensuring that signals are based on a confluence of factors, which increases their reliability.
- **Customizability:** The vast range of input settings allows traders to tailor the indicator to their specific needs, whether they are trading forex, stocks, cryptocurrencies, or commodities.
- **Visual Clarity:** The color-coded bars, labels, and signals make it easy to interpret the market conditions at a glance, reducing the time needed to make trading decisions.
Whether you are a novice trader or an experienced market participant, the MultiTrend Squeeze System offers a powerful toolset to enhance your trading strategy, reduce risk, and maximize your potential returns. With its combination of trend analysis, momentum detection, and volume filtering, this indicator is designed to help you trade with confidence and precision in any market condition.

Uptrick: Adaptive Cloud Oscillator (ACO)### **Uptrick: Adaptive Cloud Oscillator (ACO)**
---
### Introduction
The **Uptrick: Adaptive Cloud Oscillator (ACO)** is an advanced technical analysis tool designed to empower traders with precise trend detection and visual clarity in dynamic market conditions. By seamlessly integrating adaptive trend analysis, volatility filtering, and cloud-based support and resistance levels, the ACO provides traders with the actionable insights needed to navigate complex markets with confidence.
This indicator is highly customizable, allowing traders to tailor its functionality to their specific trading style and preferences. Whether you're a trend follower, swing trader, or looking to identify key support and resistance zones, the **Uptrick: ACO** is an indispensable tool that can adapt to a variety of market conditions.
### Indicator Purpose and Functionality
#### 1. **Adaptive Trend Detection**
At the heart of the **Uptrick: ACO** lies its adaptive trend detection algorithm. Unlike traditional moving averages that may lag in volatile markets or react too slowly to rapid changes, this adaptive method uses a smoothing technique that dynamically adjusts based on market conditions. By doing so, it provides a more responsive trend line that captures meaningful price movements while filtering out minor fluctuations.
- **How It Works:** The trend line is calculated using an adaptive smoothing factor, making it responsive to recent price actions while maintaining a level of stability that prevents whipsaw signals. This ensures that traders are always in tune with the prevailing market trend, whether bullish, bearish, or neutral.
#### 2. **Dynamic Cloud Support and Resistance**
The **Uptrick: ACO** features a dynamic "cloud" that serves as a key element in its analysis. This cloud is constructed using a moving average combined with the Average True Range (ATR), which adjusts based on the market’s volatility. The cloud provides dynamic support and resistance levels, essential for identifying potential reversal zones or confirming trend continuations.
- **Cloud Displacement:** The cloud is displaced forward by a user-defined number of bars, offering a predictive view of where future support and resistance levels may lie. This forward-looking feature helps traders anticipate potential price movements, making the ACO a powerful tool for planning trades ahead of time.
#### 3. **Versatile Visualization Options**
The **Uptrick: ACO** is designed with flexibility in mind, allowing users to choose between two distinct display modes:
- **Buy/Sell Signals:** In this mode, the indicator generates clear buy and sell signals based on crossovers of the trend line and the cloud boundaries. These signals are visualized directly on the chart with up and down labels, making it easy for traders to identify potential entry and exit points.
- **Cloud Fill Only:** For traders who prefer a cleaner chart, this mode removes the buy/sell signals and instead focuses on coloring the area between the upper and lower cloud boundaries. The color of the cloud fill changes based on the trend direction, providing a visual representation of the market's momentum.
- **Optional EMA Line:** An Exponential Moving Average (EMA) line can be optionally displayed on the chart. The EMA serves as an additional trend filter, helping traders further refine their entries and exits. The length, color, and thickness of the EMA are fully customizable to fit individual trading strategies.
### Practical Applications
#### 1. **Trend Following and Reversals**
The **Uptrick: ACO** excels in identifying and following trends. By analyzing the relationship between the trend line and the cloud, traders can determine the strength and direction of the current market trend. The cloud’s dynamic nature means it can adapt to both trending and ranging markets, providing consistent insights regardless of market conditions.
- **Example:** If the trend line crosses above the upper cloud boundary, it signals a potential buy opportunity. Conversely, a cross below the lower cloud boundary suggests a sell opportunity. Traders can use these signals to enter trades aligned with the prevailing trend.
#### 2. **Support and Resistance Identification**
The forward-displaced cloud acts as a predictive support and resistance zone. Traders can use these zones to set stop-loss levels, determine take-profit targets, or identify potential reversal points.
- **Example:** When the price approaches the upper cloud boundary from below, the boundary may act as resistance, indicating a potential reversal or pullback. If the price breaks through this level, it may signal a continuation of the bullish trend.
#### 3. **Volatility-Based Analysis**
By incorporating ATR into its calculations, the **Uptrick: ACO** provides a built-in mechanism to adapt to varying levels of market volatility. This makes it particularly useful in markets prone to sudden spikes in volatility, such as during major economic announcements or geopolitical events.
- **Example:** In a high-volatility environment, the cloud widens, allowing for greater price fluctuations within the trend. Traders can use this information to adjust their risk management strategies, such as widening stop-loss levels during volatile periods to avoid being stopped out prematurely.
### Customization and Flexibility
The **Uptrick: ACO** is designed to be highly customizable, ensuring it can meet the needs of traders with different strategies and preferences. Key customization options include:
- **Cloud and Trend Settings:** Traders can adjust the length of the cloud, the smoothing factor for the trend line, and the displacement of the cloud to optimize the indicator for their specific market and timeframe.
- **Display Modes:** With a simple dropdown selection, traders can choose whether to display buy/sell signals or focus solely on the cloud fill, providing flexibility in how the indicator is visualized.
- **Color and Style Customization:** The colors for bullish and bearish trends, cloud fill, buy/sell signals, and the EMA line can all be customized, allowing traders to integrate the **Uptrick: ACO** seamlessly into their existing chart setups.
### Conclusion
The **Uptrick: Adaptive Cloud Oscillator (ACO)** is more than just a trend indicator—it's a comprehensive market analysis tool that provides traders with a deep understanding of market dynamics. Its combination of adaptive trend analysis, dynamic support and resistance levels, and versatile visualization options makes it an essential tool for traders looking to gain an edge in any market environment.
Whether you're a seasoned trader or just starting, the **Uptrick: ACO** offers the insights and flexibility needed to make informed trading decisions. By helping you identify trends, anticipate reversals, and adapt to changing market conditions, the **Uptrick: ACO** can significantly enhance your trading strategy and improve your overall trading performance.

Uptrick: Adaptive Trend Strength Index (ATSI)### **Adaptive Trend Strength Index (ATSI): Trend Detection Tool**
---
### Introduction
The **Adaptive Trend Strength Index (ATSI)** is a state-of-the-art indicator designed to offer traders an unparalleled view into market trends. By combining the principles of adaptive trend analysis with advanced volatility filtering, ATSI provides a powerful and visually intuitive method for identifying and following market trends. Its unique algorithm and customizable features make it an essential tool for traders across all markets—whether you're trading stocks, forex, commodities, or cryptocurrencies.
### The Purpose and Design Philosophy
At its core, the ATSI was built with the understanding that financial markets are dynamic, ever-changing entities influenced by a multitude of factors, including market sentiment, economic data, geopolitical events, and, critically, volatility. Traditional trend indicators often fall short by either over-smoothing price data (thus lagging behind the actual trend) or reacting too quickly to minor price fluctuations, resulting in false signals.
**ATSI solves this dilemma by adapting to market conditions in real-time.** It effectively filters out market noise while being sensitive enough to detect meaningful shifts in trend direction. The result is a trend line that is both responsive and smooth, providing traders with a clear, actionable view of the market's current trajectory.
### Key Features and Functionality
#### 1. **Adaptive Trend Calculation**
The heart of ATSI is its adaptive trend algorithm, which adjusts based on market conditions. It leverages a combination of price action analysis and volatility filtering to determine the strength and direction of the trend. Here’s how it works:
- **Volatility Sensitivity:** ATSI incorporates the Average True Range (ATR) to measure market volatility. This volatility measure is then adjusted by a user-defined sensitivity factor. This ensures that the indicator responds dynamically to different market environments—be it high-volatility breakouts or low-volatility consolidations.
- **Adaptive Smoothing:** The trend calculation is further enhanced by an exponential moving average (EMA) applied not just to the raw price data, but also to the resulting trend line itself. This dual-layer smoothing process helps to eliminate noise, resulting in a cleaner and more reliable trend line.
- **Real-Time Adaptation:** Unlike rigid indicators that require constant tweaking to stay relevant in changing market conditions, ATSI adapts in real-time. This adaptability makes it particularly valuable in fast-moving markets where conditions can change rapidly.
#### 2. **Visual Clarity**
In trading, visual clarity can make the difference between spotting a lucrative trend and missing out. ATSI excels in this regard by offering a clear, color-coded trend line that provides instant feedback on market conditions:
- **Thicker and Smoother Line:** ATSI’s trend line is designed to be visually prominent. By default, it is thicker than most standard indicators, making it easy to spot even in dense charts. Additionally, the smoothing applied to the line ensures that it flows smoothly, avoiding the jagged, noisy appearance that can plague other indicators.
- **Color-Coded Trends:** The trend line changes color based on the direction and strength of the trend:
- **Green Line**: Indicates a bullish trend, suggesting upward momentum in the market.
- **Red Line**: Indicates a bearish trend, signaling downward momentum.
- **Gold Line**: Represents a neutral or weak trend, where the market is consolidating or where there is no clear direction.
This color-coding is not just for aesthetics—it’s a critical feature that allows traders to quickly assess market conditions at a glance.
#### 3. **Customizable Parameters**
ATSI is built with the understanding that every trader’s strategy is unique. Whether you’re a day trader looking for short-term trends or a swing trader interested in catching longer moves, ATSI can be tailored to fit your needs:
- **Trend Length:** The length parameter controls how much historical data is considered in the trend calculation. A shorter length will make the indicator more sensitive to recent price changes, while a longer length will smooth out short-term fluctuations, focusing on the broader trend.
- **Smoothing Factor:** This parameter controls the level of smoothing applied to the trend line. A higher smoothing factor will result in a smoother, more stable trend line, while a lower factor will make the line more responsive to quick changes in price.
- **Volatility Sensitivity:** By adjusting the volatility sensitivity, you can control how reactive the indicator is to market volatility. A higher sensitivity makes the indicator more likely to detect trends in volatile markets, while a lower sensitivity helps to filter out noise in calmer markets.
- **Line Width:** ATSI allows you to adjust the thickness of the trend line, ensuring that it stands out on your chart. This is particularly useful when trading on charts with a lot of overlays or when you need a clear, bold line to guide your trading decisions.
- **Color Customization:** The colors for bullish, bearish, and neutral trends can be fully customized to match your personal preferences or to integrate seamlessly with your existing chart setup.
### Practical Applications
ATSI is a versatile indicator that can be applied to a wide range of trading strategies. Here’s how it can enhance your trading:
#### 1. **Trend Following**
For traders who thrive on catching and riding trends, ATSI is a game-changer. Its adaptive nature ensures that you stay in the trend for as long as possible without being shaken out by minor fluctuations. The clear color-coded line makes it easy to identify when a trend starts and ends, providing clear entry and exit signals.
#### 2. **Risk Management**
One of the biggest challenges in trading is managing risk, particularly in volatile markets. ATSI’s volatility sensitivity feature helps traders adjust their strategies based on current market conditions. For example, in a high-volatility environment, the indicator will become more sensitive, allowing you to tighten your stop losses or take profits earlier. Conversely, in a low-volatility market, the indicator will smooth out minor fluctuations, reducing the risk of being stopped out prematurely.
#### 3. **Trend Reversals and Consolidations**
ATSI is also highly effective in identifying trend reversals and periods of consolidation. The neutral (gold) line indicates periods where the market is undecided, which can often precede significant moves. Recognizing these periods can help you avoid getting caught in choppy markets and position yourself for the next big move.
#### 4. **Market Timing**
Timing the market is often seen as the holy grail of trading. While no indicator can predict the future with 100% accuracy, ATSI’s real-time adaptation gives you a significant edge. By responding to changes in market conditions as they happen, ATSI helps you make timely decisions, whether you’re entering a trade, exiting a position, or adjusting your risk parameters.
### Comparative Advantage
What sets ATSI apart from other trend indicators is its combination of adaptability, visual clarity, and ease of use:
- **Adaptability:** Most trend indicators are static—they apply the same calculations regardless of market conditions. ATSI, however, adapts to the market in real-time, ensuring that it remains relevant and reliable across different market environments.
- **Visual Clarity:** The thicker, smoother, color-coded line is not just aesthetically pleasing—it’s a functional design choice that helps you quickly interpret market conditions. Whether you’re glancing at your chart or conducting an in-depth analysis, the ATSI line stands out, providing immediate insight.
- **Ease of Use:** Despite its advanced features, ATSI is incredibly easy to use. The default settings are optimized for general use, but the indicator offers a high degree of customization for those who want to tailor it to their specific trading strategy.
### Conclusion
The **Adaptive Trend Strength Index (ATSI)** is more than just another trend indicator—it’s a comprehensive tool designed to give traders an edge in today’s fast-paced, volatile markets. By combining adaptive trend analysis with advanced volatility filtering, ATSI offers a unique blend of responsiveness and reliability. Its clear, color-coded visual representation of trends makes it easy to use, even for traders who are new to technical analysis, while its customizable parameters provide the flexibility that experienced traders demand.
Whether you’re looking to ride the next big trend, manage your risk more effectively, or simply get a clearer picture of the market’s current direction, ATSI is an invaluable addition to your trading toolkit. With its cutting-edge design and powerful functionality, ATSI is poised to become the go-to indicator for traders seeking to enhance their market analysis and improve their trading outcomes.

Uptrick: FVG Market Zones**Uptrick: FVG Market Zones**
---
### Introduction
**Uptrick: FVG Market Zones** is a cutting-edge technical analysis tool designed to identify and visualize Fair Value Gaps (FVGs) within financial markets. This indicator focuses on pinpointing critical price levels where significant gaps occur, which can act as potential support and resistance zones. By integrating advanced volatility analysis and user-configurable parameters, the **Uptrick: FVG Market Zones** provides traders with a robust framework for understanding market dynamics and making informed trading decisions.
### Purpose and Functionality
The primary purpose of the **Uptrick: FVG Market Zones** indicator is to detect and highlight Fair Value Gaps, which are areas on a price chart where there is a significant price movement without any trading activity in between. These gaps can provide critical insights into market behavior, as they often indicate areas where the market has not fully accounted for the supply and demand dynamics. Traders use these zones to anticipate potential reversals, breakouts, or consolidations, making this tool highly valuable for both short-term and long-term trading strategies.
### Unique Features and Originality
The **Uptrick: FVG Market Zones** indicator is distinguished by its focus on FVGs and its ability to integrate this concept into a broader market analysis framework. Unlike other indicators that may offer generalized support and resistance levels, this tool specifically identifies and visualizes gaps based on volatility-adjusted criteria. This precision allows traders to focus on the most relevant market zones, improving their ability to anticipate market movements.
One of the standout features of this indicator is its user-configurable settings, which provide a high degree of customization. This flexibility ensures that traders can tailor the indicator to suit their specific trading style and the particular market they are analyzing. Additionally, the indicator's visualization capabilities are enhanced with customizable colors and gap-filling options, making it easier for traders to interpret and act on the information presented.
### Inputs and Configurations
**Uptrick: FVG Market Zones** comes with several user inputs that allow traders to customize the indicator's behavior and appearance. Each input plays a crucial role in determining how the indicator identifies and visualizes FVGs on the chart. Here’s a detailed breakdown of each input:
1. **FVG Analysis Period (fvgPeriod):**
- **Description:** This input determines the period over which the indicator analyzes the chart for identifying FVGs. By adjusting this value, traders can control how far back in time the indicator looks to detect significant gaps.
- **Default Value:** 25
- **Purpose:** A shorter period may focus on more recent market activity, making the indicator more sensitive to recent price movements. In contrast, a longer period allows the indicator to identify gaps that have remained unfilled for an extended time, potentially acting as stronger support or resistance levels.
2. **Analysis Mode (mode):**
- **Description:** The Analysis Mode input allows traders to choose between different methods of analyzing the chart for FVGs.
- **Options:** "Recent Gaps" and "Extended View"
- **Default Option:** "Recent Gaps"
- **Purpose:**
- **Recent Gaps:** Focuses on the latest significant gaps, providing traders with up-to-date information on the most relevant market zones.
- **Extended View:** Considers a broader range of gap patterns, which can be useful in markets where historical gaps may still influence current price action.
3. **Volatility Sensitivity (volatilityFactor):**
- **Description:** This input adjusts the sensitivity of the indicator to market volatility. It is used in calculating the threshold for identifying FVGs.
- **Default Value:** 0.3
- **Step Size:** 0.1
- **Purpose:** A higher sensitivity will cause the indicator to detect smaller gaps, which might be more frequent but less significant. Lower sensitivity focuses on larger, more impactful gaps, which are less frequent but potentially more powerful in predicting market behavior.
4. **Highlight Market Gaps (showGaps):**
- **Description:** A boolean input that determines whether the identified FVGs should be highlighted on the chart.
- **Default Value:** True
- **Purpose:** This input allows traders to toggle the visualization of FVGs. When enabled, the indicator highlights gaps using colored boxes, making them visually prominent on the chart.
5. **Bullish Highlight Color (bullColor):**
- **Description:** Sets the color used to highlight bullish FVGs (gaps that may indicate support).
- **Default Value:** #00FF7F (a shade of green)
- **Purpose:** The color choice is crucial for quickly distinguishing bullish zones from bearish ones. Green is typically associated with upward price movement, making it intuitive for traders to identify potential support areas.
6. **Bearish Highlight Color (bearColor):**
- **Description:** Sets the color used to highlight bearish FVGs (gaps that may indicate resistance).
- **Default Value:** #FF4500 (a shade of red)
- **Purpose:** Red is commonly associated with downward price movement, making it easy for traders to identify potential resistance areas. This color coding helps in quickly assessing the chart.
7. **Fill Gap Areas (fillGaps):**
- **Description:** A boolean input that determines whether the FVGs should be filled with a color on the chart.
- **Default Value:** True
- **Purpose:** Filling the gap areas provides a more solid visual cue for traders. It enhances the visibility of the gaps, making it easier to spot these zones during fast-paced trading sessions.
8. **Hidden Color (hidden):**
- **Description:** A color input that is used when certain elements should be hidden from the chart.
- **Default Value:** color.rgb(0,0,0,100) (a semi-transparent black)
- **Purpose:** This input is useful for controlling the visibility of certain plots or elements on the chart, ensuring that the indicator remains clean and uncluttered.
### Market Gap Detection
The core functionality of the **Uptrick: FVG Market Zones** indicator lies in its ability to detect Fair Value Gaps. These gaps occur when the price makes a significant jump from one level to another without any trading activity in between. The indicator uses a combination of price action analysis and volatility thresholds to identify these gaps.
- **Volatility Measurement:** The indicator begins by measuring market volatility using the Average True Range (ATR). This volatility measurement is then adjusted by the user-defined sensitivity factor, which determines the threshold for identifying significant gaps.
- **Gap Identification:** The indicator checks for instances where the current low is higher than the high two bars ago (bullish gap) or where the current high is lower than the low two bars ago (bearish gap). These conditions signify a potential FVG.
- **Gap Storage and Management:** Once a gap is identified, it is stored in an array. The indicator also manages the size of these arrays based on the selected analysis mode, ensuring that only the most relevant gaps are considered in the analysis.
### Visualization
Visualization is a key component of the **Uptrick: FVG Market Zones** indicator. By providing clear and customizable visual cues, the indicator ensures that traders can quickly and easily interpret the information it provides.
- **Gap Highlighting:** When enabled, the indicator highlights the identified FVGs on the chart using colored boxes. Bullish gaps are highlighted in green, while bearish gaps are highlighted in red. This color coding helps traders instantly recognize potential support and resistance zones.
- **Gap Filling:** The indicator can also fill the identified gaps with a semi-transparent color. This option enhances the visibility of the gaps, making them more prominent on the chart. Filled gaps are particularly useful for traders who want to keep track of these zones over multiple trading sessions.
- **Gap Averages:** The indicator calculates the average level of the identified gaps and plots these averages as lines on the chart. These lines represent the general area of support or resistance based on the detected gaps, providing traders with a reference point for setting their stop losses or profit targets.
- **Text Labels:** The indicator also labels each FVG with the text "FVG" inside the highlighted area. This feature ensures that traders can easily identify these zones even in charts with dense price action.
### Practical Applications
The **Uptrick: FVG Market Zones** indicator is versatile and can be applied to a wide range of trading strategies across different markets and timeframes. Here are a few examples of how this indicator can be used in practice:
1. **Support and Resistance Trading:**
- Traders can use the identified FVGs as dynamic support and resistance levels. By placing their trades based on these levels, they can take advantage of potential reversals or continuations at key market zones.
2. **Gap Filling Strategy:**
- Some traders focus on the concept of gap filling, where the market eventually returns to "fill" the gap created by rapid price movements. The **Uptrick: FVG Market Zones** indicator can
help identify such gaps and anticipate when the market might return to these levels.
3. **Breakout Trading:**
- The indicator can be used to identify breakouts from significant gaps. When the price moves beyond the identified FVGs, it may signal a strong trend continuation, providing an opportunity for breakout traders.
4. **Reversal Trading:**
- By monitoring the signals generated by the indicator, traders can identify potential market reversals. A sell signal after a prolonged uptrend or a buy signal after a downtrend may indicate a reversal, allowing traders to position themselves accordingly.
5. **Risk Management:**
- The average levels of the FVGs can be used to set stop-loss and take-profit levels. By aligning these levels with the FVG zones, traders can improve their risk management practices and enhance their trading discipline.
### Customization and Flexibility
One of the standout features of the **Uptrick: FVG Market Zones** indicator is its high level of customization. Traders can adjust various parameters to tailor the indicator to their specific needs and preferences.
- **Customizable Colors:** The indicator allows traders to choose their preferred colors for highlighting bullish and bearish gaps. This flexibility ensures that the indicator can be integrated seamlessly into any trading setup, regardless of the trader's color scheme preferences.
- **Adjustable Periods and Sensitivity:** By allowing traders to adjust the analysis period and volatility sensitivity, the indicator can be fine-tuned to suit different market conditions. For example, a trader might use a shorter analysis period and higher sensitivity in a volatile market, while opting for a longer period and lower sensitivity in a more stable market.
- **Toggling Visual Elements:** Traders can choose to enable or disable various visual elements of the indicator, such as gap highlighting, gap filling, and text labels. This level of control allows traders to declutter their charts and focus on the information that is most relevant to their trading strategy.
### Advantages and Benefits
The **Uptrick: FVG Market Zones** indicator offers several key advantages that make it a valuable tool for traders:
1. **Precision:** By focusing on Fair Value Gaps, the indicator provides highly precise levels of support and resistance, which are often more reliable than traditional horizontal levels.
2. **Clarity:** The clear visual representation of FVGs, along with the text labels and color coding, ensures that traders can quickly interpret the indicator's signals and incorporate them into their trading decisions.
3. **Adaptability:** The indicator's customizable settings allow it to be adapted to different markets, timeframes, and trading styles. Whether you are a day trader, swing trader, or long-term investor, this indicator can be tailored to meet your needs.
4. **Enhanced Decision-Making:** The trading signals generated by the indicator provide actionable insights that can help traders make more informed decisions. By aligning their trades with the identified FVG zones, traders can improve their chances of success.
5. **Risk Management:** The use of FVG zones as reference points for stop-loss and take-profit levels enhances risk management practices, helping traders protect their capital while maximizing their profit potential.
### Conclusion
The **Uptrick: FVG Market Zones** indicator is a powerful and versatile tool for traders seeking to enhance their market analysis and improve their trading outcomes. By focusing on Fair Value Gaps and providing a high level of customization, this indicator offers a unique blend of precision, clarity, and adaptability. Whether you are looking to identify key market zones, generate trading signals, or improve your risk management practices, the **Uptrick: FVG Market Zones** indicator is a valuable addition to any trader's toolkit.
With its innovative approach to market analysis and user-friendly design, **Uptrick: FVG Market Zones** stands out as an essential tool for traders who want to stay ahead of the market and make more informed trading decisions. Whether you are trading stocks, forex, commodities, or cryptocurrencies, this indicator provides the insights you need to navigate the markets with confidence and success.

Uptrick: Imbalance MA Trailing System
### **Overview**
The "Uptrick: Imbalance MA Trailing System" is a complex trading indicator designed to help traders identify potential bullish and bearish imbalances in the market, coupled with a trailing stop mechanism to manage trades. The indicator uses a combination of moving averages, Average True Range (ATR), and custom logic to detect trading signals and plot various levels on the chart to assist traders in making informed decisions.
### **Key Components and Functionality**
#### 1. **Inputs and Configuration**
- **Imbalance Filter (`imbalanceFilter`)**: This input sets the filter for detecting imbalances based on the difference between two price points. The value is a float and can be adjusted to fine-tune the sensitivity of imbalance detection. The default value is `0.0`, with a step size of `0.1`.
- **Moving Average Settings (`maLength1`, `maLength2`, `maColor1`, `maColor2`)**:
- `maLength1` and `maLength2` define the lengths of the two moving averages used in the indicator. By default, they are set to `50` and `200` periods, respectively.
- `maColor1` and `maColor2` specify the colors of these moving averages on the chart. The first MA is colored blue, and the second is red.
- **Take Profit and Stop Loss Settings (`displayTP`, `tpMultiplier`, `tpColor`, `displaySL`, `slMultiplier`, `slColor`)**:
- `displayTP` and `displaySL` are boolean inputs that control whether the TP and SL areas are displayed on the chart.
- `tpMultiplier` and `slMultiplier` are multipliers used to calculate the TP and SL levels relative to the detected imbalance level using the ATR value.
- `tpColor` and `slColor` define the colors of these areas. The TP area is green (with a transparency of 50), and the SL area is red (with a transparency of 50).
- **Trailing Stop Settings (`trailMultiplier`)**: This setting determines the multiplier used to calculate the trailing stop level based on the ATR value. The default multiplier is `2.5`.
- **Style Settings (`bullishColor`, `bearishColor`)**:
- `bullishColor` and `bearishColor` set the colors for bullish and bearish zones created when an imbalance is detected. The bullish zone is green, and the bearish zone is red.
- **Signal Label Size (`labelSizeOption`)**: The size of the signal labels displayed on the chart can be adjusted. The options include `Tiny`, `Small`, `Normal`, `Large`, and `Huge`. The selected size affects the visual prominence of the labels.
#### 2. **ATR Calculation (`atrValue`)**
- The ATR value is calculated using a period of 14, which is a standard setting for measuring market volatility. This value is used extensively throughout the indicator to calculate TP, SL, and trailing stop levels.
#### 3. **Imbalance Detection and Zone Creation**
- The indicator detects potential imbalances in the market by comparing certain price points, using a custom function (`imbalanceCondition`).
- **Bullish Imbalance Detection (`bullishSignal`)**:
- A bullish imbalance is detected when the low of three bars ago is higher than the high of one bar ago, and the current close is above the low of three bars ago.
- Additional conditions include checking that the current close is above the calculated average of the two moving averages (`ma1` and `ma2`), and that the imbalance exceeds the threshold set by the `imbalanceFilter`.
- **Bearish Imbalance Detection (`bearishSignal`)**:
- A bearish imbalance is detected under conditions where the low of one bar ago is higher than the high of three bars ago, and the current close is below the high of three bars ago.
- Like the bullish signal, the close must also be below the average of the two moving averages, and the imbalance must exceed the `imbalanceFilter` threshold.
- Upon detection of an imbalance (either bullish or bearish), the indicator creates a zone using `box.new` that highlights the price range of the imbalance. The box color corresponds to the bullish or bearish nature of the signal.
- The center of the imbalance range is marked with a dashed line, and a corresponding label (`🔴` for bearish and `🟢` for bullish) is placed on the chart to indicate the detected signal.
#### 4. **Take Profit and Stop Loss Calculation (`calculateTPSL`)**
- When an imbalance is detected, the indicator calculates potential TP and SL levels based on the ATR value and the respective multipliers.
- If the TP or SL areas are enabled, the indicator plots these areas as colored boxes on the chart.
- The function also tracks whether these levels are hit by subsequent price action, updating the status (`reached`) as appropriate.
#### 5. **Trailing Stop Logic (`applyTrailingStop`)**
- The trailing stop feature is a dynamic mechanism that adjusts the stop level as the price moves in the trader's favor.
- The trailing stop is calculated using the ATR value multiplied by the `trailMultiplier`.
- If the trailing stop is triggered (i.e., the price crosses the trailing stop level), the indicator marks the trade as stopped out.
#### 6. **Plotting and Visualization**
- The indicator plots the two moving averages on the chart with the specified colors and line width.
- If a trailing stop is active, it plots the trailing stop level on the chart, updating as the stop moves.
- The bar color changes based on the status of the current signal and whether the trailing stop or TP/SL levels have been hit.
### **Detailed Execution Flow**
1. **Initialization**: The indicator initializes several variables, including lines, boxes, and the current signal state. This setup ensures that the script can dynamically update these elements as new price data comes in.
2. **Moving Average Calculation**: The moving averages (`ma1` and `ma2`) are calculated using simple moving average (SMA) functions, which are foundational for many of the indicator's conditions.
3. **Imbalance Detection**: The script evaluates price action to detect potential bullish or bearish imbalances, applying filters based on the user-defined `imbalanceFilter`.
4. **Zone Creation and Labeling**: Upon detecting an imbalance, the script creates visual zones on the chart using the `box.new` function and labels the zones for easy identification.
5. **Take Profit and Stop Loss Logic**: The TP and SL areas are calculated and plotted if the relevant settings are enabled. The script continuously checks if these levels are reached as new bars form.
6. **Trailing Stop Calculation**: The script dynamically adjusts the trailing stop level based on the price movement and ATR value. The trailing stop helps lock in profits as the trade progresses.
7. **Plotting**: The moving averages, trailing stop levels, and bar colors are plotted on the chart, providing a visual representation of the indicator's signals and trade management levels.
8. **Final Checks and Updates**: The script concludes each bar's processing by updating the status of various elements, such as whether levels have been reached or if the trailing stop has been triggered.
### **Conclusion**
The "Uptrick: Imbalance MA Trailing System" is a highly versatile indicator designed for traders who want to identify market imbalances and manage their trades effectively using a combination of moving averages, ATR-based calculations, and custom logic. The indicator offers a wide range of customization options, allowing traders to adjust the sensitivity of imbalance detection, the size of the signal labels, and the visibility of various trade management levels (TP, SL, and trailing stop).
The combination of these features makes it a powerful tool for both novice and experienced traders, providing clear visual cues and robust trade management capabilities directly on the chart.

Uptrick: EMA Trend Indicator
### Overview
The goal of this script is to visually indicate on a trading chart whether all three Exponential Moving Averages (EMAs) are trending upwards (i.e., their slopes are positive). If all EMAs are trending upwards, the script will color the bars green. If not, the bars will be colored red.
### Key Concepts
1. **Exponential Moving Average (EMA)**: An EMA is a type of moving average that places more weight on recent data, making it more responsive to price changes compared to a simple moving average (SMA). In this script, we use three different EMAs with different lengths (20, 50, and 200 periods).
2. **Slope of an EMA**: The slope of an EMA refers to the direction in which the EMA is moving. If the current value of the EMA is higher than its value in the previous bar, the slope is positive (upward). Conversely, if the current value is lower than its previous value, the slope is negative (downward).
3. **Bar Color Coding**: The script changes the color of the bars on the chart to provide a visual cue:
- **Green Bars**: Indicate that all three EMAs are trending upwards.
- **Red Bars**: Indicate that one or more EMAs are not trending upwards.
### Detailed Breakdown
#### 1. Input Fields
- **EMA Lengths**: The script starts by allowing the user to input the lengths for the three EMAs. These lengths determine how many periods (e.g., days) are used to calculate each EMA.
- `ema20_length` is set to 20, meaning the first EMA uses the last 20 bars of data.
- `ema50_length` is set to 50, meaning the second EMA uses the last 50 bars of data.
- `ema200_length` is set to 200, meaning the third EMA uses the last 200 bars of data.
#### 2. EMA Calculation
- The script calculates the values of the three EMAs:
- **EMA 20**: This is calculated using the last 20 bars of closing prices.
- **EMA 50**: This is calculated using the last 50 bars of closing prices.
- **EMA 200**: This is calculated using the last 200 bars of closing prices.
These calculations result in three values for each bar on the chart, each representing the EMA value at that point in time.
#### 3. Determining EMA Slopes
- **EMA Slopes**: To understand the trend of each EMA, the script compares the current value of each EMA to its value in the previous bar:
- For the 20-period EMA, the script checks if today’s EMA value is higher than yesterday’s EMA value.
- This process is repeated for the 50-period and 200-period EMAs.
- If today’s EMA value is greater than yesterday’s value, the slope is positive (upward).
- If today’s EMA value is not greater (it is either equal to or less than yesterday’s value), the slope is not positive.
#### 4. Evaluating All Slopes
- **All Slopes Positive Condition**: The script combines the results of the individual slope checks into a single condition. It uses a logical "AND" operation:
- The condition will be `true` only if all three EMAs (20, 50, and 200) have positive slopes.
- If any one of the EMAs does not have a positive slope, the condition will be `false`.
#### 5. Coloring the Bars
- **Bar Coloring Logic**: Based on the above condition, the script decides the color of each bar on the chart:
- If all slopes are positive (condition is `true`), the bar is colored green.
- If any slope is not positive (condition is `false`), the bar is colored red.
- **Visual Cue**: This provides a quick, visual indication to traders:
- Green bars suggest that the market is in an upward trend across all three EMAs, which might indicate a strong bullish trend.
- Red bars suggest that the trend is not uniformly upward, which could be a sign of weakening momentum or a potential reversal.
#### 6. Alerts
- **Alert Conditions**: The script also allows for alert conditions to be set based on the slope analysis:
- An alert can be triggered when all EMA slopes are positive. This might be useful for traders who want to be notified when the market shows strong upward momentum.
### Summary
- The script essentially takes the market data and applies three different EMAs to it, each with a different time frame.
- It then checks the direction (slope) of each of these EMAs to determine if they are all trending upwards.
- If they are, the script colors the bar green, signaling a potentially strong bullish trend.
- If any of the EMAs is not trending upwards, it colors the bar red, indicating a potential issue with the strength of the trend.
This approach helps traders quickly assess market conditions based on multiple EMAs, providing a clearer picture of the overall trend across different time frames.
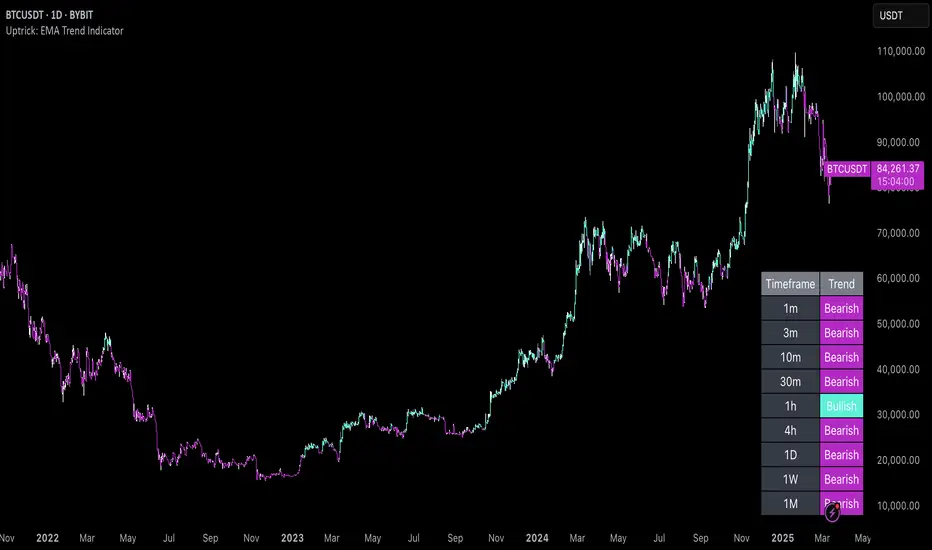
Uptrick: Bullish/Bearish Signal DetectorDetailed Explanation of the "Uptrick: Bullish/Bearish Signal Detector" Script
The "Uptrick: Bullish/Bearish Signal Detector" script is a sophisticated tool designed for the TradingView platform, leveraging Pine Script version 5. This script is crafted to enhance traders' ability to identify bullish (buy) and bearish (sell) signals directly on their trading charts. By combining the power of the MACD (Moving Average Convergence Divergence) and RSI (Relative Strength Index) indicators, this script provides a unique and efficient method for detecting potential trading opportunities. Below is an in-depth exploration of its purpose, features, and functionality.
Purpose
The primary purpose of this script is to assist traders in identifying potential entry and exit points in the market by signaling bullish and bearish conditions. This automated detection helps traders make more informed decisions without the need to manually analyze complex indicators. By overlaying signals directly on the price chart, the script allows for quick visual identification of market trends and reversals.
Uniqueness
What sets this script apart is its dual use of MACD and RSI indicators. While many trading strategies might rely on a single indicator, combining MACD and RSI enhances the reliability of the signals by filtering out false positives. The script not only identifies trends but also adds a layer of confirmation through the RSI, which measures the speed and change of price movements.
Inputs and Features
Customizable Label Appearance:
The script allows users to customize the appearance of the labels that indicate bullish and bearish signals. Users can set their preferred colors for the labels and the text, ensuring that the signals are easily distinguishable and aesthetically pleasing on their charts.
MACD Calculation:
The script calculates the MACD line and signal line using user-defined input values for the fast length, slow length, and signal length. The MACD histogram, which is the difference between the MACD line and the signal line, is used to determine the momentum of the market.
RSI Calculation:
The RSI is calculated using a user-defined input length. The RSI helps in identifying overbought or oversold conditions, which are crucial for confirming the strength of the trend detected by the MACD.
Bullish and Bearish Conditions:
The script defines bullish conditions as those where the MACD histogram is positive and the RSI is above 50. Bearish conditions are defined where the MACD histogram is negative and the RSI is below 50. This combination of conditions ensures that signals are generated based on both momentum and relative strength, reducing the likelihood of false signals.
Label Plotting:
The script plots labels on the chart to indicate bullish and bearish signals. When a bullish condition is met, and the previous signal was not bullish, a "LONG" label is plotted. Similarly, when a bearish condition is met, and the previous signal was not bearish, a "SHORT" label is plotted. This feature helps in clearly marking the points of interest for traders, making it easier to spot potential trades.
Tracking Previous Signals:
To avoid repetitive signals, the script keeps track of the last signal. If the last signal was bullish, it avoids plotting another bullish signal immediately. The same logic applies to bearish signals. This tracking ensures that signals are spaced out and only significant changes in market conditions are highlighted.
How It Works
The script operates in a loop, processing each bar (or candlestick) on the chart as new data comes in. It calculates the MACD and RSI values for each bar and checks if the current conditions meet the criteria for a bullish or bearish signal. If a signal is detected and it is different from the last signal, a label is plotted on the chart at the current bar's price level. This real-time processing allows traders to see the signals as they form, providing timely insights into market movements.
Practical Application
For practical use, a trader would add this script to their TradingView chart. They can customize the input parameters for the MACD and RSI calculations to fit their trading strategy or preferred settings. Once added, the script will automatically analyze the price data and start plotting "LONG" and "SHORT" labels based on the detected signals. Traders can then use these labels to make decisions on entering or exiting trades, adjusting their strategy as necessary based on the signals provided.
Conclusion
The "Uptrick: Bullish/Bearish Signal Detector" script is a powerful tool for any trader looking to leverage technical indicators for better trading decisions. By combining MACD and RSI, it offers a robust method for detecting market trends and potential reversals. The customizable features and real-time signal plotting make it a versatile and user-friendly addition to any trading toolkit. This script not only simplifies the process of technical analysis but also enhances the accuracy of trading signals, thereby potentially increasing the trader's success rate in the market.

Uptrick: MultiMA_VolumePurpose:
The "Uptrick: MultiMA_Volume" indicator, identified by its abbreviated title 'MMAV,' is meticulously designed to provide traders with a comprehensive view of market dynamics by incorporating multiple moving averages (MAs) and volume analysis. With adjustable inputs and customizable visibility options, traders can tailor the indicator to their specific trading preferences and strategies, thereby enhancing its utility and usability.
Explanation:
Input Variables and Customization:
Traders have the flexibility to adjust various parameters, including the lengths of different moving averages (SMA, EMA, WMA, HMA, and KAMA), as well as the option to show or hide each moving average and volume-related components.
Customization options empower traders to fine-tune the indicator according to their trading styles and market preferences, enhancing its adaptability across different market conditions.
Moving Averages and Trend Identification:
The script computes multiple types of moving averages, including Simple (SMA), Exponential (EMA), Weighted (WMA), Hull (HMA), and Kaufman's Adaptive (KAMA), allowing traders to assess trend directionality and strength from various perspectives.
Traders can determine potential price movements by observing the relationship between the current price and the plotted moving averages. For example, prices above the moving averages may suggest bullish sentiment, while prices below could indicate bearish sentiment.
Volume Analysis:
Volume analysis is integrated into the indicator, enabling traders to evaluate volume dynamics alongside trend analysis.
Traders can identify significant volume spikes using a customizable threshold, with bars exceeding the threshold highlighted to signify potential shifts in market activity and liquidity.
Determining Potential Price Movements:
By analyzing the relationship between price and the plotted moving averages, traders can infer potential price movements.
Bullish biases may be suggested when prices are above the moving averages, accompanied by rising volume, while bearish biases may be indicated when prices are below the moving averages, with declining volume reinforcing the potential for downward price movements.
Utility and Potential Usage:
The "Uptrick: MultiMA_Volume" indicator serves as a comprehensive tool for traders, offering insights into trend directionality, strength, and volume dynamics.
Traders can utilize the indicator to identify potential trading opportunities, confirm trend signals, and manage risk effectively.
By consolidating multiple indicators into a single chart, the indicator streamlines the analytical process, providing traders with a concise overview of market conditions and facilitating informed decision-making.
Through its customizable features and comprehensive analysis, the "Uptrick: MultiMA_Volume" indicator equips traders with actionable insights into market trends and volume dynamics. By integrating trend analysis and volume assessment into their trading strategies, traders can navigate the markets with confidence and precision, thereby enhancing their trading outcomes.
