TimezoneDiffLibLibrary "TimezoneDiffLib" get_tz_diff(tz1, tz2) Parameters: tz1 (string) tz2 (string)ไลบรารี Pine Script®โดย cckikas1
DrIdrLibraryLibrary "DrIdrLibrary" TODO: add library description here update() DR Fields: price (series float) isValid (series bool) city (series City) l (series line) Data Fields: pendingDRs (array) activeDrs (array)ไลบรารี Pine Script®โดย tomasz_foltynที่อัปเดต: 0
Helper Lib by tristanlee85Library "helpers" This library offers various functions and types based on the algorithmic concepts as authored by ICT. kv(key, value) Returns a string of the key/value set, suitable for debug logging Parameters: key (string) value (string) Returns: A string formatted as "{key}: {value}" kv(key, value) Parameters: key (string) value (int) kv(key, value) Parameters: key (string) value (float) kv(key, value) Parameters: key (string) value (bool) method enable(this, enable) Enable/Disable debug logging Namespace types: Debugger Parameters: this (Debugger) enable (bool) : Set to `true` by default. method group(this, label) Creates a group label for nested debug() invocations Namespace types: Debugger Parameters: this (Debugger) label (string) method groupEnd(this, label) Ends the specified debug group Namespace types: Debugger Parameters: this (Debugger) label (string) method log(this, s, arg1, arg2, arg3, arg4, arg5) Logs the param values if debug mode is enabled Namespace types: Debugger Parameters: this (Debugger) s (string) : Title of the log message arg1 (string) arg2 (string) arg3 (string) arg4 (string) arg5 (string) method logIf(this, expr, s, arg1, arg2, arg3, arg4, arg5) Same behavior as debug() except will only log if the passed expression is true Namespace types: Debugger Parameters: this (Debugger) expr (bool) : Boolean expression to determine if debug logs should be logged s (string) : Title of the log message arg1 (string) arg2 (string) arg3 (string) arg4 (string) arg5 (string) style_getLineStyleFromType(opt) Returns the corresponding line style constant for the given LineStyleType Parameters: opt (series LineStyleType) : The selected line style type Returns: The Pine Script line style constant style_getTextSizeFromType(opt) Returns the corresponding text size constant for the given TextSizeType Parameters: opt (series TextSizeType) : The selected text size type Returns: The Pine Script text size constant style_getTextHAlignFromType(t) Returns the corresponding horizontal text align constant for the given HAlignType Parameters: t (series HAlignType) : The selected text align type Returns: The Pine Script text align constant style_getTextVAlignFromType(t) Returns the corresponding vertical text align constant for the given VAlignType Parameters: t (series VAlignType) : The selected text align type Returns: The Pine Script text align constant format_sentimentType(sentiment, pd) Used to produce a string with the sentiment and PD array type (e.g., "+FVG") Parameters: sentiment (series SentimentType) : The sentiment value (e.g., SentimentType.BULLISH) pd (series PDArrayType) : The price data array (e.g., PDArrayType.FVG) Returns: A formatted string with the sentiment and PD array (e.g., "+FVG") format_timeToString(timestamp) Formats a UNIX timestamp into a date and time string based on predefined formats Parameters: timestamp (int) : The UNIX timestamp to format Returns: A formatted string as "MM-dd (E) - HH:mm" method init(this) Initializes the session and validates the configuration. This MUST be called immediately after creating a new instance. Namespace types: Session Parameters: this (Session) : The Session object reference Returns: The Session object (chainable) or throws a runtime error if invalid method isActive(this, _time) Determines if the session is active based on the current bar time Namespace types: Session Parameters: this (Session) : The Session object reference _time (int) Returns: `true` if the session is currently active; `false` otherwise method draw(this) Draws the line and optional label Namespace types: LineLabel Parameters: this (LineLabel) : The LineLabel object reference Returns: The LineLabel object (chainable) method extend(this, x) Extends the line and label right to the specified bar index Namespace types: LineLabel Parameters: this (LineLabel) : The LineLabel object reference x (int) : The bar index to extend to Returns: The LineLabel object (chainable) method destroy(this) Removes the line and label from the chart Namespace types: LineLabel Parameters: this (LineLabel) : The LineLabel object reference isFVG(includeVI, barIdx) Checks if the previous bars form a Fair Value Gap (FVG) Parameters: includeVI (bool) : If true, includes Volume Imbalance in the FVG calculation barIdx (int) : The index of the bar to check from (default is 0 for the current bar) Returns: A Gap object if a FVG is detected; otherwise, `na` isVolumeImbalance(barIdx) Checks if the previous bars form a Volume Imbalance (VI) Parameters: barIdx (int) : The index of the bar to check from (default is 0 for the current bar) Returns: A Gap object if a VI is detected; otherwise, `na` isLiquidityVoid(barIdx) Checks if the previous bars form a Liquidity Void (LV) Parameters: barIdx (int) : The index of the bar to check from (default is 0 for the current bar) Returns: A Gap object if an LV is detected; otherwise, `na` isSwingPoint(barIdx) Checks if the previous bars form a swing point Parameters: barIdx (int) : The index of the bar to check from (default is 0 for the current bar) Returns: A SwingPoint object if a swing point is detected; otherwise, `na` Debugger A debug logging utility with group support Fields: enabled (series bool) _debugGroupStack (array) Session Defines a trading session with a name and time range. When creating a new instance of this type, you MUST call init() immediately. Fields: name (series string) : A display-friendly name (e.g., "NY AM") session (series string) : A string defining the session time range (e.g., "1300-1400") enabled (series bool) : Optional flag for custom logic; defaults to false start (series int) : UNIX time representing the session start (set via isActive()) end (series int) : UNIX time representing the session end (set via isActive()) _t (series int) _start_HH (series float) _start_mm (series float) _end_HH (series float) _end_mm (series float) Gap Represents a price inefficiency (gap) with details on sentiment and price levels Fields: type (series SentimentType) : The sentiment of the gap (e.g., SentimentType.BULLISH) name (series string) : A display-friendly name (e.g., "+FVG") startTime (series int) : UNIX time value for the gap's start endTime (series int) : UNIX time value for the gap's end startIndex (series int) : Bar index where the gap starts endIndex (series int) : Bar index where the gap ends gapLow (series float) : The lowest price level of the gap gapHigh (series float) : The highest price level of the gap ce (series float) : The consequent encroachment level of the gap SwingPoint Represents a swing point with details on type and price level Fields: type (series SwingPointType) : The type of swing point (e.g., SwingPointType.HIGH) time (series int) : UNIX time value for the swing point barIdx (series int) : Bar index where the swing point occurs price (series float) : The price level of the swing point which is either the high or low of the middle bar LineLabel Combines a line and box type to produce a line with a label that is properly aligned Fields: x (series int) : The X-axis starting point as a bar index y (series float) : The Y-axis starting point as the price level color (series color) : Both the line and text color width (series int) : Thickness of the line label (series string) : Text to display showLabel (series bool) : Boolean to conditionally show/hide the label (default is false) lineStyle (series LineStyleType) : The style of the line textSize (series TextSizeType) _b (series box) _l (series line)ไลบรารี Pine Script®โดย tristanlee85ที่อัปเดต: 4
BestTimeFrameFinderLibrary "BestTimeFrameFinder" adx(len) Parameters: len (simple int) atrPercent(len) Parameters: len (simple int) scaleFromTf(tf, atrWeight) Parameters: tf (string) atrWeight (simple float) scoreLocal(adxLen, atrLen, scale) Parameters: adxLen (simple int) atrLen (simple int) scale (simple float) maxInArray(arr) Parameters: arr (array)ไลบรารี Pine Script®โดย rahnlevที่อัปเดต: 1
TimezoneFormatIANAUTCLibrary "TimezoneFormatIANAUTC" Provides either the full IANA timezone identifier or the corresponding UTC offset for TradingView’s built-in variables and functions. tz(_tzname, _format) Parameters: _tzname (string) : "London", "New York", "Istanbul", "+1:00", "-03:00" etc. _format (string) : "IANA" or "UTC" Returns: "Europe/London", "America/New York", "UTC+1:00" Example Code import ARrowofTime/TimezoneFormatIANAUTC/1 as libtz sesTZInput = input.string(defval = "Singapore", title = "Timezone") example1 = libtz.tz("London", "IANA") // Return Europe/London example2 = libtz.tz("London", "UTC") // Return UTC+1:00 example3 = libtz.tz("UTC+5", "IANA") // Return UTC+5:00 example4 = libtz.tz("UTC+4:30", "UTC") // Return UTC+4:30 example5 = libtz.tz(sesTZInput, "IANA") // Return Asia/Singapore example6 = libtz.tz(sesTZInput, "UTC") // Return UTC+8:00 sesTime1 = time("","1300-1700", example1) // returns the UNIX time of the current bar in session time or na sesTime2 = time("","1300-1700", example2) // returns the UNIX time of the current bar in session time or na sesTime3 = time("","1300-1700", example3) // returns the UNIX time of the current bar in session time or na sesTime4 = time("","1300-1700", example4) // returns the UNIX time of the current bar in session time or na sesTime5 = time("","1300-1700", example5) // returns the UNIX time of the current bar in session time or na sesTime6 = time("","1300-1700", example6) // returns the UNIX time of the current bar in session time or na Parameter Format Guide This section explains how to properly format the parameters for the tz(_tzname, _format) function. _tzname (string) must be either; A valid timezone name exactly as it appears in the chart’s lower-right corner (e.g. New York, London). A valid UTC offset in ±H:MM or ±HH:MM format. Hours: 0–14 (zero-padded or not, e.g. +1:30, +01:30, -0:00). Minutes: Must be 00, 15, 30, or 45 examples; "New York" → ✅ Valid chart label "London" → ✅ Valid chart label "Berlin" → ✅ Valid chart label "America/New York" → ❌ Invalid chart label. (Use "New York" instead) "+1:30" → ✅ Valid offset with single-digit hour "+01:30" → ✅ Valid offset with zero-padded hour "-05:00" → ✅ Valid negative offset "-0:00" → ✅ Valid zero offset "+1:1" → ❌ Invalid (minute must be 00, 15, 30, or 45) "+2:50" → ❌ Invalid (minute must be 00, 15, 30, or 45) "+15:00" → ❌ Invalid (hour must be 14 or below) _tztype (string) must be either; "IANA" → returns full IANA timezone identifier (e.g. "Europe/London"). When a time function call uses an IANA time zone identifier for its timezone argument, its calculations adjust automatically for historical and future changes to the specified region’s observed time, such as daylight saving time (DST) and updates to time zone boundaries, instead of using a fixed offset from UTC. "UTC" → returns UTC offset string (e.g. "UTC+01:00") ไลบรารี Pine Script®โดย ARrowofTime1
MirPapa_Handler_HTFLibrary "MirPapa_Handler_HTF" High Time Frame Handler Library: Provides utilities for working with High Time Frame (HTF) and chart (LTF) conversions and data retrieval. IsChartTFcomparisonHTF(_chartTf, _htfTf) IsChartTFcomparisonHTF @description Determine whether the given High Time Frame (HTF) is greater than or equal to the current chart timeframe. Parameters: _chartTf (string) : The current chart’s timeframe string (examples: "5", "15", "1D"). _htfTf (string) : The High Time Frame string to compare (examples: "60", "1D"). @return Returns true if HTF minutes ≥ chart minutes, false otherwise or na if conversion fails. GetHTFrevised(_tf, _case) GetHTFrevised @description Retrieve a specific bar value from a Higher Time Frame (HTF) series. Supports current and historical OHLC values, based on a case identifier. Parameters: _tf (string) : The target HTF string (examples: "60", "1D"). _case (string) : A case string determining which OHLC value and bar offset to request: "b" → HTF bar_index "o" → HTF open "h" → HTF high "l" → HTF low "c" → HTF close "o1" → HTF open one bar ago "h1" → HTF high one bar ago "l1" → HTF low one bar ago "c1" → HTF close one bar ago … up to "o5", "h5", "l5", "c5" for five bars ago. @return Returns the requested HTF value or na if _case does not match any condition. GetHTFfromLabel(_label) GetHTFfromLabel @description Convert a Korean HTF label into a Pine Script-recognizable timeframe string. Examples: "5분" → "5" "1시간" → "60" "일봉" → "1D" "주봉" → "1W" "월봉" → "1M" "연봉" → "12M" Parameters: _label (string) : The Korean HTF label string (examples: "5분", "1시간", "일봉"). @return Returns the Pine Script timeframe string corresponding to the label, or "1W" if no match is found. GetHTFoffsetToLTFoffset(_offset, _chartTf, _htfTf) GetHTFoffsetToLTFoffset @description Adjust an HTF bar index and offset so that it aligns with the current chart’s bar index. Useful for retrieving historical HTF data on an LTF chart. Parameters: _offset (int) : The HTF bar offset (0 means current HTF bar, 1 means one bar ago, etc.). _chartTf (string) : The current chart’s timeframe string (examples: "5", "15", "1D"). _htfTf (string) : The High Time Frame string to align (examples: "60", "1D"). @return Returns the corresponding LTF bar index after applying HTF offset. If result is negative, returns 0.ไลบรารี Pine Script®โดย goodiaที่อัปเดต: 4
WhispererRealtimeVolumeLibrary "WhispererRealtimeVolume" ▮ Overview The Whisperer Realtime Volume Library is a lightweight and reusable Pine Script® library designed for real-time volume analysis. It calculates up, down, and neutral volumes dynamically, making it an essential tool for traders who want to gain deeper insights into market activity. This library is a simplified and modular version of the original "Realtime Volume Bars w Market Buy/Sell/Neutral split & Mkt Delta" indicator by the_MarketWhisperer , tailored for integration into custom scripts. How bars are classified - Up Bars If the current bar’s closing price is higher than the previous bar’s closing price, it is classified as an up bar. Volume handling: The increase in volume for this bar is added to the up volume. This represents buying pressure. - Down Bars If the current bar’s closing price is lower than the previous bar’s closing price, it is classified as a down bar. Volume handling: The increase in volume for this bar is added to the down volume. This represents selling pressure. - Neutral Bars If the current bar’s closing price is the same as the previous bar’s closing price, it is classified as a neutral bar. Volume handling: If neutral volume is enabled, the volume is added to the neutral volume. If neutral volume is not enabled, the volume is assigned to the same direction as the previous bar (up or down). If the previous direction is unknown, it is added to the neutral volume. ▮ What to look for Real-Time Volume Calculation : Analyze up, down, and neutral volumes in real-time based on price movements and bar volume. Customizable Start Line : Add a visual reference line to your chart for better context by viewing the starting point of real-time bars. Ease of Integration : Designed as a library for seamless use in other Pine Script® indicators or strategies. ▮ How to use Example code: //@version=6 indicator("Volume Realtime from Whisperer") import andre_007/WhispererRealtimeVolume/4 as MW MW.displayStartLine(startLineColor = color.gray, startLineWidth = 1, startLineStyle = line.style_dashed, displayStartLine = true, y1=volume, y2=volume + 10) = MW.mw_upDownVolumeRealtime(true) plot(volume, style=plot.style_columns, color=color.gray) plot(volumeUp, style=plot.style_columns, color=color.green) plot(volumeDown, style=plot.style_columns, color=color.red) plot(volumeNeutral, style=plot.style_columns, color=color.purple) ▮ Credits This library is inspired by the original work of the_MarketWhisperer , whose "Realtime Volume Bars" indicator served as the foundation. Link to original indicator : ไลบรารี Pine Script®โดย andre_00715
NYCSessionLibrary "NYCSession" Library for New York trading session time functions @author abneralvarado @version 1.0 isInNYSession(sessionStart, sessionEnd) Determines if the current bar is within New York trading session Parameters: sessionStart (simple int) : Starting time of NY session in 24hr format (HHMM) like 0930 for 9:30 AM ET sessionEnd (simple int) : Ending time of NY session in 24hr format (HHMM) like 1600 for 4:00 PM ET Returns: True if current bar is within the NY session time, false otherwise getNYSessionStartTime(lookback, sessionStart) Gets the start time of NY session for a given bar Parameters: lookback (simple int) : Bar index to check (0 is current bar) sessionStart (simple int) : Starting time of NY session in 24hr format (HHMM) Returns: Unix timestamp for the start of NY session on the given bar's date getNYSessionEndTime(lookback, sessionEnd) Gets the end time of NY session for a given bar Parameters: lookback (simple int) : Bar index to check (0 is current bar) sessionEnd (simple int) : Ending time of NY session in 24hr format (HHMM) Returns: Unix timestamp for the end of NY session on the given bar's date isNYSessionOpen(sessionStart) Checks if current bar opens the NY session Parameters: sessionStart (simple int) : Starting time of NY session in 24hr format (HHMM) Returns: True if current bar marks the session opening, false otherwise isNYSessionClose(sessionEnd) Checks if current bar closes the NY session Parameters: sessionEnd (simple int) : Ending time of NY session in 24hr format (HHMM) Returns: True if current bar marks the session closing, false otherwise isWeekday() Determines if the current day is a weekday (Mon-Fri) Returns: True if current bar is on a weekday, false otherwise getSessionBackgroundColor(sessionStart, sessionEnd, bgColor) Gets session background color with transparency Parameters: sessionStart (simple int) : Starting time of NY session in 24hr format (HHMM) sessionEnd (simple int) : Ending time of NY session in 24hr format (HHMM) bgColor (color) : Background color for session highlighting Returns: Color value for background or na if not in sessionไลบรารี Pine Script®โดย abneralvaradoที่อัปเดต: 2
TimezoneLibrary with pre-defined timezone enums that can be used to request a timezone input from the user. The library provides a `tostring()` function to convert enum values to a valid string that can be used as a `timezone` parameter in pine script built-in functions. The library also includes a bonus function to get a formatted UTC offset from a UNIX timestamp. The timezone enums in this library were compiled by referencing the available timezone options from TradingView chart settings as well as multiple Wikipedia articles relating to lists of time zones. Some enums from this library are used to retrieve an IANA time zone identifier, while other enums only use UTC/GMT offset notation. It is important to note that the Pine Script User Manual recommends using IANA notation in most cases. HOW TO USE This library is intended to be used by Pine Coders who wish to provide their users with a simple way to input a timezone. Using this library is as easy as 1, 2, 3: Step 1 Import the library into your script. Replace with the latest available version number for this library. //@version=6 indicator("Example") import n00btraders/Timezone/ as tz Step 2 Select one of the available enums from the library and use it as an input. Tip: view the library source code and scroll through the enums at the top to find the best choice for your script. timezoneInput = input.enum(tz.TimezoneID.EXCHANGE, "Timezone") Step 3 Convert the user-selected input into a valid string that can be used in one of the pine script built-in functions that have a `timezone` parameter. string timezone = tz.tostring(timezoneInput) EXPORTED FUNCTIONS There are multiple 𝚝𝚘𝚜𝚝𝚛𝚒𝚗𝚐() functions in this library: one for each timezone enum. The function takes a single parameter: any enum field from one of the available timezone enums that are exported by this library. Depending on the selected enum, the function will return a time zone string in either UTC/GMT notation or IANA notation. Note: to avoid confusion with the built-in `str.tostring()` function, it is recommended to use this library's `tostring()` as a method rather than a function: string timezone = timezoneInput.tostring() offset(timestamp, format, timezone, prefix, colon) Formats the time offset from a UNIX timestamp represented in a specified timezone. Namespace types: series OffsetFormat Parameters: timestamp (int) : (series int) A UNIX time. format (series OffsetFormat) : (series OffsetFormat) A time offset format. timezone (string) : (series string) A UTC/GMT offset or IANA time zone identifier. prefix (string) : (series string) Optional 'UTC' or 'GMT' prefix for the result. colon (bool) : (series bool) Optional usage of colon separator. Returns: Time zone offset using the selected format. The 𝚘𝚏𝚏𝚜𝚎𝚝() function is provided as a convenient alternative to manually using `str.format_time()` and then manipulating the result. The OffsetFormat enum is used to decide the format of the result from the `offset()` function. The library source code contains comments above this enum declaration that describe how each enum field will modify a time offset. Tip: hover over the `offset()` function call in the Pine Editor to display a pop-up containing: Function description Detailed parameter list, including default values Example function calls Example outputs for different OffsetFormat.* enum values NOTES At the time of this publication, Pine cannot be used to access a chart's selected time zone. Therefore, the main benefit of this library is to provide a quick and easy way to create a pine script input for a time zone (most commonly, the same time zone selected in the user's chart settings). At the time of the creation of this library, there are 95 Time Zones made available in the TradingView chart settings. If any changes are made to the time zone settings, this library will be updated to match the new changes. All time zone enums (and their individual fields) in this library were manually verified and tested to ensure correctness. An example usage of this library is included at the bottom of the source code. Credits to HoanGhetti for providing a nice Markdown resource which I referenced to be able to create a formatted informational pop-up for this library's `offset()` function. ไลบรารี Pine Script®โดย n00btraders9977
TimeframeUtilsLibrary "TimeframeUtils" Timeframe Utilities Library – Provides functions to convert timeframe resolutions to minutes and generate human‐readable timeframe text. tfResInMinutes(_res) tfResInMinutes Parameters: _res (string) Returns: float - The specified timeframe's resolution in minutes. getTimeFrameText(_tf) getTimeFrameText Parameters: _tf (string) Returns: string - A human-readable representation of the specified timeframe.ไลบรารี Pine Script®โดย PtGambler9
TCTDailyBiasLibraryLibrary "TCTDailyBiasLibrary" Provides a simple function to return a daily bias based on the break of the morning range getDailyBias() Returns the daily bias based on the break of the morning range Returns: biasไลบรารี Pine Script®โดย the-coding-trader2
Casa_VolumeProfileSessionLibrary "Casa_VolumeProfileSession" Analyzes price and volume during regular trading hours to provide a session volume profile, including Point of Control (POC), Value Area High (VAH), and Value Area Low (VAL). Calculates and displays these levels historically and for the developing session. Offers customizable visualization options for the Value Area, POC, histogram, and labels. Uses lower timeframe data for increased accuracy and supports futures sessions. The number of rows used for the volume profile can be fixed or dynamically calculated based on the session's price range and the instrument's minimum tick increment, providing optimal resolution. calculateEffectiveRows(configuredRows, dayHigh, dayLow) Determines the optimal number of rows for the volume profile, either using the configured value or calculating dynamically based on price range and tick size Parameters: configuredRows (int) : User-specified number of rows (0 means auto-calculate) dayHigh (float) : Highest price of the session dayLow (float) : Lowest price of the session Returns: The number of rows to use for the volume profile debug(vp, position) Helper function to write some information about the supplied SVP object to the screen in a table. Parameters: vp (Object) : The SVP object to debug position (string) : The position.* to place the table. Defaults to position.bottom_center getLowerTimeframe() Depending on the timeframe of the chart, determines a lower timeframe to grab volume data from for the analysis Returns: The timeframe string to fetch volume for get(volumeProfile, lowerTimeframeHigh, lowerTimeframeLow, lowerTimeframeVolume, lowerTimeframeTime, lowerTimeframeSessionIsMarket) Populated the provided SessionVolumeProfile object with vp data on the session. Parameters: volumeProfile (Object) : The SessionVolumeProfile object to populate lowerTimeframeHigh (array) : The lower timeframe high values lowerTimeframeLow (array) : The lower timeframe low values lowerTimeframeVolume (array) : The lower timeframe volume values lowerTimeframeTime (array) : The lower timeframe time values lowerTimeframeSessionIsMarket (array) : The lower timeframe session.ismarket values (that are futures-friendly) drawPriorValueAreas(todaySessionVolumeProfile, extendYesterdayOverToday, showLabels, labelSize, pocColor, pocStyle, pocWidth, vahlColor, vahlStyle, vahlWidth, vaColor) Given a SessionVolumeProfile Object, will render the historical value areas for that object. Parameters: todaySessionVolumeProfile (Object) : The SessionVolumeProfile Object to draw extendYesterdayOverToday (bool) : Defaults to true showLabels (bool) : Defaults to true labelSize (string) : Defaults to size.small pocColor (color) : Defaults to #e500a4 pocStyle (string) : Defaults to line.style_solid pocWidth (int) : Defaults to 1 vahlColor (color) : The color of the value area high/low lines. Defaults to #1592e6 vahlStyle (string) : The style of the value area high/low lines. Defaults to line.style_solid vahlWidth (int) : The width of the value area high/low lines. Defaults to 1 vaColor (color) : The color of the value area background. Defaults to #00bbf911) drawHistogram(volumeProfile, bgColor, showVolumeOnHistogram) Given a SessionVolumeProfile object, will render the histogram for that object. Parameters: volumeProfile (Object) : The SessionVolumeProfile object to draw bgColor (color) : The baseline color to use for the histogram. Defaults to #00bbf9 showVolumeOnHistogram (bool) : Show the volume amount on the histogram bars. Defaults to false. Object Object Contains all settings and calculated values for a Volume Profile Session analysis Fields: numberOfRows (series int) : Number of price levels to divide the range into. If set to 0, auto-calculates based on price range and tick size valueAreaCoverage (series int) : Percentage of total volume to include in the Value Area (default 70%) trackDevelopingVa (series bool) : Whether to calculate and display the Value Area as it develops during the session valueAreaHigh (series float) : Upper boundary of the Value Area - price level containing specified % of volume pointOfControl (series float) : Price level with the highest volume concentration valueAreaLow (series float) : Lower boundary of the Value Area startTime (series int) : Session start time in Unix timestamp format endTime (series int) : Session end time in Unix timestamp format dayHigh (series float) : Highest price of the session dayLow (series float) : Lowest price of the session step (series float) : Size of each price row (calculated as price range divided by number of rows) pointOfControlLevel (series int) : Index of the row containing the Point of Control valueAreaHighLevel (series int) : Index of the row containing the Value Area High valueAreaLowLevel (series int) : Index of the row containing the Value Area Low lastTime (series int) : Tracks the most recent timestamp processed volumeRows (map) : Stores volume data for each price level row (key=row number, value=volume) ltfSessionHighs (array) : Stores high prices from lower timeframe data ltfSessionLows (array) : Stores low prices from lower timeframe data ltfSessionVols (array) : Stores volume data from lower timeframe dataไลบรารี Pine Script®โดย Mupsjeที่อัปเดต: 5528
Casa_SessionsLibrary "Casa_Sessions" Advanced trading session management library that enhances TradingView's default functionality: Key Features: - Accurate session detection for futures markets - Custom session hour definitions - Drop-in replacements for standard TradingView session functions - Flexible session map customization - Full control over trading windows and market hours Perfect for traders who need precise session timing, especially when working with futures markets or custom trading schedules. SetSessionTimes(session_type_input, custom_session_times_input, syminfo_type, syminfo_root, syminfo_timezone) Parameters: session_type_input (simple string) : Input string for session selection: - 'Custom': User-defined session times - 'FX-Tokyo': Tokyo forex session - 'FX-London': London forex session - 'FX-New York': NY forex session - 'Overnight Session (ON)': After-hours trading - 'Day Session (RTH)': Regular trading hours custom_session_times_input (simple string) : Session parameter for custom time windows Only used when session_type_input is 'Custom' syminfo_type (simple string) syminfo_root (simple string) syminfo_timezone (simple string) Returns: session_times: Trading hours for selected session session_timezone: Market timezone (relevant for forex) getSessionMap() Get futures trading session hours map Keys are formatted as 'symbol:session', examples: - 'ES:market' - Regular trading hours (RTH) - 'ES:overnight' - Extended trading hours (ETH) - 'NQ:market' - NASDAQ futures RTH - 'CL:overnight' - Crude Oil futures ETH Returns: Map Key: Symbol:session identifier Value: Session hours in format "HH:MM-HH:MM" getSessionString(session, symbol, sessionMap) Returns a session string representing the session hours (and days) for the requested symbol (or the chart's symbol if the symbol value is not provided). If the session string is not found in the collection, it will return a blank string. Parameters: session (string) : A string representing the session hour being requested. One of: market (regular trading hours), overnight (extended/electronic trading hours), postmarket (after-hours), premarket symbol (string) : The symbol to check. Optional. Defaults to chart symbol. sessionMap (map) : The map of futures session hours. Optional. Uses default if not provided. inSession(session, sessionMap, barsBack) Returns true if the current symbol is currently in the session parameters defined by sessionString. Parameters: session (string) : A string representing the session hour being requested. One of: market (regular trading hours), overnight (extended/electronic trading hours), postmarket (after-hours), premarket sessionMap (map) : The map of futures session hours. Optional. Uses default if not provided. barsBack (int) : Private. Only used by futures to check islastbar. Optional. The default is 0. ismarket(sessionMap) Returns true if the current bar is a part of the regular trading hours (i.e. market hours), false otherwise. Works for futures (TradingView's methods do not). Parameters: sessionMap (map) : The map of futures session hours. Optional. Uses default if not provided. Returns: bool isfirstbar() Returns true if the current bar is the first bar of the day's session, false otherwise. If extended session information is used, only returns true on the first bar of the pre-market bars. Works for futures (TradingView's methods do not). Returns: bool islastbar() Returns true if the current bar is the last bar of the day's session, false otherwise. If extended session information is used, only returns true on the last bar of the post-market bars. Works for futures (TradingView's methods do not). Returns: bool ispremarket(sessionMap) Returns true if the current bar is a part of the pre-market, false otherwise. On non-intraday charts always returns false. Works for futures (TradingView's methods do not). Parameters: sessionMap (map) : The map of futures session hours. Optional. Uses default if not provided. Returns: bool ispostmarket(sessionMap) Returns true if the current bar is a part of the post-market, false otherwise. On non-intraday charts always returns false. Works for futures (TradingView's methods do not). Parameters: sessionMap (map) : The map of futures session hours. Optional. Uses default if not provided. Returns: bool isfirstbar_regular(sessionMap) Returns true on the first regular session bar of the day, false otherwise. The result is the same whether extended session information is used or not. Works for futures (TradingView's methods do not). Parameters: sessionMap (map) : The map of futures session hours. Optional. Uses default if not provided. Returns: bool islastbar_regular(sessionMap) Returns true on the last regular session bar of the day, false otherwise. The result is the same whether extended session information is used or not. Works for futures (TradingView's methods do not). Parameters: sessionMap (map) : The map of futures session hours. Optional. Uses default if not provided. Returns: bool isovernight(sessionMap) Returns true if the current bar is a part of the pre-market or post-market, false otherwise. On non-intraday charts always returns false. Parameters: sessionMap (map) : The map of futures session hours. Optional. Uses default if not provided. Returns: bool getSessionHighAndLow(session, sessionMap) Returns a tuple containing the high and low print during the specified session. Parameters: session (string) : The session for which to get the high & low prints. Defaults to market. sessionMap (map) : The map of futures session hours. Optional. Uses default if not provided. Returns: A tuple containing getSessionHigh(session, sessionMap) Convenience function to return the session high. Necessary if you want to call this function from within a request.security expression where you can't return a tuple. Parameters: session (string) : The session for which to get the high & low prints. Defaults to market. sessionMap (map) : The map of futures session hours. Optional. Uses default if not provided. Returns: The high of the session getSessionLow(session, sessionMap) Convenience function to return the session low. Necessary if you want to call this function from within a request.security expression where you can't return a tuple. Parameters: session (string) : The session for which to get the high & low prints. Defaults to market. sessionMap (map) : The map of futures session hours. Optional. Uses default if not provided. Returns: The low of the sessionไลบรารี Pine Script®โดย Mupsjeที่อัปเดต: 3
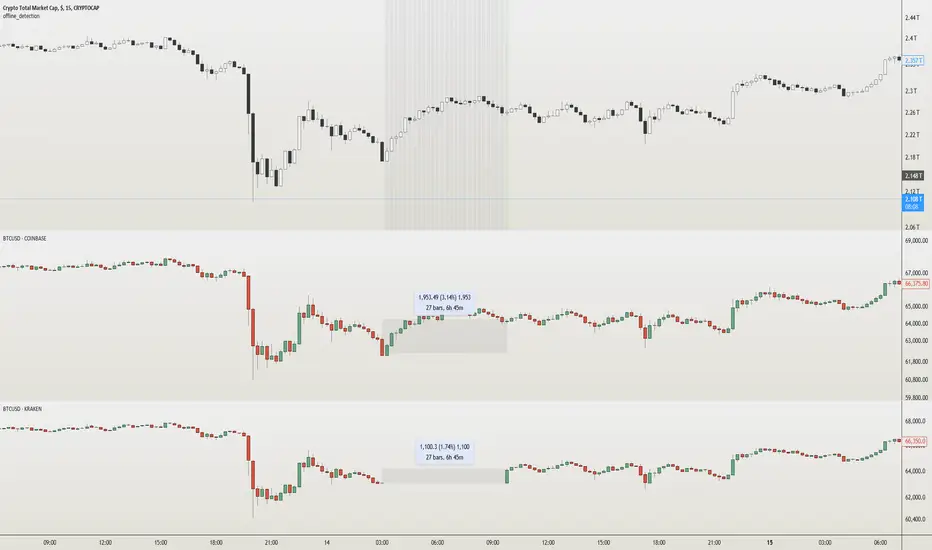
ValueAtTime█ OVERVIEW This library is a Pine Script® programming tool for accessing historical values in a time series using UNIX timestamps . Its data structure and functions index values by time, allowing scripts to retrieve past values based on absolute timestamps or relative time offsets instead of relying on bar index offsets. █ CONCEPTS UNIX timestamps In Pine Script®, a UNIX timestamp is an integer representing the number of milliseconds elapsed since January 1, 1970, at 00:00:00 UTC (the UNIX Epoch ). The timestamp is a unique, absolute representation of a specific point in time. Unlike a calendar date and time, a UNIX timestamp's meaning does not change relative to any time zone . This library's functions process series values and corresponding UNIX timestamps in pairs , offering a simplified way to identify values that occur at or near distinct points in time instead of on specific bars. Storing and retrieving time-value pairs This library's `Data` type defines the structure for collecting time and value information in pairs. Objects of the `Data` type contain the following two fields: • `times` – An array of "int" UNIX timestamps for each recorded value. • `values` – An array of "float" values for each saved timestamp. Each index in both arrays refers to a specific time-value pair. For instance, the `times` and `values` elements at index 0 represent the first saved timestamp and corresponding value. The library functions that maintain `Data` objects queue up to one time-value pair per bar into the object's arrays, where the saved timestamp represents the bar's opening time . Because the `times` array contains a distinct UNIX timestamp for each item in the `values` array, it serves as a custom mapping for retrieving saved values. All the library functions that return information from a `Data` object use this simple two-step process to identify a value based on time: 1. Perform a binary search on the `times` array to find the earliest saved timestamp closest to the specified time or offset and get the element's index. 2. Access the element from the `values` array at the retrieved index, returning the stored value corresponding to the found timestamp. Value search methods There are several techniques programmers can use to identify historical values from corresponding timestamps. This library's functions include three different search methods to locate and retrieve values based on absolute times or relative time offsets: Timestamp search Find the value with the earliest saved timestamp closest to a specified timestamp. Millisecond offset search Find the value with the earliest saved timestamp closest to a specified number of milliseconds behind the current bar's opening time. This search method provides a time-based alternative to retrieving historical values at specific bar offsets. Period offset search Locate the value with the earliest saved timestamp closest to a defined period offset behind the current bar's opening time. The function calculates the span of the offset based on a period string . The "string" must contain one of the following unit tokens: • "D" for days • "W" for weeks • "M" for months • "Y" for years • "YTD" for year-to-date, meaning the time elapsed since the beginning of the bar's opening year in the exchange time zone. The period string can include a multiplier prefix for all supported units except "YTD" (e.g., "2W" for two weeks). Note that the precise span covered by the "M", "Y", and "YTD" units varies across time. The "1M" period can cover 28, 29, 30, or 31 days, depending on the bar's opening month and year in the exchange time zone. The "1Y" period covers 365 or 366 days, depending on leap years. The "YTD" period's span changes with each new bar, because it always measures the time from the start of the current bar's opening year. █ CALCULATIONS AND USE This library's functions offer a flexible, structured approach to retrieving historical values at or near specific timestamps, millisecond offsets, or period offsets for different analytical needs. See below for explanations of the exported functions and how to use them. Retrieving single values The library includes three functions that retrieve a single stored value using timestamp, millisecond offset, or period offset search methods: • `valueAtTime()` – Locates the saved value with the earliest timestamp closest to a specified timestamp. • `valueAtTimeOffset()` – Finds the saved value with the earliest timestamp closest to the specified number of milliseconds behind the current bar's opening time. • `valueAtPeriodOffset()` – Finds the saved value with the earliest timestamp closest to the period-based offset behind the current bar's opening time. Each function has two overloads for advanced and simple use cases. The first overload searches for a value in a user-specified `Data` object created by the `collectData()` function (see below). It returns a tuple containing the found value and the corresponding timestamp. The second overload maintains a `Data` object internally to store and retrieve values for a specified `source` series. This overload returns a tuple containing the historical `source` value, the corresponding timestamp, and the current bar's `source` value, making it helpful for comparing past and present values from requested contexts. Retrieving multiple values The library includes the following functions to retrieve values from multiple historical points in time, facilitating calculations and comparisons with values retrieved across several intervals: • `getDataAtTimes()` – Locates a past `source` value for each item in a `timestamps` array. Each retrieved value's timestamp represents the earliest time closest to one of the specified timestamps. • `getDataAtTimeOffsets()` – Finds a past `source` value for each item in a `timeOffsets` array. Each retrieved value's timestamp represents the earliest time closest to one of the specified millisecond offsets behind the current bar's opening time. • `getDataAtPeriodOffsets()` – Finds a past value for each item in a `periods` array. Each retrieved value's timestamp represents the earliest time closest to one of the specified period offsets behind the current bar's opening time. Each function returns a tuple with arrays containing the found `source` values and their corresponding timestamps. In addition, the tuple includes the current `source` value and the symbol's description, which also makes these functions helpful for multi-interval comparisons using data from requested contexts. Processing period inputs When writing scripts that retrieve historical values based on several user-specified period offsets, the most concise approach is to create a single text input that allows users to list each period, then process the "string" list into an array for use in the `getDataAtPeriodOffsets()` function. This library includes a `getArrayFromString()` function to provide a simple way to process strings containing comma-separated lists of periods. The function splits the specified `str` by its commas and returns an array containing every non-empty item in the list with surrounding whitespaces removed. View the example code to see how we use this function to process the value of a text area input . Calculating period offset times Because the exact amount of time covered by a specified period offset can vary, it is often helpful to verify the resulting times when using the `valueAtPeriodOffset()` or `getDataAtPeriodOffsets()` functions to ensure the calculations work as intended for your use case. The library's `periodToTimestamp()` function calculates an offset timestamp from a given period and reference time. With this function, programmers can verify the time offsets in a period-based data search and use the calculated offset times in additional operations. For periods with "D" or "W" units, the function calculates the time offset based on the absolute number of milliseconds the period covers (e.g., `86400000` for "1D"). For periods with "M", "Y", or "YTD" units, the function calculates an offset time based on the reference time's calendar date in the exchange time zone. Collecting data All the `getDataAt*()` functions, and the second overloads of the `valueAt*()` functions, collect and maintain data internally, meaning scripts do not require a separate `Data` object when using them. However, the first overloads of the `valueAt*()` functions do not collect data, because they retrieve values from a user-specified `Data` object. For cases where a script requires a separate `Data` object for use with these overloads or other custom routines, this library exports the `collectData()` function. This function queues each bar's `source` value and opening timestamp into a `Data` object and returns the object's ID. This function is particularly useful when searching for values from a specific series more than once. For instance, instead of using multiple calls to the second overloads of `valueAt*()` functions with the same `source` argument, programmers can call `collectData()` to store each bar's `source` and opening timestamp, then use the returned `Data` object's ID in calls to the first `valueAt*()` overloads to reduce memory usage. The `collectData()` function and all the functions that collect data internally include two optional parameters for limiting the saved time-value pairs to a sliding window: `timeOffsetLimit` and `timeframeLimit`. When either has a non-na argument, the function restricts the collected data to the maximum number of recent bars covered by the specified millisecond- and timeframe-based intervals. NOTE : All calls to the functions that collect data for a `source` series can execute up to once per bar or realtime tick, because each stored value requires a unique corresponding timestamp. Therefore, scripts cannot call these functions iteratively within a loop . If a call to these functions executes more than once inside a loop's scope, it causes a runtime error. █ EXAMPLE CODE The example code at the end of the script demonstrates one possible use case for this library's functions. The code retrieves historical price data at user-specified period offsets, calculates price returns for each period from the retrieved data, and then populates a table with the results. The example code's process is as follows: 1. Input a list of periods – The user specifies a comma-separated list of period strings in the script's "Period list" input (e.g., "1W, 1M, 3M, 1Y, YTD"). Each item in the input list represents a period offset from the latest bar's opening time. 2. Process the period list – The example calls `getArrayFromString()` on the first bar to split the input list by its commas and construct an array of period strings. 3. Request historical data – The code uses a call to `getDataAtPeriodOffsets()` as the `expression` argument in a request.security() call to retrieve the closing prices of "1D" bars for each period included in the processed `periods` array. 4. Display information in a table – On the latest bar, the code uses the retrieved data to calculate price returns over each specified period, then populates a two-row table with the results. The cells for each return percentage are color-coded based on the magnitude and direction of the price change. The cells also include tooltips showing the compared daily bar's opening date in the exchange time zone. █ NOTES • This library's architecture relies on a user-defined type (UDT) for its data storage format. UDTs are blueprints from which scripts create objects , i.e., composite structures with fields containing independent values or references of any supported type. • The library functions search through a `Data` object's `times` array using the array.binary_search_leftmost() function, which is more efficient than looping through collected data to identify matching timestamps. Note that this built-in works only for arrays with elements sorted in ascending order . • Each function that collects data from a `source` series updates the values and times stored in a local `Data` object's arrays. If a single call to these functions were to execute in a loop , it would store multiple values with an identical timestamp, which can cause erroneous search behavior. To prevent looped calls to these functions, the library uses the `checkCall()` helper function in their scopes. This function maintains a counter that increases by one each time it executes on a confirmed bar. If the count exceeds the total number of bars, indicating the call executes more than once in a loop, it raises a runtime error . • Typically, when requesting higher-timeframe data with request.security() while using barmerge.lookahead_on as the `lookahead` argument, the `expression` argument should be offset with the history-referencing operator to prevent lookahead bias on historical bars. However, the call in this script's example code enables lookahead without offsetting the `expression` because the script displays results only on the last historical bar and all realtime bars, where there is no future data to leak into the past. This call ensures the displayed results use the latest data available from the context on realtime bars. Look first. Then leap. █ EXPORTED TYPES Data A structure for storing successive timestamps and corresponding values from a dataset. Fields: times (array) : An "int" array containing a UNIX timestamp for each value in the `values` array. values (array) : A "float" array containing values corresponding to the timestamps in the `times` array. █ EXPORTED FUNCTIONS getArrayFromString(str) Splits a "string" into an array of substrings using the comma (`,`) as the delimiter. The function trims surrounding whitespace characters from each substring, and it excludes empty substrings from the result. Parameters: str (series string) : The "string" to split into an array based on its commas. Returns: (array) An array of trimmed substrings from the specified `str`. periodToTimestamp(period, referenceTime) Calculates a UNIX timestamp representing the point offset behind a reference time by the amount of time within the specified `period`. Parameters: period (series string) : The period string, which determines the time offset of the returned timestamp. The specified argument must contain a unit and an optional multiplier (e.g., "1Y", "3M", "2W", "YTD"). Supported units are: - "Y" for years. - "M" for months. - "W" for weeks. - "D" for days. - "YTD" (Year-to-date) for the span from the start of the `referenceTime` value's year in the exchange time zone. An argument with this unit cannot contain a multiplier. referenceTime (series int) : The millisecond UNIX timestamp from which to calculate the offset time. Returns: (int) A millisecond UNIX timestamp representing the offset time point behind the `referenceTime`. collectData(source, timeOffsetLimit, timeframeLimit) Collects `source` and `time` data successively across bars. The function stores the information within a `Data` object for use in other exported functions/methods, such as `valueAtTimeOffset()` and `valueAtPeriodOffset()`. Any call to this function cannot execute more than once per bar or realtime tick. Parameters: source (series float) : The source series to collect. The function stores each value in the series with an associated timestamp representing its corresponding bar's opening time. timeOffsetLimit (simple int) : Optional. A time offset (range) in milliseconds. If specified, the function limits the collected data to the maximum number of bars covered by the range, with a minimum of one bar. If the call includes a non-empty `timeframeLimit` value, the function limits the data using the largest number of bars covered by the two ranges. The default is `na`. timeframeLimit (simple string) : Optional. A valid timeframe string. If specified and not empty, the function limits the collected data to the maximum number of bars covered by the timeframe, with a minimum of one bar. If the call includes a non-na `timeOffsetLimit` value, the function limits the data using the largest number of bars covered by the two ranges. The default is `na`. Returns: (Data) A `Data` object containing collected `source` values and corresponding timestamps over the allowed time range. method valueAtTime(data, timestamp) (Overload 1 of 2) Retrieves value and time data from a `Data` object's fields at the index of the earliest timestamp closest to the specified `timestamp`. Callable as a method or a function. Parameters: data (series Data) : The `Data` object containing the collected time and value data. timestamp (series int) : The millisecond UNIX timestamp to search. The function returns data for the earliest saved timestamp that is closest to the value. Returns: ( ) A tuple containing the following data from the `Data` object: - The stored value corresponding to the identified timestamp ("float"). - The earliest saved timestamp that is closest to the specified `timestamp` ("int"). valueAtTime(source, timestamp, timeOffsetLimit, timeframeLimit) (Overload 2 of 2) Retrieves `source` and time information for the earliest bar whose opening timestamp is closest to the specified `timestamp`. Any call to this function cannot execute more than once per bar or realtime tick. Parameters: source (series float) : The source series to analyze. The function stores each value in the series with an associated timestamp representing its corresponding bar's opening time. timestamp (series int) : The millisecond UNIX timestamp to search. The function returns data for the earliest bar whose timestamp is closest to the value. timeOffsetLimit (simple int) : Optional. A time offset (range) in milliseconds. If specified, the function limits the collected data to the maximum number of bars covered by the range, with a minimum of one bar. If the call includes a non-empty `timeframeLimit` value, the function limits the data using the largest number of bars covered by the two ranges. The default is `na`. timeframeLimit (simple string) : (simple string) Optional. A valid timeframe string. If specified and not empty, the function limits the collected data to the maximum number of bars covered by the timeframe, with a minimum of one bar. If the call includes a non-na `timeOffsetLimit` value, the function limits the data using the largest number of bars covered by the two ranges. The default is `na`. Returns: ( ) A tuple containing the following data: - The `source` value corresponding to the identified timestamp ("float"). - The earliest bar's timestamp that is closest to the specified `timestamp` ("int"). - The current bar's `source` value ("float"). method valueAtTimeOffset(data, timeOffset) (Overload 1 of 2) Retrieves value and time data from a `Data` object's fields at the index of the earliest saved timestamp closest to `timeOffset` milliseconds behind the current bar's opening time. Callable as a method or a function. Parameters: data (series Data) : The `Data` object containing the collected time and value data. timeOffset (series int) : The millisecond offset behind the bar's opening time. The function returns data for the earliest saved timestamp that is closest to the calculated offset time. Returns: ( ) A tuple containing the following data from the `Data` object: - The stored value corresponding to the identified timestamp ("float"). - The earliest saved timestamp that is closest to `timeOffset` milliseconds before the current bar's opening time ("int"). valueAtTimeOffset(source, timeOffset, timeOffsetLimit, timeframeLimit) (Overload 2 of 2) Retrieves `source` and time information for the earliest bar whose opening timestamp is closest to `timeOffset` milliseconds behind the current bar's opening time. Any call to this function cannot execute more than once per bar or realtime tick. Parameters: source (series float) : The source series to analyze. The function stores each value in the series with an associated timestamp representing its corresponding bar's opening time. timeOffset (series int) : The millisecond offset behind the bar's opening time. The function returns data for the earliest bar's timestamp that is closest to the calculated offset time. timeOffsetLimit (simple int) : Optional. A time offset (range) in milliseconds. If specified, the function limits the collected data to the maximum number of bars covered by the range, with a minimum of one bar. If the call includes a non-empty `timeframeLimit` value, the function limits the data using the largest number of bars covered by the two ranges. The default is `na`. timeframeLimit (simple string) : Optional. A valid timeframe string. If specified and not empty, the function limits the collected data to the maximum number of bars covered by the timeframe, with a minimum of one bar. If the call includes a non-na `timeOffsetLimit` value, the function limits the data using the largest number of bars covered by the two ranges. The default is `na`. Returns: ( ) A tuple containing the following data: - The `source` value corresponding to the identified timestamp ("float"). - The earliest bar's timestamp that is closest to `timeOffset` milliseconds before the current bar's opening time ("int"). - The current bar's `source` value ("float"). method valueAtPeriodOffset(data, period) (Overload 1 of 2) Retrieves value and time data from a `Data` object's fields at the index of the earliest timestamp closest to a calculated offset behind the current bar's opening time. The calculated offset represents the amount of time covered by the specified `period`. Callable as a method or a function. Parameters: data (series Data) : The `Data` object containing the collected time and value data. period (series string) : The period string, which determines the calculated time offset. The specified argument must contain a unit and an optional multiplier (e.g., "1Y", "3M", "2W", "YTD"). Supported units are: - "Y" for years. - "M" for months. - "W" for weeks. - "D" for days. - "YTD" (Year-to-date) for the span from the start of the current bar's year in the exchange time zone. An argument with this unit cannot contain a multiplier. Returns: ( ) A tuple containing the following data from the `Data` object: - The stored value corresponding to the identified timestamp ("float"). - The earliest saved timestamp that is closest to the calculated offset behind the bar's opening time ("int"). valueAtPeriodOffset(source, period, timeOffsetLimit, timeframeLimit) (Overload 2 of 2) Retrieves `source` and time information for the earliest bar whose opening timestamp is closest to a calculated offset behind the current bar's opening time. The calculated offset represents the amount of time covered by the specified `period`. Any call to this function cannot execute more than once per bar or realtime tick. Parameters: source (series float) : The source series to analyze. The function stores each value in the series with an associated timestamp representing its corresponding bar's opening time. period (series string) : The period string, which determines the calculated time offset. The specified argument must contain a unit and an optional multiplier (e.g., "1Y", "3M", "2W", "YTD"). Supported units are: - "Y" for years. - "M" for months. - "W" for weeks. - "D" for days. - "YTD" (Year-to-date) for the span from the start of the current bar's year in the exchange time zone. An argument with this unit cannot contain a multiplier. timeOffsetLimit (simple int) : Optional. A time offset (range) in milliseconds. If specified, the function limits the collected data to the maximum number of bars covered by the range, with a minimum of one bar. If the call includes a non-empty `timeframeLimit` value, the function limits the data using the largest number of bars covered by the two ranges. The default is `na`. timeframeLimit (simple string) : Optional. A valid timeframe string. If specified and not empty, the function limits the collected data to the maximum number of bars covered by the timeframe, with a minimum of one bar. If the call includes a non-na `timeOffsetLimit` value, the function limits the data using the largest number of bars covered by the two ranges. The default is `na`. Returns: ( ) A tuple containing the following data: - The `source` value corresponding to the identified timestamp ("float"). - The earliest bar's timestamp that is closest to the calculated offset behind the current bar's opening time ("int"). - The current bar's `source` value ("float"). getDataAtTimes(timestamps, source, timeOffsetLimit, timeframeLimit) Retrieves `source` and time information for each bar whose opening timestamp is the earliest one closest to one of the UNIX timestamps specified in the `timestamps` array. Any call to this function cannot execute more than once per bar or realtime tick. Parameters: timestamps (array) : An array of "int" values representing UNIX timestamps. The function retrieves `source` and time data for each element in this array. source (series float) : The source series to analyze. The function stores each value in the series with an associated timestamp representing its corresponding bar's opening time. timeOffsetLimit (simple int) : Optional. A time offset (range) in milliseconds. If specified, the function limits the collected data to the maximum number of bars covered by the range, with a minimum of one bar. If the call includes a non-empty `timeframeLimit` value, the function limits the data using the largest number of bars covered by the two ranges. The default is `na`. timeframeLimit (simple string) : Optional. A valid timeframe string. If specified and not empty, the function limits the collected data to the maximum number of bars covered by the timeframe, with a minimum of one bar. If the call includes a non-na `timeOffsetLimit` value, the function limits the data using the largest number of bars covered by the two ranges. The default is `na`. Returns: ( ) A tuple of the following data: - An array containing a `source` value for each identified timestamp (array). - An array containing an identified timestamp for each item in the `timestamps` array (array). - The current bar's `source` value ("float"). - The symbol's description from `syminfo.description` ("string"). getDataAtTimeOffsets(timeOffsets, source, timeOffsetLimit, timeframeLimit) Retrieves `source` and time information for each bar whose opening timestamp is the earliest one closest to one of the time offsets specified in the `timeOffsets` array. Each offset in the array represents the absolute number of milliseconds behind the current bar's opening time. Any call to this function cannot execute more than once per bar or realtime tick. Parameters: timeOffsets (array) : An array of "int" values representing the millisecond time offsets used in the search. The function retrieves `source` and time data for each element in this array. For example, the array ` ` specifies that the function returns data for the timestamps closest to one day and one week behind the current bar's opening time. source (float) : (series float) The source series to analyze. The function stores each value in the series with an associated timestamp representing its corresponding bar's opening time. timeOffsetLimit (simple int) : Optional. A time offset (range) in milliseconds. If specified, the function limits the collected data to the maximum number of bars covered by the range, with a minimum of one bar. If the call includes a non-empty `timeframeLimit` value, the function limits the data using the largest number of bars covered by the two ranges. The default is `na`. timeframeLimit (simple string) : Optional. A valid timeframe string. If specified and not empty, the function limits the collected data to the maximum number of bars covered by the timeframe, with a minimum of one bar. If the call includes a non-na `timeOffsetLimit` value, the function limits the data using the largest number of bars covered by the two ranges. The default is `na`. Returns: ( ) A tuple of the following data: - An array containing a `source` value for each identified timestamp (array). - An array containing an identified timestamp for each offset specified in the `timeOffsets` array (array). - The current bar's `source` value ("float"). - The symbol's description from `syminfo.description` ("string"). getDataAtPeriodOffsets(periods, source, timeOffsetLimit, timeframeLimit) Retrieves `source` and time information for each bar whose opening timestamp is the earliest one closest to a calculated offset behind the current bar's opening time. Each calculated offset represents the amount of time covered by a period specified in the `periods` array. Any call to this function cannot execute more than once per bar or realtime tick. Parameters: periods (array) : An array of period strings, which determines the time offsets used in the search. The function retrieves `source` and time data for each element in this array. For example, the array ` ` specifies that the function returns data for the timestamps closest to one day, week, and month behind the current bar's opening time. Each "string" in the array must contain a unit and an optional multiplier. Supported units are: - "Y" for years. - "M" for months. - "W" for weeks. - "D" for days. - "YTD" (Year-to-date) for the span from the start of the current bar's year in the exchange time zone. An argument with this unit cannot contain a multiplier. source (float) : (series float) The source series to analyze. The function stores each value in the series with an associated timestamp representing its corresponding bar's opening time. timeOffsetLimit (simple int) : Optional. A time offset (range) in milliseconds. If specified, the function limits the collected data to the maximum number of bars covered by the range, with a minimum of one bar. If the call includes a non-empty `timeframeLimit` value, the function limits the data using the largest number of bars covered by the two ranges. The default is `na`. timeframeLimit (simple string) : Optional. A valid timeframe string. If specified and not empty, the function limits the collected data to the maximum number of bars covered by the timeframe, with a minimum of one bar. If the call includes a non-na `timeOffsetLimit` value, the function limits the data using the largest number of bars covered by the two ranges. The default is `na`. Returns: ( ) A tuple of the following data: - An array containing a `source` value for each identified timestamp (array). - An array containing an identified timestamp for each period specified in the `periods` array (array). - The current bar's `source` value ("float"). - The symbol's description from `syminfo.description` ("string"). ไลบรารี Pine Script®โดย TradingViewที่อัปเดต: 11128
waves█ OVERVIEW This library intended for use in Bar Replay provides functions to generate various wave forms (sine, cosine, triangle, square) based on time and customizable parameters. Useful for testing and in creating oscillators, indicators, or visual effects. █ FUNCTIONS • getSineWave() • getCosineWave() • getTriangleWave() • getSquareWave() █ USAGE EXAMPLE //@version=6 indicator("Wave Example") import kaigouthro/waves/1 plot(waves.getSineWave(cyclesPerMinute=15)) █ NOTES * barsPerSecond defaults to 10. Adjust this if not using 10x in Bar Replay. * Phase shift is in degrees. --- Library "waves" getSineWave(cyclesPerMinute, bar, barsPerSecond, amplitude, verticalShift, phaseShift) `getSineWave` > Calculates a sine wave based on bar index, cycles per minute (BPM), and wave parameters. Parameters: cyclesPerMinute (float) : (float) The desired number of cycles per minute (BPM). Default is 30.0. bar (int) : (int) The current bar index. Default is bar_index. barsPerSecond (float) : (float) The number of bars per second. Default is 10.0 for Bar Replay amplitude (float) : (float) The amplitude of the sine wave. Default is 1.0. verticalShift (float) : (float) The vertical shift of the sine wave. Default is 0.0. phaseShift (float) : (float) The phase shift of the sine wave in radians. Default is 0.0. Returns: (float) The calculated sine wave value. getCosineWave(cyclesPerMinute, bar, barsPerSecond, amplitude, verticalShift, phaseShift) `getCosineWave` > Calculates a cosine wave based on bar index, cycles per minute (BPM), and wave parameters. Parameters: cyclesPerMinute (float) : (float) The desired number of cycles per minute (BPM). Default is 30.0. bar (int) : (int) The current bar index. Default is bar_index. barsPerSecond (float) : (float) The number of bars per second. Default is 10.0 for Bar Replay amplitude (float) : (float) The amplitude of the cosine wave. Default is 1.0. verticalShift (float) : (float) The vertical shift of the cosine wave. Default is 0.0. phaseShift (float) : (float) The phase shift of the cosine wave in radians. Default is 0.0. Returns: (float) The calculated cosine wave value. getTriangleWave(cyclesPerMinute, bar, barsPerSecond, amplitude, verticalShift, phaseShift) `getTriangleWave` > Calculates a triangle wave based on bar index, cycles per minute (BPM), and wave parameters. Parameters: cyclesPerMinute (float) : (float) The desired number of cycles per minute (BPM). Default is 30.0. bar (int) : (int) The current bar index. Default is bar_index. barsPerSecond (float) : (float) The number of bars per second. Default is 10.0 for Bar Replay amplitude (float) : (float) The amplitude of the triangle wave. Default is 1.0. verticalShift (float) : (float) The vertical shift of the triangle wave. Default is 0.0. phaseShift (float) : (float) The phase shift of the triangle wave in radians. Default is 0.0. Returns: (float) The calculated triangle wave value. getSquareWave(cyclesPerMinute, bar, barsPerSecond, amplitude, verticalShift, dutyCycle, phaseShift) `getSquareWave` > Calculates a square wave based on bar index, cycles per minute (BPM), and wave parameters. Parameters: cyclesPerMinute (float) : (float) The desired number of cycles per minute (BPM). Default is 30.0. bar (int) : (int) The current bar index. Default is bar_index. barsPerSecond (float) : (float) The number of bars per second. Default is 10.0 for Bar Replay amplitude (float) : (float) The amplitude of the square wave. Default is 1.0. verticalShift (float) : (float) The vertical shift of the square wave. Default is 0.0. dutyCycle (float) : (float) The duty cycle of the square wave (0.0 to 1.0). Default is 0.5 (50% duty cycle). phaseShift (float) : (float) The phase shift of the square wave in radians. Default is 0.0. Returns: (float) The calculated square wave value.ไลบรารี Pine Script®โดย kaigouthroที่อัปเดต: 21
utilsLibrary "utils" Few essentials captured together (subset of arrayutils) timer(timeStart, timeEnd) finds difference between two timestamps Parameters: timeStart (int) : start timestamp timeEnd (int) Returns: method check_overflow(pivots, barArray, dir) finds difference between two timestamps Namespace types: array Parameters: pivots (array) : pivots array barArray (array) : pivot bar array dir (int) : direction for which overflow need to be checked Returns: bool overflow method get_trend_series(pivots, length, highLow, trend) finds series of pivots in particular trend Namespace types: array Parameters: pivots (array) : pivots array length (int) : length for which trend series need to be checked highLow (int) : filter pivot high or low trend (int) : Uptrend or Downtrend Returns: int trendIndexes method get_trend_series(pivots, firstIndex, lastIndex) finds series of pivots in particular trend Namespace types: array Parameters: pivots (array) : pivots array firstIndex (int) : First index of the series lastIndex (int) : Last index of the series Returns: int trendIndexes getConsolidatedLabel(include, labels, separator) Consolidates labels into single string by concatenating it with given separator Parameters: include (array) : array of conditions to include label or not labels (array) : string array of labels separator (string) : Separator for concatenating labels Returns: string labelText method getColors(theme) gets array of colors based on theme Namespace types: series Theme Parameters: theme (series Theme) : dark or light theme Returns: color themeColorsไลบรารี Pine Script®โดย Trendoscopeที่อัปเดต: 24
Trading IQ - ICT LibraryLibrary "ICTlibrary" Used to calculate various ICT related price levels and strategies. An ongoing project. Hello Coders! This library is meant for sourcing ICT related concepts. While some functions might generate more output than you require, you can specify "Lite Mode" as "true" in applicable functions to slim down necessary inputs. isLastBar(userTF) Identifies the last bar on the chart before a timeframe change Parameters: userTF (simple int) : the timeframe you wish to calculate the last bar for, must be converted to integer using 'timeframe.in_seconds()' Returns: bool true if bar on chart is last bar of higher TF, dalse if bar on chart is not last bar of higher TF necessaryData(atrTF) returns necessaryData UDT for historical data access Parameters: atrTF (float) : user-selected timeframe ATR value. Returns: logZ. log return Z score, used for calculating order blocks. method gradBoxes(gradientBoxes, idColor, timeStart, bottom, top, rightCoordinate) creates neon like effect for box drawings Namespace types: array Parameters: gradientBoxes (array) : an array.new() to store the gradient boxes idColor (color) timeStart (int) : left point of box bottom (float) : bottom of box price point top (float) : top of box price point rightCoordinate (int) : right point of box Returns: void checkIfTraded(tradeName) checks if recent trade is of specific name Parameters: tradeName (string) Returns: bool true if recent trade id matches target name, false otherwise checkIfClosed(tradeName) checks if recent closed trade is of specific name Parameters: tradeName (string) Returns: bool true if recent closed trade id matches target name, false otherwise IQZZ(atrMult, finalTF) custom ZZ to quickly determine market direction. Parameters: atrMult (float) : an atr multiplier used to determine the required price move for a ZZ direction change finalTF (string) : the timeframe used for the atr calcuation Returns: dir market direction. Up => 1, down => -1 method drawBos(id, startPoint, getKeyPointTime, getKeyPointPrice, col, showBOS, isUp) calculates and draws Break Of Structure Namespace types: array Parameters: id (array) startPoint (chart.point) getKeyPointTime (int) : the actual time of startPoint, simplystartPoint.time getKeyPointPrice (float) : the actual time of startPoint, simplystartPoint.price col (color) : color of the BoS line / label showBOS (bool) : whether to show label/line. This function still calculates internally for other ICT related concepts even if not drawn. isUp (bool) : whether BoS happened during price increase or price decrease. Returns: void method drawMSS(id, startPoint, getKeyPointTime, getKeyPointPrice, col, showMSS, isUp, upRejections, dnRejections, highArr, lowArr, timeArr, closeArr, openArr, atrTFarr, upRejectionsPrices, dnRejectionsPrices) calculates and draws Market Structure Shift. This data is also used to calculate Rejection Blocks. Namespace types: array Parameters: id (array) startPoint (chart.point) getKeyPointTime (int) : the actual time of startPoint, simplystartPoint.time getKeyPointPrice (float) : the actual time of startPoint, simplystartPoint.price col (color) : color of the MSS line / label showMSS (bool) : whether to show label/line. This function still calculates internally for other ICT related concepts even if not drawn. isUp (bool) : whether MSS happened during price increase or price decrease. upRejections (array) dnRejections (array) highArr (array) : array containing historical highs, should be taken from the UDT "necessaryData" defined above lowArr (array) : array containing historical lows, should be taken from the UDT "necessaryData" defined above timeArr (array) : array containing historical times, should be taken from the UDT "necessaryData" defined above closeArr (array) : array containing historical closes, should be taken from the UDT "necessaryData" defined above openArr (array) : array containing historical opens, should be taken from the UDT "necessaryData" defined above atrTFarr (array) : array containing historical atr values (of user-selected TF), should be taken from the UDT "necessaryData" defined above upRejectionsPrices (array) : array containing up rejections prices. Is sorted and used to determine selective looping for invalidations. dnRejectionsPrices (array) : array containing down rejections prices. Is sorted and used to determine selective looping for invalidations. Returns: void method getTime(id, compare, timeArr) gets time of inputted price (compare) in an array of data this is useful when the user-selected timeframe for ICT concepts is greater than the chart's timeframe Namespace types: array Parameters: id (array) : the array of data to search through, to find which index has the same value as "compare" compare (float) : the target data point to find in the array timeArr (array) : array of historical times Returns: the time that the data point in the array was recorded method OB(id, highArr, signArr, lowArr, timeArr, sign) store bullish orderblock data Namespace types: array Parameters: id (array) highArr (array) : array of historical highs signArr (array) : array of historical price direction "math.sign(close - open)" lowArr (array) : array of historical lows timeArr (array) : array of historical times sign (int) : orderblock direction, -1 => bullish, 1 => bearish Returns: void OTEstrat(OTEstart, future, closeArr, highArr, lowArr, timeArr, longOTEPT, longOTESL, longOTElevel, shortOTEPT, shortOTESL, shortOTElevel, structureDirection, oteLongs, atrTF, oteShorts) executes the OTE strategy Parameters: OTEstart (chart.point) future (int) : future time point for drawings closeArr (array) : array of historical closes highArr (array) : array of historical highs lowArr (array) : array of historical lows timeArr (array) : array of historical times longOTEPT (string) : user-selected long OTE profit target, please create an input.string() for this using the example below longOTESL (int) : user-selected long OTE stop loss, please create an input.string() for this using the example below longOTElevel (float) : long entry price of selected retracement ratio for OTE shortOTEPT (string) : user-selected short OTE profit target, please create an input.string() for this using the example below shortOTESL (int) : user-selected short OTE stop loss, please create an input.string() for this using the example below shortOTElevel (float) : short entry price of selected retracement ratio for OTE structureDirection (string) : current market structure direction, this should be "Up" or "Down". This is used to cancel pending orders if market structure changes oteLongs (bool) : input.bool() for whether OTE longs can be executed atrTF (float) : atr of the user-seleceted TF oteShorts (bool) : input.bool() for whether OTE shorts can be executed @exampleInputs oteLongs = input.bool(defval = false, title = "OTE Longs", group = "Optimal Trade Entry") longOTElevel = input.float(defval = 0.79, title = "Long Entry Retracement Level", options = , group = "Optimal Trade Entry") longOTEPT = input.string(defval = "-0.5", title = "Long TP", options = , group = "Optimal Trade Entry") longOTESL = input.int(defval = 0, title = "How Many Ticks Below Swing Low For Stop Loss", group = "Optimal Trade Entry") oteShorts = input.bool(defval = false, title = "OTE Shorts", group = "Optimal Trade Entry") shortOTElevel = input.float(defval = 0.79, title = "Short Entry Retracement Level", options = , group = "Optimal Trade Entry") shortOTEPT = input.string(defval = "-0.5", title = "Short TP", options = , group = "Optimal Trade Entry") shortOTESL = input.int(defval = 0, title = "How Many Ticks Above Swing Low For Stop Loss", group = "Optimal Trade Entry") Returns: void (0) displacement(logZ, atrTFreg, highArr, timeArr, lowArr, upDispShow, dnDispShow, masterCoords, labelLevels, dispUpcol, rightCoordinate, dispDncol, noBorders) calculates and draws dispacements Parameters: logZ (float) : log return of current price, used to determine a "significant price move" for a displacement atrTFreg (float) : atr of user-seleceted timeframe highArr (array) : array of historical highs timeArr (array) : array of historical times lowArr (array) : array of historical lows upDispShow (int) : amount of historical upside displacements to show dnDispShow (int) : amount of historical downside displacements to show masterCoords (map) : a map to push the most recent displacement prices into, useful for having key levels in one data structure labelLevels (string) : used to determine label placement for the displacement, can be inside box, outside box, or none, example below dispUpcol (color) : upside displacement color rightCoordinate (int) : future time for displacement drawing, best is "last_bar_time" dispDncol (color) : downside displacement color noBorders (bool) : input.bool() to remove box borders, example below @exampleInputs labelLevels = input.string(defval = "Inside" , title = "Box Label Placement", options = ) noBorders = input.bool(defval = false, title = "No Borders On Levels") Returns: void method getStrongLow(id, startIndex, timeArr, lowArr, strongLowPoints) unshift strong low data to array id Namespace types: array Parameters: id (array) startIndex (int) : the starting index for the timeArr array of the UDT "necessaryData". this point should start from at least 1 pivot prior to find the low before an upside BoS timeArr (array) : array of historical times lowArr (array) : array of historical lows strongLowPoints (array) : array of strong low prices. Used to retrieve highest strong low price and see if need for removal of invalidated strong lows Returns: void method getStrongHigh(id, startIndex, timeArr, highArr, strongHighPoints) unshift strong high data to array id Namespace types: array Parameters: id (array) startIndex (int) : the starting index for the timeArr array of the UDT "necessaryData". this point should start from at least 1 pivot prior to find the high before a downside BoS timeArr (array) : array of historical times highArr (array) : array of historical highs strongHighPoints (array) Returns: void equalLevels(highArr, lowArr, timeArr, rightCoordinate, equalHighsCol, equalLowsCol, liteMode) used to calculate recent equal highs or equal lows Parameters: highArr (array) : array of historical highs lowArr (array) : array of historical lows timeArr (array) : array of historical times rightCoordinate (int) : a future time (right for boxes, x2 for lines) equalHighsCol (color) : user-selected color for equal highs drawings equalLowsCol (color) : user-selected color for equal lows drawings liteMode (bool) : optional for a lite mode version of an ICT strategy. For more control over drawings leave as "True", "False" will apply neon effects Returns: void quickTime(timeString) used to quickly determine if a user-inputted time range is currently active in NYT time Parameters: timeString (string) : a time range Returns: true if session is active, false if session is inactive macros(showMacros, noBorders) used to calculate and draw session macros Parameters: showMacros (bool) : an input.bool() or simple bool to determine whether to activate the function noBorders (bool) : an input.bool() to determine whether the box anchored to the session should have borders Returns: void po3(tf, left, right, show) use to calculate HTF po3 candle @tip only call this function on "barstate.islast" Parameters: tf (simple string) left (int) : the left point of the candle, calculated as bar_index + left, right (int) : :the right point of the candle, calculated as bar_index + right, show (bool) : input.bool() whether to show the po3 candle or not Returns: void silverBullet(silverBulletStratLong, silverBulletStratShort, future, userTF, H, L, H2, L2, noBorders, silverBulletLongTP, historicalPoints, historicalData, silverBulletLongSL, silverBulletShortTP, silverBulletShortSL) used to execute the Silver Bullet Strategy Parameters: silverBulletStratLong (simple bool) silverBulletStratShort (simple bool) future (int) : a future time, used for drawings, example "last_bar_time" userTF (simple int) H (float) : the high price of the user-selected TF L (float) : the low price of the user-selected TF H2 (float) : the high price of the user-selected TF L2 (float) : the low price of the user-selected TF noBorders (bool) : an input.bool() used to remove the borders from box drawings silverBulletLongTP (series silverBulletLevels) historicalPoints (array) historicalData (necessaryData) silverBulletLongSL (series silverBulletLevels) silverBulletShortTP (series silverBulletLevels) silverBulletShortSL (series silverBulletLevels) Returns: void method invalidFVGcheck(FVGarr, upFVGpricesSorted, dnFVGpricesSorted) check if existing FVGs are still valid Namespace types: array Parameters: FVGarr (array) upFVGpricesSorted (array) : an array of bullish FVG prices, used to selective search through FVG array to remove invalidated levels dnFVGpricesSorted (array) : an array of bearish FVG prices, used to selective search through FVG array to remove invalidated levels Returns: void (0) method drawFVG(counter, FVGshow, FVGname, FVGcol, data, masterCoords, labelLevels, borderTransp, liteMode, rightCoordinate) draws FVGs on last bar Namespace types: map Parameters: counter (map) : a counter, as map, keeping count of the number of FVGs drawn, makes sure that there aren't more FVGs drawn than int FVGshow FVGshow (int) : the number of FVGs to show. There should be a bullish FVG show and bearish FVG show. This function "drawFVG" is used separately for bearish FVG and bullish FVG. FVGname (string) : the name of the FVG, "FVG Up" or "FVG Down" FVGcol (color) : desired FVG color data (FVG) masterCoords (map) : a map containing the names and price points of key levels. Used to define price ranges. labelLevels (string) : an input.string with options "Inside", "Outside", "Remove". Determines whether FVG labels should be inside box, outside, or na. borderTransp (int) liteMode (bool) rightCoordinate (int) : the right coordinate of any drawings. Must be a time point. Returns: void invalidBlockCheck(bullishOBbox, bearishOBbox, userTF) check if existing order blocks are still valid Parameters: bullishOBbox (array) : an array declared using the UDT orderBlock that contains bullish order block related data bearishOBbox (array) : an array declared using the UDT orderBlock that contains bearish order block related data userTF (simple int) Returns: void (0) method lastBarRejections(id, rejectionColor, idShow, rejectionString, labelLevels, borderTransp, liteMode, rightCoordinate, masterCoords) draws rejectionBlocks on last bar Namespace types: array Parameters: id (array) : the array, an array of rejection block data declared using the UDT rejection block rejectionColor (color) : the desired color of the rejection box idShow (int) rejectionString (string) : the desired name of the rejection blocks labelLevels (string) : an input.string() to determine if labels for the block should be inside the box, outside, or none. borderTransp (int) liteMode (bool) : an input.bool(). True = neon effect, false = no neon. rightCoordinate (int) : atime for the right coordinate of the box masterCoords (map) : a map that stores the price of key levels and assigns them a name, used to determine price ranges Returns: void method OBdraw(id, OBshow, BBshow, OBcol, BBcol, bullishString, bearishString, isBullish, labelLevels, borderTransp, liteMode, rightCoordinate, masterCoords) draws orderblocks and breaker blocks for data stored in UDT array() Namespace types: array Parameters: id (array) : the array, an array of order block data declared using the UDT orderblock OBshow (int) : the number of order blocks to show BBshow (int) : the number of breaker blocks to show OBcol (color) : color of order blocks BBcol (color) : color of breaker blocks bullishString (string) : the title of bullish blocks, which is a regular bullish orderblock or a bearish orderblock that's converted to breakerblock bearishString (string) : the title of bearish blocks, which is a regular bearish orderblock or a bullish orderblock that's converted to breakerblock isBullish (bool) : whether the array contains bullish orderblocks or bearish orderblocks. If bullish orderblocks, the array will naturally contain bearish BB, and if bearish OB, the array will naturally contain bullish BB labelLevels (string) : an input.string() to determine if labels for the block should be inside the box, outside, or none. borderTransp (int) liteMode (bool) : an input.bool(). True = neon effect, false = no neon. rightCoordinate (int) : atime for the right coordinate of the box masterCoords (map) : a map that stores the price of key levels and assigns them a name, used to determine price ranges Returns: void FVG UDT for FVG calcualtions Fields: H (series float) : high price of user-selected timeframe L (series float) : low price of user-selected timeframe direction (series string) : FVG direction => "Up" or "Down" T (series int) : => time of bar on user-selected timeframe where FVG was created fvgLabel (series label) : optional label for FVG fvgLineTop (series line) : optional line for top of FVG fvgLineBot (series line) : optional line for bottom of FVG fvgBox (series box) : optional box for FVG labelLine quickly pair a line and label together as UDT Fields: lin (series line) : Line you wish to pair with label lab (series label) : Label you wish to pair with line orderBlock UDT for order block calculations Fields: orderBlockData (array) : array containing order block x and y points orderBlockBox (series box) : optional order block box vioCount (series int) : = 0 violation count of the order block. 0 = Order Block, 1 = Breaker Block traded (series bool) status (series string) : = "OB" status == "OB" => Level is order block. status == "BB" => Level is breaker block. orderBlockLab (series label) : options label for the order block / breaker block. strongPoints UDT for strong highs and strong lows Fields: price (series float) : price of the strong high or strong low timeAtprice (series int) : time of the strong high or strong low strongPointLabel (series label) : optional label for strong point strongPointLine (series line) : optional line for strong point overlayLine (series line) : optional lines for strong point to enhance visibility overlayLine2 (series line) : optional lines for strong point to enhance visibility displacement UDT for dispacements Fields: highPrice (series float) : high price of displacement lowPrice (series float) : low price of displacement timeAtPrice (series int) : time of bar where displacement occurred displacementBox (series box) : optional box to draw displacement displacementLab (series label) : optional label for displacement po3data UDT for po3 calculations Fields: dHigh (series float) : higher timeframe high price dLow (series float) : higher timeframe low price dOpen (series float) : higher timeframe open price dClose (series float) : higher timeframe close price po3box (series box) : box to draw po3 candle body po3line (array) : line array to draw po3 wicks po3Labels (array) : label array to label price points of po3 candle macros UDT for session macros Fields: sessions (array) : Array of sessions, you can populate this array using the "quickTime" function located above "export macros". prices (matrix) : Matrix of session data -> open, high, low, close, time sessionTimes (array) : Array of session names. Pairs with array sessions. sessionLines (matrix) : Optional array for sesion drawings. OTEtimes UDT for data storage and drawings associated with OTE strategy Fields: upTimes (array) : time of highest point before trade is taken dnTimes (array) : time of lowest point before trade is taken tpLineLong (series line) : line to mark tp level long tpLabelLong (series label) : label to mark tp level long slLineLong (series line) : line to mark sl level long slLabelLong (series label) : label to mark sl level long tpLineShort (series line) : line to mark tp level short tpLabelShort (series label) : label to mark tp level short slLineShort (series line) : line to mark sl level short slLabelShort (series label) : label to mark sl level short sweeps UDT for data storage and drawings associated with liquidity sweeps Fields: upSweeps (matrix) : matrix containing liquidity sweep price points and time points for up sweeps dnSweeps (matrix) : matrix containing liquidity sweep price points and time points for down sweeps upSweepDrawings (array) : optional up sweep box array. Pair the size of this array with the rows or columns, dnSweepDrawings (array) : optional up sweep box array. Pair the size of this array with the rows or columns, raidExitDrawings UDT for drawings associated with the Liquidity Raid Strategy Fields: tpLine (series line) : tp line for the liquidity raid entry tpLabel (series label) : tp label for the liquidity raid entry slLine (series line) : sl line for the liquidity raid entry slLabel (series label) : sl label for the liquidity raid entry m2022 UDT for data storage and drawings associated with the Model 2022 Strategy Fields: mTime (series int) : time of the FVG where entry limit order is placed mIndex (series int) : array index of FVG where entry limit order is placed. This requires an array of FVG data, which is defined above. mEntryDistance (series float) : the distance of the FVG to the 50% range. M2022 looks for the fvg closest to 50% mark of range. mEntry (series float) : the entry price for the most eligible fvg fvgHigh (series float) : the high point of the eligible fvg fvgLow (series float) : the low point of the eligible fvg longFVGentryBox (series box) : long FVG box, used to draw the eligible FVG shortFVGentryBox (series box) : short FVG box, used to draw the eligible FVG line50P (series line) : line used to mark 50% of the range line100P (series line) : line used to mark 100% (top) of the range line0P (series line) : line used to mark 0% (bottom) of the range label50P (series label) : label used to mark 50% of the range label100P (series label) : label used to mark 100% (top) of the range label0P (series label) : label used to mark 0% (bottom) of the range sweepData (array) silverBullet UDT for data storage and drawings associated with the Silver Bullet Strategy Fields: session (series bool) sessionStr (series string) : name of the session for silver bullet sessionBias (series string) sessionHigh (series float) : = high high of session // use math.max(silverBullet.sessionHigh, high) sessionLow (series float) : = low low of session // use math.min(silverBullet.sessionLow, low) sessionFVG (series float) : if applicable, the FVG created during the session sessionFVGdraw (series box) : if applicable, draw the FVG created during the session traded (series bool) tp (series float) : tp of trade entered at the session FVG sl (series float) : sl of trade entered at the session FVG sessionDraw (series box) : optional draw session with box sessionDrawLabel (series label) : optional label session with label silverBulletDrawings UDT for trade exit drawings associated with the Silver Bullet Strategy Fields: tpLine (series line) : tp line drawing for strategy tpLabel (series label) : tp label drawing for strategy slLine (series line) : sl line drawing for strategy slLabel (series label) : sl label drawing for strategy unicornModel UDT for data storage and drawings associated with the Unicorn Model Strategy Fields: hPoint (chart.point) hPoint2 (chart.point) hPoint3 (chart.point) breakerBlock (series box) : used to draw the breaker block required for the Unicorn Model FVG (series box) : used to draw the FVG required for the Unicorn model topBlock (series float) : price of top of breaker block, can be used to detail trade entry botBlock (series float) : price of bottom of breaker block, can be used to detail trade entry startBlock (series int) : start time of the breaker block, used to set the "left = " param for the box includes (array) : used to store the time of the breaker block, or FVG, or the chart point sequence that setup the Unicorn Model. entry (series float) : // eligible entry price, for longs"math.max(topBlock, FVG.get_top())", tpLine (series line) : optional line to mark PT tpLabel (series label) : optional label to mark PT slLine (series line) : optional line to mark SL slLabel (series label) : optional label to mark SL rejectionBlocks UDT for data storage and drawings associated with rejection blocks Fields: rejectionPoint (chart.point) bodyPrice (series float) : candle body price closest to the rejection point, for "Up" rejections => math.max(open, close), rejectionBox (series box) : optional box drawing of the rejection block rejectionLabel (series label) : optional label for the rejection block equalLevelsDraw UDT for data storage and drawings associated with equal highs / equal lows Fields: connector (series line) : single line placed at the first high or low, y = avgerage of distinguished equal highs/lows connectorLab (series label) : optional label to be placed at the highs or lows levels (array) : array containing the equal highs or lows prices times (array) : array containing the equal highs or lows individual times startTime (series int) : the time of the first high or low that forms a sequence of equal highs or lows radiate (array) : options label to "radiate" the label in connector lab. Can be used for anything necessaryData UDT for data storage of historical price points. Fields: highArr (array) : array containing historical high points lowArr (array) : array containing historical low points timeArr (array) : array containing historical time points logArr (array) : array containing historical log returns signArr (array) : array containing historical price directions closeArr (array) : array containing historical close points binaryTimeArr (array) : array containing historical time points, uses "push" instead of "unshift" to allow for binary search binaryCloseArr (array) : array containing historical close points, uses "push" instead of "unshift" to allow the correct binaryOpenArr (array) : array containing historical optn points, uses "push" instead of "unshift" to allow the correct atrTFarr (array) : array containing historical user-selected TF atr points openArr (array) : array containing historical open pointsไลบรารี Pine Script®โดย Trading-IQ11134
TimeLibraryLibrary "TimeLibrary" TODO: add library description here Line_Type_Control(Type) Line_Type_Control: This function changes between common line types options available are "Solid","Dashed","Dotted" Parameters: Type (string) : : The string to choose the line type from Returns: Line_Type : returns the pine script equivalent of the string input Text_Size_Switch(Text_Size) Text_Size_Switch : This function changes between common text sizes options are "Normal", "Tiny", "Small", "Large", "Huge", "Auto" Parameters: Text_Size (string) : : The string to choose the text type from Returns: Text_Type : returns the pine script equivalent of the string input TF(TF_Period, TF_Multip) TF generates a string representation of a time frame based on the provided time frame unit (`TF_Period`) and multiplier (`TF_Multip`). Parameters: TF_Period (simple string) TF_Multip (simple int) Returns: A string that represents the time frame in Pine Script format, depending on the `TF_Period`: - For "Minute", it returns the multiplier as a string (e.g., "5" for 5 minutes). - For "Hour", it returns the equivalent number of minutes (e.g., "120" for 2 hours). - For "Day", it appends "D" to the multiplier (e.g., "2D" for 2 days). - For "Week", it appends "W" to the multiplier (e.g., "1W" for 1 week). - For "Month", it appends "M" to the multiplier (e.g., "3M" for 3 months). If none of these cases match, it returns the current chart's time frame. TF_Display(Chart_as_Timeframe, TF_Period, TF_Multip) TF_Display generates a string representation of a time frame based on user-defined inputs or the current chart's time frame settings. Parameters: Chart_as_Timeframe (bool) : (bool): Determines whether to use the current chart's time frame or a custom time frame. TF_Period` (string): The time frame unit (e.g., "Minute", "Hour", "Day", "Week", "Month"). TF_Multip` (int): The multiplier for the time frame (e.g., 15 for 15 minutes, 2 for 2 days). TF_Period (string) TF_Multip (int) Returns: If `Chart_as_Timeframe` is `false`, the function returns a time frame string based on the provided `TF_Period` and `TF_Multip` values (e.g., "5Min", "2D"). If `Chart_as_Timeframe` is `true`, the function determines the current chart's time frame and returns it as a string: For minute-based time frames, it returns the number of minutes with "Min" (e.g., "15Min") unless it's an exact hour, in which case it returns the hour (e.g., "1H"). For daily, weekly, and monthly time frames, it returns the multiplier with the appropriate unit (e.g., "1D" for daily, "1W" for weekly, "1M" for monthly). MTF_MS_Display(Chart_as_Timeframe, TF_Period, TF_Multip, Swing_Length) MTF_MS_Display This function calculates and returns a modified swing length value based on the selected time frame and current chart's time frame. Parameters: Chart_as_Timeframe (bool) TF_Period (string) TF_Multip (int) Swing_Length (int) HTF_Structure_Control(Chart_as_Timeframe, Show_Only_On_Lower_Timeframes, TF_Period, TF_Multip) Parameters: Chart_as_Timeframe (bool) Show_Only_On_Lower_Timeframes (bool) TF_Period (string) TF_Multip (int)ไลบรารี Pine Script®โดย Lenny_Kiruthu338
Time Zone CorrectorThe Time Zone Corrector library provides a utility function designed to adjust time based on the user's current time zone. This library supports a wide range of time zones across the Americas, Europe, Asia, and Oceania, making it highly versatile for traders around the world. It simulates a switch-case structure using ternary operators to output the appropriate time offset relative to UTC. Whether you're dealing with market sessions in New York, Tokyo, London, or other major trading hubs, this library helps ensure your trading algorithms can accurately account for time differences. The library is particularly useful for strategies that rely on precise timing, as it dynamically adjusts the time zone offset depending on the symbol being traded.ไลบรารี Pine Script®โดย rajabitt23
SessionLibrary "Session" Helper functions for trading sessions. TradingView doesn't provide correct data when calling some of the convenience methods like session.ismarket when you are looking at futures charts. This library corrects those mistakes by providing functions with the same names as the TradingView default properties. that reference a custom defined set of session hours for futures. It also provides a way for consumers to customize the map values by calling getSessionMap() and then overwriting (or adding) custom session definitions. getSessionMap() Returns a map of the futures rth & eth session hours. The map is keyed with symbol:session format (eg. ES:market or ES:overnight). Returns: A map of futures symbols and their associated session hours. getSessionString(session, symbol, sessionMap) Returns a session string representing the session hours (and days) for the requested symbol (or the chart's symbol if the symbol value is not provided). If the session string is not found in the collection, it will return a blank string. Parameters: session (string) : A string representing the session hour being requested. One of: market (regular trading hours), overnight (extended/electronic trading hours), postmarket (after-hours), premarket symbol (string) : The symbol to check. Optional. Defaults to chart symbol. sessionMap (map) : The map of futures session hours. Optional. Uses default if not provided. inSession(session, sessionMap, barsBack) Returns true if the current symbol is currently in the session parameters defined by sessionString. Parameters: session (string) : A string representing the session hour being requested. One of: market (regular trading hours), overnight (extended/electronic trading hours), postmarket (after-hours), premarket sessionMap (map) : The map of futures session hours. Optional. Uses default if not provided. barsBack (int) : Private. Only used by futures to check islastbar. Optional. The default is 0. ismarket(sessionMap) Returns true if the current bar is a part of the regular trading hours (i.e. market hours), false otherwise. Works for futures (TradingView's methods do not). Parameters: sessionMap (map) : The map of futures session hours. Optional. Uses default if not provided. Returns: bool isfirstbar() Returns true if the current bar is the first bar of the day's session, false otherwise. If extended session information is used, only returns true on the first bar of the pre-market bars. Works for futures (TradingView's methods do not). Returns: bool islastbar() Returns true if the current bar is the last bar of the day's session, false otherwise. If extended session information is used, only returns true on the last bar of the post-market bars. Works for futures (TradingView's methods do not). Returns: bool ispremarket(sessionMap) Returns true if the current bar is a part of the pre-market, false otherwise. On non-intraday charts always returns false. Works for futures (TradingView's methods do not). Parameters: sessionMap (map) : The map of futures session hours. Optional. Uses default if not provided. Returns: bool ispostmarket(sessionMap) Returns true if the current bar is a part of the post-market, false otherwise. On non-intraday charts always returns false. Works for futures (TradingView's methods do not). Parameters: sessionMap (map) : The map of futures session hours. Optional. Uses default if not provided. Returns: bool isfirstbar_regular(sessionMap) Returns true on the first regular session bar of the day, false otherwise. The result is the same whether extended session information is used or not. Works for futures (TradingView's methods do not). Parameters: sessionMap (map) : The map of futures session hours. Optional. Uses default if not provided. Returns: bool islastbar_regular(sessionMap) Returns true on the last regular session bar of the day, false otherwise. The result is the same whether extended session information is used or not. Works for futures (TradingView's methods do not). Parameters: sessionMap (map) : The map of futures session hours. Optional. Uses default if not provided. Returns: bool isovernight(sessionMap) Returns true if the current bar is a part of the pre-market or post-market, false otherwise. On non-intraday charts always returns false. Parameters: sessionMap (map) : The map of futures session hours. Optional. Uses default if not provided. Returns: bool getSessionHighAndLow(session, sessionMap) Returns a tuple containing the high and low print during the specified session. Parameters: session (string) : The session for which to get the high & low prints. Defaults to market. sessionMap (map) : The map of futures session hours. Optional. Uses default if not provided. Returns: A tuple containing ไลบรารี Pine Script®โดย jmosullivanที่อัปเดต: 1114
offline_detection Library Description: Boolean and alert functions that check if the latest user-selected symbol 'sym' has started printing. Alerts trigger by bar close. Usage: Mainly for 24/7 crypto exchanges. If an exchange you have alerts on goes offline, the alerts will not trigger. The offline alert is an alert to alert you of that. It's best to create the alerts while on "CRYPTOCAP:TOTAL" because it has the least downtime. The exchange you want alerts on is controlled by the 'sym' parameter. The alerts need to be enabled yourself. Limitations: The alerts may be triggered by no volume in a bar, so it's best to set it on timeframes higher than 1 minute. Alerts are not enabled in libraries so the functions must be imported or copied into another script. alert.freq cannot be changed by input because it becomes a series string in a function. dynamic_requests must be true to export functions using `request.*()` calls. Example: import NeoButane/offline_detection/1 thing = "COINBASE:BTCUSD" offline_detection.offlineAlertNoSpam(thing) offline_detection.onlineAlert(thing) warningsign() Library "offline_detection" Creates alerts for the user-selected symbol by checking if its latest bar is current by comparing it against another chart. isItDown(sym) Checks if 'sym' is offline by requesting time of 'sym'. Parameters: sym (simple string) : (const string) The user-selected symbol in the form of "PREFIX:TICKER". Returns: True if time of 'sym' is not available. isItDownNoSpam(sym) Checks if 'sym' is offline by requesting time of 'sym' once. Parameters: sym (simple string) : (const string) The user-selected symbol in the form of "PREFIX:TICKER". Returns: True if time of 'sym' is not available and it was available in the previous bar close. isItUp(sym) Checks if 'sym' is online after being offline by using isItDown(). Parameters: sym (simple string) : (const string) The user-selected symbol in the form of "PREFIX:TICKER". Returns: True if time of 'sym' is available in the current bar but wasn't prior. offlineAlert(sym) Checks if isItDown() is true. Parameters: sym (simple string) : (const string) The user-selected symbol in the form of "PREFIX:TICKER". Returns: An alert when the symbol is not online and the time in UTC. This will continue triggering every bar close until the symbol is online. offlineAlertNoSpam(sym) Checks if isItDown() is true. Parameters: sym (simple string) : (const string) The user-selected symbol in the form of "PREFIX:TICKER". Returns: An alert when the symbol is not online and the time in UTC. onlineAlert(sym) Checks if isItUp() is true. Parameters: sym (simple string) : (const string) The user-selected symbol in the form of "PREFIX:TICKER". Returns: An alert when the symbol is now online and the time in UTC. warningsign() Checks if the current chart is "CRYPTOCAP:TOTAL". Returns: A reminder on the chart.ไลบรารี Pine Script®โดย NeoButane5
lib_session_gapsLibrary "lib_session_gaps" simple lib to calculate the gaps between sessions time_gap() calculates the time gap between this and previous session (in case of irregular end of previous session, considering extended sessions) Returns: the time gap between this and previous session in ms (time - time_close ) bar_gap() calculates the bars missing between this and previous session (in case of irregular end of previous session, considering extended sessions) Returns: the bars virtually missing between this and previous session (time gap / bar size in ms)ไลบรารี Pine Script®โดย robbatt12
SessionBoxLibrary "SessionBox" This library provides functions to manage and visualize session boxes and labels on chart. A session box is a visual representation of a trading session with properties like time, name, color and the ability to track the high and low price within that session. SessionBox SessionBox: stores session data and provides methods to manage that data and visualize it on the chart. Fields: session_time (series bool) session_name (series string) session_color (series color)ไลบรารี Pine Script®โดย jdraynesที่อัปเดต: 1