Put/Call RatioPut/Call Ratio Indicator
This indicator visualizes the Put/Call Ratio for various market symbols, helping traders assess market sentiment and potential reversals. It offers a dropdown menu to select from a range of Put/Call Ratios, including broad equities (CBOE), major indices (SPX, QQQ, IWM, VIX), and individual stocks (TSLA, GOOG, META, AMZN, MSFT, INTC).
The indicator plots the Put/Call Ratio with adjustable moving averages and standard deviation bands to highlight overbought or oversold conditions. A short-term moving average (default: 10 periods) is displayed with trend-based coloring, while longer-term moving averages (defaults: 30 and 200 periods) are calculated but hidden by default. Bands at 1, 1.5, and 2 standard deviations provide context for extreme readings.
Key Overbought/Oversold Signals:
Short-Term Extremes: The 10-day moving average moves beyond 1 standard deviation from the 200-day moving average, signaling potential overbought (above) or oversold (below) conditions. This will be highlighted by red or green background color.
Ratio Extremes: The Put/Call Ratio line itself crosses outside 2 standard deviations from the 200-day moving average, indicating stronger overbought or oversold zones.
Conditional coloring of the ratio line reflects its position relative to the bands, and background shading highlights when the short-term moving average crosses key levels.
Key Features:
Selectable Put/Call Ratio symbols.
Trend-colored moving averages.
Standard deviation bands for volatility analysis.
Dynamic line and background coloring for quick insights.
Usage:
Use this indicator to gauge market sentiment—high ratios may suggest bearish sentiment or oversold conditions, while low ratios may indicate bullish sentiment or overbought conditions. Combine with price action or other tools for confirmation.
Put-call-ratio

Accumulated Put/Call Ratio V2This is an updated version of the Accumulated P/C Ratio. Some changes include:
- Pinescript privacy changed from protected to open.
- Utilizes the "request.security_lower_tf" function for weekly and monthly charts.
- Now acquires and sums raw put volume (ticker: PVOL) and call volume (ticker: CVOL) separately, then divides the aggregate put to aggregate call to get the P/C ratio, as opposed to the original version which directly sums the put call ratio (ticker: PCC). Mathematically this calculation makes more sense, but the major drawback of this change seems to be that PVOL and CVOL don't have as much historical data as PCC.
The way to interpret the indicator is the same as the original version - higher values are bullish while lower values are bearish. A solid (0 transparency) bar means that the value is beyond 3 standard deviations within a particular period.

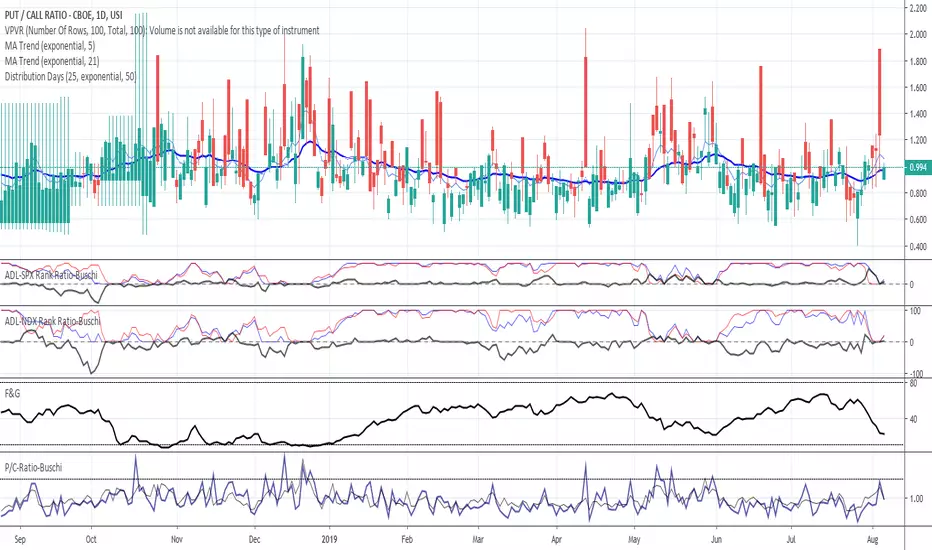
Put/Call-Ratio-Buschi
English:
This script shows the Put/Call-Ratio as seen on the Cboe-Website: www.cboe.com
A higher Put/Call-Ratio means a higher trading volume of puts compared to calls, which is a sign of a higher need for protection in the market.
For best reflection of the Cboe's data, which is shown in 30 minutes intervals, a 30 min-chart is recommended.
30 min-data as well as end-of-day data are shown.
Deutsch:
Dieses Skript zeigt das Put/Call Ratio, wie es auf der Cboe-Website angegeben ist: www.cboe.com
Ein höheres Put/Call Ratio bedeutet ein höheres Handelsvolumen von Puts gegenüber Calls, was ein Zeichen für Absicherungsbedarf im Markt darstellt.
Um die Cboe-Daten bestmöglich wiederzugeben, die in 30 Minuten-Intervallen herausgegeben werden, wird ein 30 min-Chart empfohlen.
Es werden sowohl die 30-Minuten-Daten als auch die Tagesenddaten angezeigt.