อินดิเคเตอร์ กลยุทธ์ และไลบรารี
This tool displays relative volatility and directional trend. Excellent way to pickup diversions and reversals. Length can be lowered to 11 or 13 in settings to show price range. Can be used to identify patterns such as parallel channels and likely direction of price action as pictured below.
SFP Inquisitor v0.2a coded by Bogdan Vaida Code for Swing High, Swing Low and Swing Failure Pattern. Note that we're still in the alpha version, bugs may appear. Note that the number you set in your Swing History variable will also be the minimum delay you see until the apples appear. This is because we're checking the forward...
This tool is used to draw wedges. Traders can choose which pivot points to draw lines from in settings. Wedge Maker does not automatically detect current wedge and is required to be tweaked in settings.
EXPERIMENTAL: a test on how to compare price at different frequency's with static patterns.
experimental: zigzag indicator with all the zigzag methods that im aware of(that matter atleast), theres something for all tastes there :P this will be the basis for zigzag tools i make in the future. note: some zigzags REPAINT.
Vertical Run Down and Vertical Run Up based on Tom Bulkowski Chart Pattern with elaboration in percentage of the drop and up.
A piercing pattern is known in technical analysis to be a potential signal for a bullish reversal. The formation in its strictest form is rather rare, but tends to perform better the longer the downtrend in front of it. When technical studies such as RSI, Stochastic or MACD are showing a bullish divergence at the same time a piercing pattern appears, it...
My script builds upon another user-submitted script by rebuilding the logic used to identify candlestick patterns. The logic in my script is a mix of strict and lax guidelines to mitigate false flags and present valid buy and sell signals. -To use this indicator, simply add it to any chart. It will identify trends on any time frame although the lower you go, the...
This simple indicator will help identify the 123 Patterns on the charts. It's build based on the zigzag indicator, which will work as a guideline to identify the 3 points. As soon as the price crosses the third point, the indicator will draw 3 lines: entry, take profit, and stop loss. Those lines will work as a reference and may help with other indicators. This...
This strategy is similar to RSI V pattern strategy, but it looks for W pattern in RSI chart. RULES ====== BUY 1. ema20 is above ema50 2. RSI5 crossing up 30 from oversold area 3. and RSI5 must be below overbought area (default value set to 65) Add to existing Position 1. You can add on the next W pattern OR 2. if RSI5 is crossing up from below 20 Exit 1....
Some code for detecting tweezer candles, which are reversal patterns. You'll need to tweak the settings to be either less strict (more detections) or more strict (less detections). I found that if you follow the documentation for tweezers exactly, you will get very few detections. It is possible that this candlestick has become overused, so the original pattern...
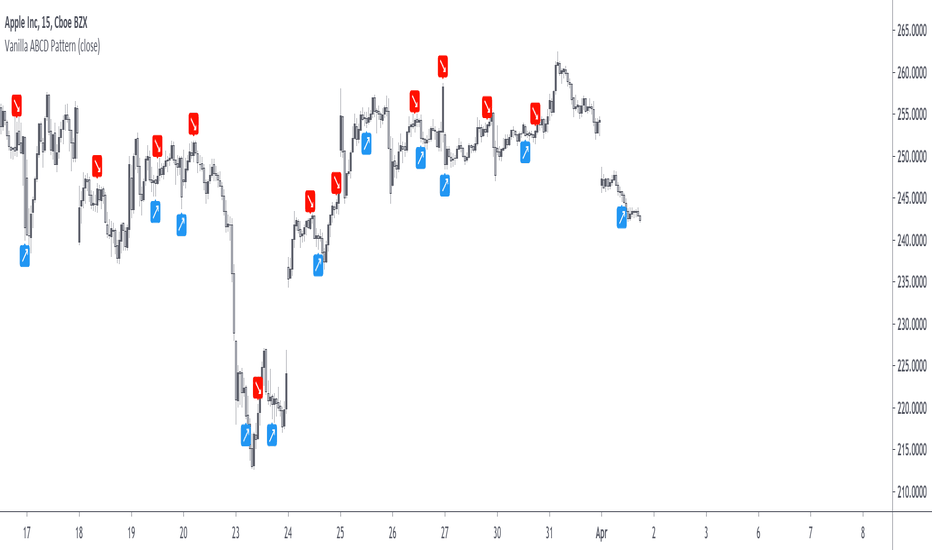
Patterns makes parts of the many predictive tools available to technical analysts, the most simples ones can be easily detected by using scripts. The proposed tool detect the simple (vanilla) form of the ABCD pattern, a pattern aiming to detect potential price swings. The script can use an additional confirmation condition that aim to filter potential false...
A tool to mine bar patterns statistics.
The previously proposed sequential filter aimed to filter variations lower than a certain period, this allowed to remove noisy variations and retain only the closing price values that occurred after a consecutive up/down, however because of the noisy nature of the closing price large filtering was impossible, in order to tackle to this problem the same indicator...
Removing irregular variations in the closing price remain a major task in technical analysis, indicators used to this end mostly include moving averages and other kind of low-pass filters. Understanding what kind of variations we want to remove is important, irregular (noisy) variations have mostly a short term period, fully removing them can be complicated if the...
Hello ladies and gentlemen traders Continuing deeper and stronger with the screeners' educational series one more time. This one is heavy crazy mega cool (pardon my french). I - Concept I present to you, ladies and gentlemen, the first screener for harmonic patterns. Starting with an ACBD pattern screener this time!! I used the calculations from Ricardo...
Helper script to draw patterns on chart.


![[RS]ZigZag Multiple Methods - Forecast - patterns - labels SQ: [RS]ZigZag Multiple Methods - Forecast - patterns - labels](https://s3.tradingview.com/3/3W5o68jP_mid.png)


![[RS]Bar Pattern Statistics Tool BTCUSD: [RS]Bar Pattern Statistics Tool](https://s3.tradingview.com/i/IeaHIREo_mid.png)


![[RS]Zbar EURUSD: [RS]Zbar](https://s3.tradingview.com/1/1X7p6tHI_mid.png)


![[RS]ZigZag Percent Reversal - Helper - Draw Patterns - Part 3 EURNZD: [RS]ZigZag Percent Reversal - Helper - Draw Patterns - Part 3](https://s3.tradingview.com/r/Rmvb2lWk_mid.png)