อินดิเคเตอร์ กลยุทธ์ และไลบรารี
Edited version of the script by LazyBear. Update of my previous script. Features: - plot both MFI and/or RSI (LazyBear only allows one of both) - plot RSI/MFI band (over sold - mid - over bought) + indicator lines
Edited version of the script by LazyBear. Update of my previous script. Features: - plot both MFI and/or RSI (LazyBear only allows one of both) - plot an indicator band (over sold - mid - over bought)
Plot of the distance from the 200ma. Helpful to identify areas where max distance from the 200ma caused a drop down or jump up to the mean
This indicator is the chart version intended to accompany my custom RSI oscillator: CLICK HERE TO SEE BASE INDICATOR CLICK HERE TO SEE BASE INDICATOR
This indicator will allow you to see overbought and oversold areas of the rsi or the cci, you must set yourself the upper and lower band of the rsi (70-30) or cci (100, -100). By default, it's Rsi I have already posted the same indicator but only with the Rsi, I wanted to posted a more complete that offers the 2. On the chart, it is the overbought / oversold...
This is basically RSI 7 with RSI 14 Good to have them in one window so we will find a better enter in the market
A simple script that indicates the overbought and oversold area of the rsi by coloring the candlesticks
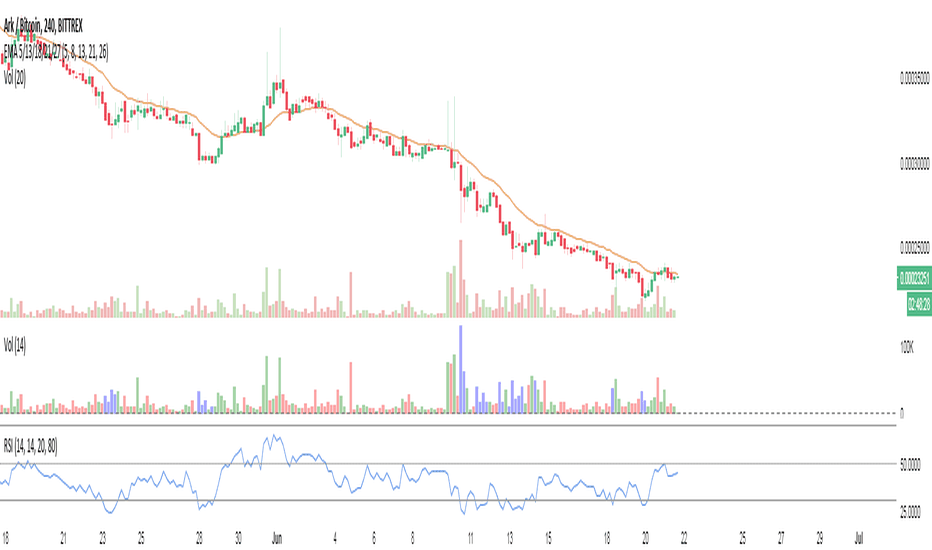
I present you my last indicator. A volume indicator that indicates overbought and oversold based on the rsi, I chose the rsi because the most used surment, this indicator allows you to identify the overbought and oversold areas of the rsi with the colors blue (oversold) and orange (overbought ) on the volume indicator! Hoping that you are useful
Union of three RSI indicators: 1h, 4h and daily. In order to show 1h RSI, you have to set it as active time frame on the chart. Purpose: spot "triple oversold" moments, where all the three RSI are under the threshold, which is 30 by default but editable. Target Market: Cryptocurrencies. Didn't try it on other ones, may work as well. Fits Crypto well as, by...
Similar to RSI Bitfinex , but Stoch version. It applies Stochastic Oscillator to BTC longs/shorts ratio on Bitfinex. You can use the oscillator as you'd use Stoch: - Divergences - Oversold/overbought signals - R/S on the indicator - Trend indication - etc
Inspired by Ichimoku Fibonacci Hybrid , this indicator is for those who don't mind a lot of lines. All lines represent Fib ratios: thicker lines are fibs for a longer period, while thinner lines are fibs for a shorter period. - Dynamic S/R - Overbought/Oversold zones - Trend indicator - Customisable periods - Fast/Slow crossovers See what works for you!
Hey guys, this is a variation of Ichimoku using Fibonacci principles. Overview As you may know, Ichimoku uses in its calculations (high + low)/2 to calculate Tenkan-sen (Conversion line) and Kijun-sen (Base line) for different periods: Tenkan is a shorter period, so it reacts faster to reversals, while Kijun is slower, so it reacts slower, and it is...
Ergodic Oscillator indicator script. Ergodic Oscillator is based on True Strength Index (TSI) by William Blau.
Rocket RSI indicator script. This indicator was originally developed by John Ehlers (Stocks & Commodities V.36:6, RocketRSI - A Solid Propellant For Your Rocket Science Trading).
This is a momentum, trend, as well as a divergence indicator. It is similar to CCI, though it is based on a slow and fast EMA in connection to ATR, which allows to interprete it easily. Both EMAs and ATR have customisable period. Further explanation and basic usage can be found in the comment section inside the script.
Laguerre RSI (Self Adjusting Alpha with Fractals Energy) indicator script. I adopted idea from www.prorealcode.com and If you disable `Apply Fractals Energy` option, you will get the original Laguerre RSI.
Corrected Relative Volatility Index. This indicator was originally developed by Donald Dorsey (Stocks & Commodities V.11:6 (253-256): The Relative Volatility Index). The indicator was revised by Dorsey in 1995 (Stocks & Commodities V.13:09 (388-391): Refining the Relative Volatility Index). I suggest the refined RVI with optional settings. If you disabled...
![MFI/RSI with Volatility Bands [LazyBear (edited)] BTCUSD: MFI/RSI with Volatility Bands [LazyBear (edited)]](https://s3.tradingview.com/g/gJB3elMb_mid.png)
![MFI/RSI with Volatility Bands [LazyBear (edited)] BTCUSD: MFI/RSI with Volatility Bands [LazyBear (edited)]](https://s3.tradingview.com/w/wwS2psrU_mid.png)


