CANX MA Crossover© CanxStixTrader
Moving average crossover systems measure drift in the market. They are great strategies for time-limited traders. KEEP IT SIMPLE
This strategy works both for buys and sells using the reaction line to guide your position against the reactions.
HOW TO USE THE INDICATOR
1) Choose your market and timeframe.
2) Choose the length.
3) Choose the multiplier.
4) Choose if the strategy is long-only or bidirectional (longs & shorts).
TIPS
The strategy works best in bullish markets as that is the primary direction that market such as stocks, indexes and metals like to move.
- Increase the multiplier to reduce whipsaws
- Increase the length to take fewer trades
- Decrease the length to take more trades
- Try a Long-Only strategy to see if that performs better.
The base set up when you load the indicator is for the 1 minute chart on gold. We found that it also works well on the US Indexes. For other markets you may need to change the length and multiplier to suit the market and back test its results.
Goldstrategy

SuperTrade ST1 StrategyOverview
The SuperTrade ST1 Strategy is a long-only trend-following strategy that combines a Supertrend indicator with a 200-period EMA filter to isolate high-probability bullish trade setups. It is designed to operate in trending markets, using volatility-based exits with a strict 1:4 Risk-to-Reward (R:R) ratio, meaning that each trade targets a profit 4× the size of its predefined risk.
This strategy is ideal for traders looking to align with medium- to long-term trends, while maintaining disciplined risk control and minimal trade frequency.
How It Works
This strategy leverages three key components:
Supertrend Indicator
A trend-following indicator based on Average True Range (ATR).
Identifies bullish/bearish trend direction by plotting a trailing stop line that moves with price volatility.
200-period Exponential Moving Average (EMA) Filter
Trades are only taken when the price is above the EMA, ensuring participation only during confirmed uptrends.
Helps filter out counter-trend entries during market pullbacks or ranges.
ATR-Based Stop Loss and Take Profit
Each trade uses the ATR to calculate volatility-adjusted exit levels.
Stop Loss: 1× ATR below entry.
Take Profit: 4× ATR above entry (1:4 R:R).
This asymmetry ensures that even with a lower win rate, the strategy can remain profitable.
Entry Conditions
A long trade is triggered when:
Supertrend flips from bearish to bullish (trend reversal).
Price closes above the Supertrend line.
Price is above the 200 EMA (bullish market bias).
Exit Logic
Once a long position is entered:
Stop loss is set 1 ATR below entry.
Take profit is set 4 ATR above entry.
The strategy automatically exits the position on either target.
Backtest Settings
This strategy is configured for realistic backtesting, including:
$10,000 account size
2% equity risk per trade
0.1% commission
1 tick slippage
These settings aim to simulate real-world conditions and avoid overly optimistic results.
How to Use
Apply the script to any timeframe, though higher timeframes (1H, 4H, Daily) often yield more reliable signals.
Works best in clearly trending markets (especially in crypto, stocks, indices).
Can be paired with alerts for live trading or analysis.
Important Notes
This version is long-only by design. No short positions are executed.
Ideal for swing traders or position traders seeking asymmetric returns.
Users can modify the ATR period, Supertrend factor, or EMA filter length based on asset behavior.

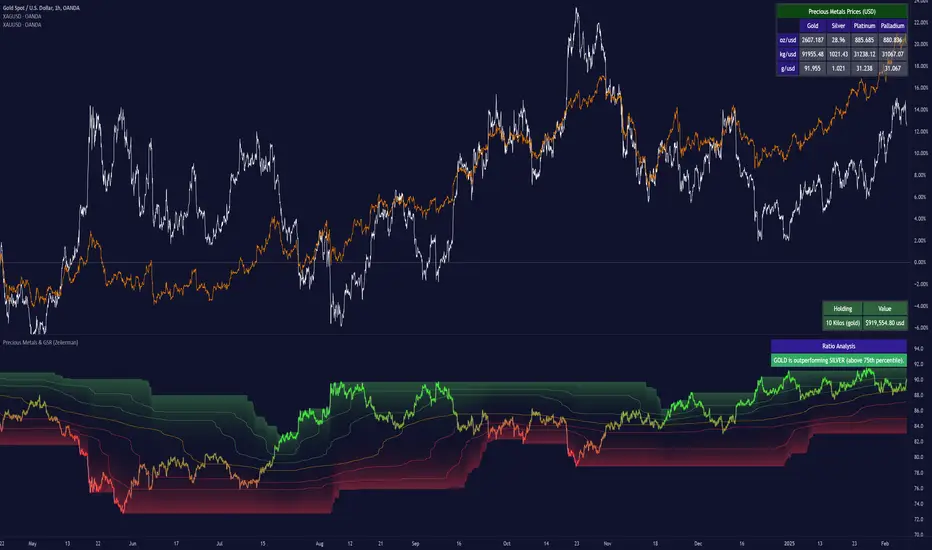
Precious Metals & GSR (Zeiierman)█ Overview
The Precious Metals & GSR (Zeiierman) is designed to provide traders and investors with a comprehensive view of the Gold-Silver Ratio (GSR) and other precious metal relationships. This tool helps evaluate the relative strength between different metals by analyzing their price ratios over historical periods, using quantile-based analysis and trend interpretation tables to highlight key insights.
The Gold-Silver Ratio (GSR) is a widely utilized metric in precious metals trading, representing the number of silver ounces required to purchase one ounce of gold. Historically, this ratio has fluctuated, providing traders with insights into the relative value of these two metals. By analyzing the GSR, traders can identify potential trading opportunities based on historical patterns and market dynamics.
By integrating customizable percentile bands, gradient coloring for performance visualization, and dynamic ratio analysis, this indicator assists in understanding how one metal is performing relative to another, making it useful for trend tracking, risk management, and portfolio allocation.
█ How It Works
The Precious Metals & GSR Indicator operates by fetching the latest prices of the selected precious metals in the user's chosen currency. It then calculates the ratio between two selected metals (Metal 1 and Metal 2) and analyzes this ratio over a specified period. By computing quantile bands and high/low bands, the indicator provides insights into the historical performance and current standing of the ratio.
⚪ Ratio Calculation
The core of this indicator is the metal ratio, calculated by dividing the price of Metal 1 by Metal 2.
A rising ratio means Metal 1 is outperforming Metal 2.
A falling ratio means Metal 2 is outperforming Metal 1.
The indicator automatically retrieves live market prices of Gold, Silver, Platinum, and Palladium to compute the ratio.
⚪ Quantile Ratio Bands
The indicator calculates the highest (max) and lowest (min) ratio levels over a user-defined period.
It also plots quantile bands at the 10th, 25th, 50th (median), 75th, and 90th percentiles, providing deeper statistical insights into how extreme or average the current ratio is.
The median (Q50) acts as a reference level, showing whether the ratio is above or below its historical midpoint.
⚪ Interpretation Table
The Ratio Interpretation Table provides a text-based summary of the ratio’s strength.
It detects whether Metal 1 is at a historical high, low, or within common ranges.
This helps traders and investors make informed decisions on whether the ratio is overextended, mean-reverting, or trending.
⚪ Precious Metals Table
Displays live market prices for Gold, Silver, Platinum, and Palladium.
Prices are shown in different units (oz, kg, grams, and troy ounces) based on user preferences.
A color-coded system highlights price changes, making it easier to track market movements.
⚪ Physical Holding Calculator
Users can enter their precious metal holdings to estimate their current value.
The system adjusts calculations based on weight, purity (24K, 22K, etc.), and unit of measurement.
The holding value is displayed in the selected currency (USD, EUR, GBP, etc.).
█ How to Use
⚪ Trend Identification
If the ratio is increasing, Metal 1 is gaining strength relative to Metal 2 → Possible Long Position on Metal 1 / Short on Metal 2
If the ratio is decreasing, Metal 2 is gaining strength relative to Metal 1 → Possible Short Position on Metal 1 / Long on Metal 2
⚪ Mean Reversion Strategy
When the ratio reaches the 90th percentile, Metal 1 is historically overextended (expensive) compared to Metal 2.
Traders may look to sell Metal 1 and buy Metal 2, expecting the ratio to decline back toward its historical average.
Example (Gold/Silver Ratio): If the GSR is above the 90th percentile, gold is very expensive relative to silver, suggesting a potential buying opportunity in silver and/or a selling opportunity in gold.
When the ratio reaches the 10th percentile, Metal 1 is historically undervalued (cheap) compared to Metal 2.
Traders may look to buy Metal 1 and sell Metal 2, expecting the ratio to rise back toward its historical average.
Example (Gold/Silver Ratio): If the GSR is below the 10th percentile, gold is very cheap relative to silver, suggesting a potential buying opportunity in gold and/or a selling opportunity in silver.
⚪ Common Strategy Based on GSR Insights
A common approach involves monitoring the ratio for extreme values based on historical data. When the ratio reaches historically high levels, it suggests that gold is expensive relative to silver, potentially indicating a buying opportunity for silver and/or a selling opportunity for gold. Conversely, when the ratio is at historically low levels, silver is expensive relative to gold, suggesting a potential buying opportunity for gold and/or selling opportunity for silver. This mean-reversion strategy relies on the tendency of the GSR to return to its historical average over time.
⚪ Hedging & Portfolio Diversification
If Gold is strongly outperforming Silver, investors may shift allocations to balance risk.
If Silver is rapidly gaining on Gold, it may indicate increased industrial demand or speculative interest.
⚪ Inflation & Economic Cycles
A rising Gold-Silver ratio often correlates with economic downturns and increased risk aversion.
A falling Gold-Silver ratio may signal stronger economic growth and higher inflation expectations.
█ Settings
Precious Metals Table
Select which metals to display (Gold, Silver, Platinum, Palladium)
Choose measurement units (oz, kg, grams, troy ounces)
Ratio Analysis
Select Metal 1 & Metal 2 for ratio calculation
Set historical length for quantile calculations
Interpretation Table
Enable automated insights based on ratio levels
Physical Holdings Calculator
Enter metal weight, purity, and unit
Select calculation currency
-----------------
Disclaimer
The content provided in my scripts, indicators, ideas, algorithms, and systems is for educational and informational purposes only. It does not constitute financial advice, investment recommendations, or a solicitation to buy or sell any financial instruments. I will not accept liability for any loss or damage, including without limitation any loss of profit, which may arise directly or indirectly from the use of or reliance on such information.
All investments involve risk, and the past performance of a security, industry, sector, market, financial product, trading strategy, backtest, or individual's trading does not guarantee future results or returns. Investors are fully responsible for any investment decisions they make. Such decisions should be based solely on an evaluation of their financial circumstances, investment objectives, risk tolerance, and liquidity needs.
Investments/swing trading strategy for different assetsStop worrying about catching the lowest price, it's almost impossible!: with this trend-following strategy and protection from bearish phases, you will know how to enter the market properly to obtain benefits in the long term.
Backtesting context: 1899-11-01 to 2023-02-16 of SPX by Tvc. Commissions: 0.05% for each entry, 0.05% for each exit. Risk per trade: 2.5% of the total account
For this strategy, 5 indicators are used:
One Ema of 200 periods
Atr Stop loss indicator from Gatherio
Squeeze momentum indicator from LazyBear
Moving average convergence/divergence or Macd
Relative strength index or Rsi
Trade conditions:
There are three type of entries, one of them depends if we want to trade against a bearish trend or not.
---If we keep Against trend option deactivated, the rules for two type of entries are:---
First type of entry:
With the next rules, we will be able to entry in a pull back situation:
Squeeze momentum is under 0 line (red)
Close is above 200 Ema and close is higher than the past close
Histogram from macd is under 0 line and is higher than the past one
Once these rules are met, we enter into a buy position. Stop loss will be determined by atr stop loss (white point) and break even(blue point) by a risk/reward ratio of 1:1.
For closing this position: Squeeze momentum crosses over 0 and, until squeeze momentum crosses under 0, we close the position. Otherwise, we would have closed the position due to break even or stop loss.
Second type of entry:
With the next rules, we will not lose a possible bullish movement:
Close is above 200 Ema
Squeeze momentum crosses under 0 line
Once these rules are met, we enter into a buy position. Stop loss will be determined by atr stop loss (white point) and break even(blue point) by a risk/reward ratio of 1:1.
Like in the past type of entry, for closing this position: Squeeze momentum crosses over 0 and, until squeeze momentum crosses under 0, we close the position. Otherwise, we would have closed the position due to break even or stop loss.
---If we keep Against trend option activated, the rules are the same as the ones above, but with one more type of entry. This is more useful in weekly timeframes, but could also be used in daily time frame:---
Third type of entry:
Close is under 200 Ema
Squeeze momentum crosses under 0 line
Once these rules are met, we enter into a buy position. Stop loss will be determined by atr stop loss (white point) and break even(blue point) by a risk/reward ratio of 1:1.
Like in the past type of entries, for closing this position: Squeeze momentum crosses over 0 and, until squeeze momentum crosses under 0, we close the position. Otherwise, we would have closed the position due to break even or stop loss.
Risk management
For calculating the amount of the position you will use just a small percent of your initial capital for the strategy and you will use the atr stop loss for this.
Example: You have 1000 usd and you just want to risk 2,5% of your account, there is a buy signal at price of 4,000 usd. The stop loss price from atr stop loss is 3,900. You calculate the distance in percent between 4,000 and 3,900. In this case, that distance would be of 2.50%. Then, you calculate your position by this way: (initial or current capital * risk per trade of your account) / (stop loss distance).
Using these values on the formula: (1000*2,5%)/(2,5%) = 1000usd. It means, you have to use 1000 usd for risking 2.5% of your account.
We will use this risk management for applying compound interest.
In settings, with position amount calculator, you can enter the amount in usd of your account and the amount in percentage for risking per trade of the account. You will see this value in green color in the upper left corner that shows the amount in usd to use for risking the specific percentage of your account.
Script functions
Inside of settings, you will find some utilities for display atr stop loss, break evens, positions, signals, indicators, etc.
You will find the settings for risk management at the end of the script if you want to change something. But rebember, do not change values from indicators, the idea is to not over optimize the strategy.
If you want to change the initial capital for backtest the strategy, go to properties, and also enter the commisions of your exchange and slippage for more realistic results.
If you activate break even using rsi, when rsi crosses under overbought zone break even will be activated. This can work in some assets.
---Important: In risk managment you can find an option called "Use leverage ?", activate this if you want to backtest using leverage, which means that in case of not having enough money for risking the % determined by you of your account using your initial capital, you will use leverage for using the enough amount for risking that % of your acount in a buy position. Otherwise, the amount will be limited by your initial/current capital---
Some things to consider
USE UNDER YOUR OWN RISK. PAST RESULTS DO NOT REPRESENT THE FUTURE.
DEPENDING OF % ACCOUNT RISK PER TRADE, YOU COULD REQUIRE LEVERAGE FOR OPEN SOME POSITIONS, SO PLEASE, BE CAREFULL AND USE CORRECTLY THE RISK MANAGEMENT
Do not forget to change commissions and other parameters related with back testing results!
Some assets and timeframes where the strategy has also worked:
BTCUSD : 4H, 1D, W
SPX (US500) : 4H, 1D, W
GOLD : 1D, W
SILVER : 1D, W
ETHUSD : 4H, 1D
DXY : 1D
AAPL : 4H, 1D, W
AMZN : 4H, 1D, W
META : 4H, 1D, W
(and others stocks)
BANKNIFTY : 4H, 1D, W
DAX : 1D, W
RUT : 1D, W
HSI : 1D, W
NI225 : 1D, W
USDCOP : 1D, W
