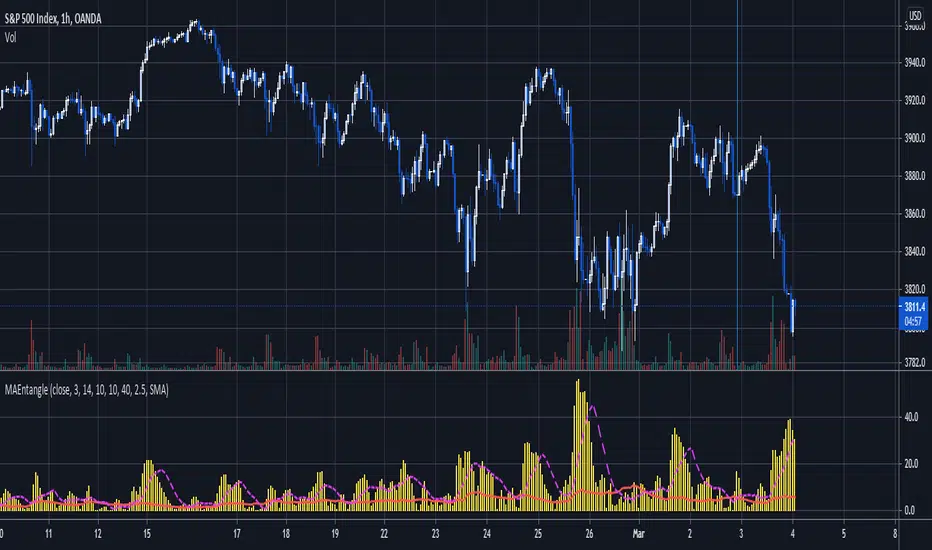
Moving Average EntanglementThis script uses the gap in moving averages standardized to the average true range to determine entry and exit points.
The red line represents the current percentage of ATR that is deemed "The Dead Zone" - a move that is too small to be reliable.
The histogram represents the gap between moving averages. When the histogram is above the red line, it confirms a breakout move.
The dashed line an be used as a secondary filter and is a moving average of the histogram.
When Standard Deviation mode is on, a third line is displayed, which represents how many standard Deviations the current histogram bar represents, and can be also used as a filter.
อินดิเคเตอร์และกลยุทธ์
Sigma Spike Filtered Binned OPR ( Adam H. Grimes )As originally described by Adam H. Grimes.
For analyzing the location of Open within the day's range (OPR). The OPR histogram displays the binned distribution of OPR values for the chart history. Fat tails at the extremes indicates that Open occurred more often close to the day's high or low.
The OPR results are filtered according to volatility using Grime's Sigma Spike. So that OPR values are only recorded when volatility exceeds a threshold (relative high range days).
This may (strong emphasis on may) indicate the opportunity for trades early in the day on days that begin with a high amount of relative volatility and trading with the direction that price is moving away from the open.

Efficient Work [LucF]█ OVERVIEW
Efficient Work measures the ratio of price movement from close to close ( resulting work ) over the distance traveled to the high and low before settling down at the close ( total work ). The closer the two values are, the more Efficient Work approaches its maximum value of +1 for an up move or -1 for a down move. When price does not change, Efficient Work is zero.
Higher values of Efficient Work indicate more efficient price travel between the close of two successive bars, which I interpret to be more significant, regardless of the move's amplitude. Because it measures the direction and strength of price changes rather than their amplitude, Efficient Work may be thought of as a sentiment indicator.
█ CONCEPTS
This oscillator's design stems from a few key concepts.
Relative Levels
Other than the centerline, relative rather than absolute levels are used to identify levels of interest. Accordingly, no fixed levels correspond to overbought/oversold conditions. Relative levels of interest are identified using:
• A Donchian channel (historical highs/lows).
• The oscillator's position relative to higher timeframe values.
• Oscillator levels following points in time where a divergence is identified.
Higher timeframes
Two progressively higher timeframes are used to calculate larger-context values for the oscillator. The rationale underlying the use of timeframes higher than the chart's is that, while they change less frequently than the values calculated at the chart's resolution, they are more meaningful because more work (trader activity) is required to calculate them. Combining the immediacy of values calculated at the chart's resolution to higher timeframe values achieves a compromise between responsiveness and reliability.
Divergences as points of interest rather than directional clues
A very simple interpretation of what constitutes a divergence is used. A divergence is defined as a discrepancy between any bar's direction and the direction of the signal line on that same bar. No attempt is made to attribute a directional bias to divergences when they occur. Instead, the oscillator's level is saved and subsequent movement of the oscillator relative to the saved level is what determines the bullish/bearish state of the oscillator.
Conservative coloring scheme
Several additive coloring conditions allow the bull/bear coloring of the oscillator's main line to be restricted to specific areas meeting all the selected conditions. The concept is built on the premise that most of the time, an oscillator's value should be viewed as mere noise, and that somewhat like price, it only occasionally conveys actionable information.
█ FEATURES
Plots
• Three lines can be plotted. They are named Main line , Line 2 and Line 3 . You decide which calculation to use for each line:
• The oscillator's value at the chart's resolution.
• The oscillator's value at a medium timeframe higher than the chart's resolution.
• The oscillator's value at the highest timeframe.
• An aggregate line calculated using a weighed average of the three previous lines (see the Aggregate Weights section of Inputs to configure the weights).
• The coloring conditions, divergence levels and the Hi/Lo channel always apply to the Main line, whichever calculation you decide to use for it.
• The color of lines 2 and 3 are fixed but can be set in the "Colors" section of Inputs.
• You can change the thickness of each line.
• When the aggregate line is displayed, higher timeframe values are only used in its calculation when they become available in the chart's history,
otherwise the aggregate line would appear much later on the chart. To indicate when each higher timeframe value becomes available,
a small label appears near the centerline.
• Divergences can be shown as small dots on the centerline.
• Divergence levels can be shown. The level and fill are determined by the oscillator's position relative to the last saved divergence level.
• Bull/bear markers can be displayed. They occur whenever a new bull/bear state is determined by the "Main Line Coloring Conditions".
• The Hi/Lo (Donchian) channel can be displayed, and its period defined.
• The background can display the state of any one of 11 different conditions.
• The resolutions used for the higher timeframes can be displayed to the right of the last bar's value.
• Four key values are always displayed in the Data Window (fourth icon down to the right of your chart):
oscillator values for the chart, medium and highest timeframes, and the oscillator's instant value before it is averaged.
Main Line Coloring Conditions
• Nine different conditions can be selected to determine the bull/bear coloring of the main line. All conditions set to "ON" must be met to determine the bull/bear state.
• A volatility state can also be used to filter the conditions.
• When the coloring conditions and the filter do not allow for a bull/bear state to be determined, the neutral color is used.
Signal
• Seven different averages can be used to calculate the average of the oscillator's value.
• The average's period can be set. A period of one will show the instant value of the oscillator,
provided you don't use linear regression or the Hull MA as they do not work with a period of one.
• An external signal can be used as the oscillator's instant value. If an already averaged external value is used, set the period to one in this indicator.
• For the cases where an external signal is used, a centerline value can be set.
Higher Timeframes
• The two higher timeframes are named Medium timeframe and Highest timeframe . They can be determined using one of three methods:
• Auto-steps: the higher timeframes are determined using the chart's resolution. If the chart uses a seconds resolution, for example,
the medium and highest resolutions will be 15 and 60 minutes.
• Multiples: the timeframes are calculated using a multiple of the chart's resolution, which you can set.
• Fixed: the set timeframes do not change with the chart's resolution.
Repainting
• Repainting can be controlled separately for the chart's value and the higher timeframe values.
• The default is a repainting chart value and non-repainting higher timeframe values. The Aggregate line will thus repaint by default,
as it uses the chart's value along with the higher timeframes values.
Aggregate Weights
• The weight of each component of the Aggregate line can be set.
• The default is equal weights for the three components, meaning that the chart's value accounts for one third of the weight in the Aggregate.
High Volatility
• This provides control over the volatility filter used in the Main line's coloring conditions and the background display.
• Volatility is determined to be high when the short-term ATR is greater than the long-term ATR.
Colors
• You can define your own colors for all of the oscillator's plots.
• The default colors will perform well on both white and black chart backgrounds.
Alerts
• An alert can be defined for the script. The alert will trigger whenever a bull/bear marker appears in the indicator's display.
The particular combination of coloring conditions and the display of bull/bear markers when you create the alert will thus determine when the alert triggers.
Once the alerts are created, subsequent changes to the conditions controlling the display of markers will not affect the existing alert(s).
• You can create multiple alerts from this script, each triggering on different conditions.
Backtesting & Trading Engine Signal Line
• An invisible plot named "BTE Signal" is provided. It can be used as an entry signal when connected to the PineCoders Backtesting & Trading Engine as an external input.
It will generate an entry whenever a marker is displayed.
█ NOTES
• I do not know for sure if the calculations in Efficient Work are original. I apologize if they are not.
• Because this version of Efficient Work only has access to OHLC information, it cannot measure the total distance traveled through all of a bar's ticks, but the indicator nonetheless behaves in a manner consistent with the intentions underlying its design.
For Pine coders
This code was written using the following standards:
• The PineCoders Coding Conventions for Pine .
• A modified version of the PineCoders MTF Oscillator Framework and MTF Selection Framework .

Heatmap Volume [xdecow]This indicator colors the volume bars and candles according to the volume traded. The calculation of the heat map zones is done as follows:
how many standard deviations the volume are distant from the average volume?
For a better visual experience, place the borders and wicks of the candles in a neutral color.

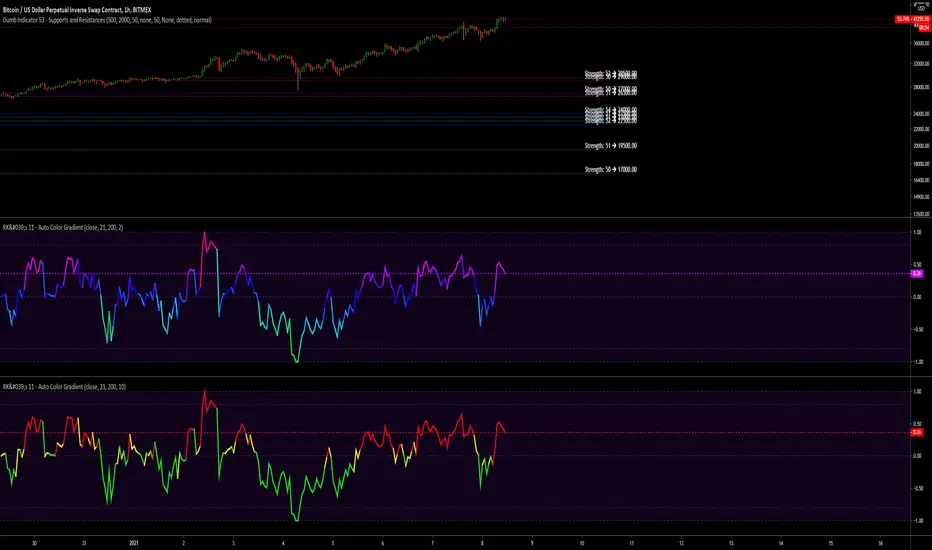
RK's Framework 01 - Auto Color GradientThis started as a personal arrays study, but after a few tests I decided to made a framework to get my own scripts simplest, lighter and faster.
And now I'm sharing with you guys.
Is very simple to use:
Copy evething inside "RK's Auto Color Gradient Framework" block;
Paste anywhere before the plotting;
Declare the color variable name calling the function "f_autocolor(___, ___)" with the source you gonna plot and the size of the scale do you want to use to compare the data.
Feel free to use.
Hope brings some profits for you guys!!
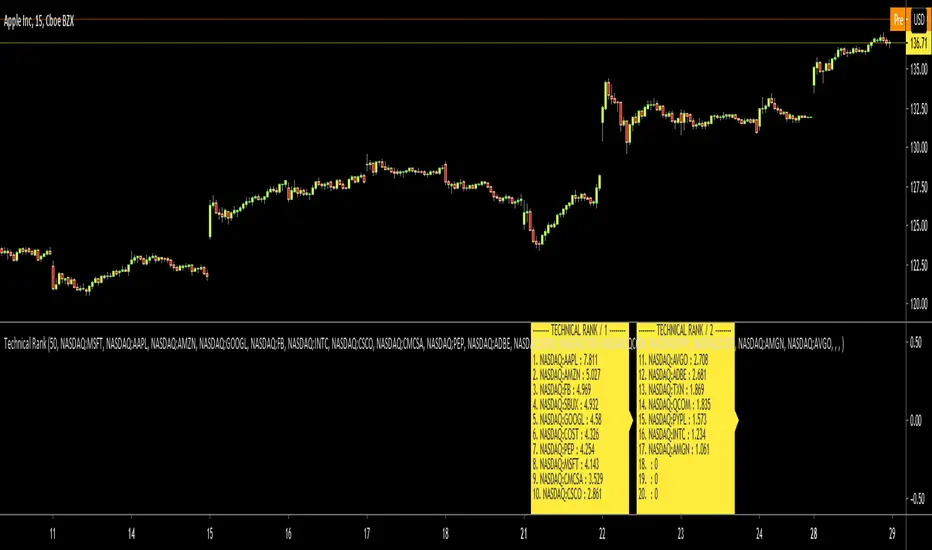
Technical RankHello Traders,
Technical Rank (TR) was authored by John Murphy . Technical Rank shows how a security is performing relative to its peers. Multiple moving averages, rate of change and the Relative Strength Index (RSI) indicators are used to calculate the Technical Rank. These values are mathematically manipulated with percentage factors and then summed together. there are 3 parts, long term, middle term and short term. for Long term part Moving Average with length 200 (30%) and Rate of Change with the length 125 (30%) are used, for middle term part, Moving Average with length 50 (15%) and Rate of Change with the length 20 (15%) are used and for short term part, PPO (5%) and RSI (5%) used.
Technical Rank is created using the following formula and weightings:
Long-Term Indicators (weighting): Percent above/below the 200-day exponential moving average (EMA) (30% weight) and the 125-day rate-of-change (ROC) (30% weight).
Medium-Term Indicators (weighting): Percent above/below 50-day EMA (15%) and the 20-day rate-of-change (15%).
Short-Term Indicators (weighting): Three-day slope of percentage price oscillator histogram divided by three (5%) and the relative strength index (5%).
The scripts calculates Technical Rank for 10 different securities and sorts them by Technical Rank value. A ranking of zero indicates the stock is the weakest in the group technically. A rank of 100 indicates the stock ranks highest in terms of technical performance. An increasing Technical Rank means the stock's price performance is showing strength relative to the group of stock being analyzed. A decreasing Technical Rank shows deteriorating relative price performance. Securities in the top 3-4 will have a technical rank of 70 or higher. You should focus on these relatively strong securities for potential long positions on pullbacks. You can also use the technical rank to avoid weak securities (in the bottom 3-4). I recommend you to check Technical Rank for the securities in multiple time frames.
You can choose the symbols as you want but you should choose the symbols with the same session info. for example only Cryptos, only Stocks, only FX pairs etc. (not mix of them).
Enjoy!
Logistic RSI, STOCH, ROC, AO, ... by DGTExperimental attemt of applying Logistic Map Equation for some of widly used indicators.
With this study "Awesome Oscillator (AO)", "Rate of Change (ROC)", "Relative Strength Index (RSI)", "Stochastic (STOCH)" and a custom interpretation of Logistic Map Equation is presented
Calculations with Logistic Map Equation makes sense when the calculated results are iterated many times within the same equation.
Here is the Logistic Map Equation : Xn+1 = r * Xn * (1 - Xn)
Where, the value of r is the key for this equation which changes amazingly the behaviour of the Logistic Map.
The value we have asigned for r is less then 1 and greater than 0 ( 0 < r < 1) and in this case the iterations performed with the maximum number of output series allowed by Pine is quite enough for our purpose and thanks to arrays we can easiliy store them for further processing
What we have as output:
Each iteration result is then plotted (excluding plotting the first iteration), as circles or line based on user preference
Values above and below zero level (0) are coloured differently to emphasis bull and bear power
Finally Standard Deviation of Array's Elements is ploted as line. Users may choose to display this line only
So where it comes the indicators "Awesome Oscillator (AO)", "Rate of Change (ROC)", "Relative Strength Index (RSI)", "Stochastic (STOCH)".
Those are the indicators whose values are assigned to our key varaiable in the Logistic Map equation forulma which is r
Further details regarding Logistic Map can found under the description of “Logistic EMA w/ Signals by DGT” study
Disclaimer:
Trading success is all about following your trading strategy and the indicators should fit within your trading strategy, and not to be traded upon solely
The script is for informational and educational purposes only. Use of the script does not constitute professional and/or financial advice. You alone have the sole responsibility of evaluating the script output and risks associated with the use of the script. In exchange for using the script, you agree not to hold dgtrd TradingView user liable for any possible claim for damages arising from any decision you make based on use of the script

[JRL] MM FibonacciThis is a new indicator that uses Murrey Math formulas to find the tops and bottoms, then uses those tops and bottoms to draw long-term fibonacci retracement levels. The genius of Murrey was his geometric formulas to calculate the right place to start plotting the lines, but I think the fibonacci ratios typically seem more accurate than the MM line ratios. So in this script I attempt to take the best of each and combine them into a new, superior indicator.
Let me know in the comments if you find this useful. Cheers!

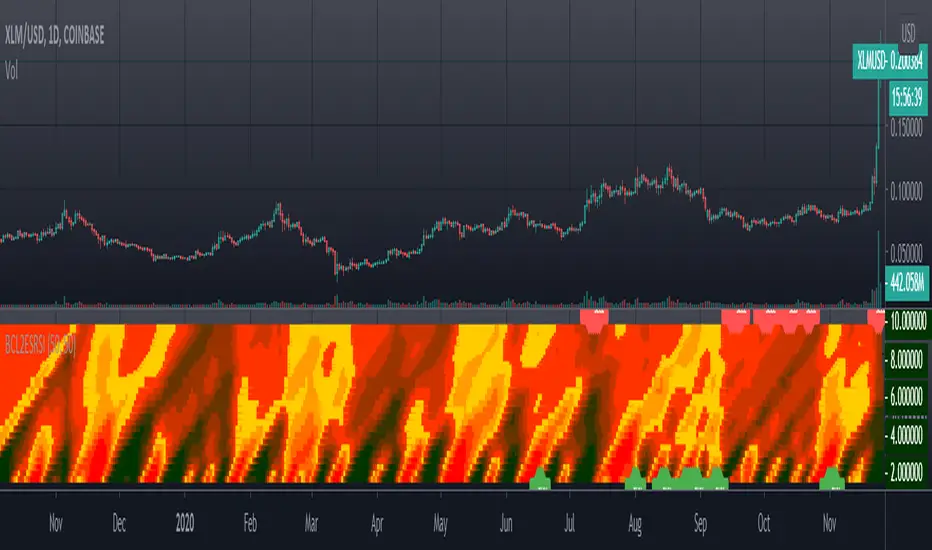
[blackcat] L2 Ehlers SwamiCharts RSILevel: 2
Background
John F. Ehlers introuced SwamiCharts RSI in his "Cycle Analytics for Traders" chapter 16 on 2013.
Function
SwamiCharts retain the core functionality of the technical indicators with which you're already familiar, while packing much more information into an easy-to interpret heat map chart. With SwamiCharts, you now visualize each indicator over a range of lookback periods
to reveal a better view of the indicator's truer meaning in context. SwamiCharts provide a better solution because you can now visualize context over a wide range of lookback periods. Trends and cycles emerge more succinctly, while continuation patterns and reversals become
easier to identify. SwamiCharts solves the data lookback problem by enabling you to view market conditions at a glance, a feature that will dramatically facilitate your trading.
Since the MyRSI is computed for all values over the range of lookback periods, it must be an array in Pine v4.0 rather than a variable. The RSI is computed relative to the output of the roofing filter rather than price closes to eliminate the effects of Spectral Dilation. After the computation of the ratio, the indicator is smoothed in a SuperSmoother filter, so we must create the three most recent instances ourselves in the code. This is because Pine v4.0 retains historical values for variables but not for arrays. In fact, ratio must be an array also for the same reasons. The coefficients for the 10-bar SuperSmoother filter are computed and are the same for all lookback periods, and so can be outside the lookback loop to make the calculations a little more efficient.
Key Signal
MyRSI1 --> Modified RSI by John Ehlers
Pros and Cons
100% John F. Ehlers definition translation, even variable names are the same. This help readers who would like to use pine to read his book.
Remarks
The 62th script for Blackcat1402 John F. Ehlers Week publication.
Readme
In real life, I am a prolific inventor. I have successfully applied for more than 60 international and regional patents in the past 12 years. But in the past two years or so, I have tried to transfer my creativity to the development of trading strategies. Tradingview is the ideal platform for me. I am selecting and contributing some of the hundreds of scripts to publish in Tradingview community. Welcome everyone to interact with me to discuss these interesting pine scripts.
The scripts posted are categorized into 5 levels according to my efforts or manhours put into these works.
Level 1 : interesting script snippets or distinctive improvement from classic indicators or strategy. Level 1 scripts can usually appear in more complex indicators as a function module or element.
Level 2 : composite indicator/strategy. By selecting or combining several independent or dependent functions or sub indicators in proper way, the composite script exhibits a resonance phenomenon which can filter out noise or fake trading signal to enhance trading confidence level.
Level 3 : comprehensive indicator/strategy. They are simple trading systems based on my strategies. They are commonly containing several or all of entry signal, close signal, stop loss, take profit, re-entry, risk management, and position sizing techniques. Even some interesting fundamental and mass psychological aspects are incorporated.
Level 4 : script snippets or functions that do not disclose source code. Interesting element that can reveal market laws and work as raw material for indicators and strategies. If you find Level 1~2 scripts are helpful, Level 4 is a private version that took me far more efforts to develop.
Level 5 : indicator/strategy that do not disclose source code. private version of Level 3 script with my accumulated script processing skills or a large number of custom functions. I had a private function library built in past two years. Level 5 scripts use many of them to achieve private trading strategy.
A Useful MA Weighting Function For Controlling Lag & SmoothnessSo far the most widely used moving average with an adjustable weighting function is the Arnaud Legoux moving average (ALMA), who uses a Gaussian function as weighting function. Adjustable weighting functions are useful since they allow us to control characteristics of the moving average such as lag and smoothness.
The following moving average has a simple adjustable weighting function that allows the user to have control over the lag and smoothness of the moving average, we will see that it can also be used to get both an SMA and WMA.
A high-resolution gradient is also used to color the moving average, makes it fun to watch, the plot transition between 200 colors, would be tedious to make but everything was made possible using a custom R script, I only needed to copy and paste the R console output in the Pine editor.
Settings
length : Period of the moving average
-Lag : Setting decreasing the lag of the moving average
+Lag : Setting increasing the lag of the moving average
Estimating Existing Moving Averages
The weighting function of this moving average is derived from the calculation of the beta distribution, advantages of such distribution is that unlike a lot of PDF, the beta distribution is defined within a specific range of values (0,1). Parameters alpha and beta controls the shape of the distribution, with alpha introducing negative skewness and beta introducing positive skewness, while higher values of alpha and beta increase kurtosis.
Here -Lag is directly associated to beta while +Lag is associated with alpha . When alpha = beta = 1 the distribution is uniform, and as such can be used to compute a simple moving average.
Moving average with -Lag = +Lag = 1 , its impulse response is shown below.
It is also possible to get a WMA by increasing -Lag , thus having -Lag = 2 and +Lag = 1 .
Using values of -Lag and +Lag equal to each other allows us to get a symmetrical impulse response, increasing these two values controls the heaviness of the tails of the impulse response.
Here -Lag = +Lag = 3 , note that when the impulse response of a moving average is symmetrical its lag is equal to (length-1)/2 .
As for the gradient, the color is determined by the value of an RSI using the moving average as input.
I don't promise anything but I will try to respond to your comments

Graham NumberGraham Number is named after the “father of value investing,” Benjamin Graham, who was a mentor of Warren Buffett. The figure takes into account earnings per share and book value per share to measure a stock's maximum fair market value. In other words, it is the upper end of the price range that a defensive investor should pay for the stock.
The Graham Number = Square Root of (22.5) x (tmm EPS) x (mrq Book Value per Share).
The 22.5 is included in the formula as a rule of thumb to account for Graham's assumption that the price-to-earnings ratio should not be over 15 and the price to book ratio should not be over 1.5 for an undervalued stock. So, the number is generated as (P/E of 15) x (P/B of 1.5) = 22.5.
So the script generates a Graham number plot.

Equivolume BarsEquivolume bars. Width is determined by volume. Please note that equivolume bars are rendered independently of the time scale.
Makes use of @LonesomeTheBlue's "Start the Script on Last Nth Bar" in order to prevent time out. As such you are only able to view the most recent bars and no bar replay beyond that range.
Pixel ArtHaving Fun with Arrays.
I couldn't load all of the images into their respective arrays without getting an "Internal Pine error" So I commented out some of them. You can pop them back in, but make sure to disable another in its place.
Vader
Pine Logo
&hearts
Bitcoin
pAulse

RSI buy sell force ver 1 Very simple script with no security MTF that show RSI buy and sell force
blue above red =bullish period
red above blue =bearish period
or you can try above 0 or bellow 0 as signal
if you want i will add signal after to this one

Aggregate BTC CandlesThis script creates candles based on an aggregated Index price from various BTC exchange tickers. Since the early years in particular have a lot of exchange specific flash crash wicks, missing data, erraticness compared to other exchanges particularly in their first few months, this is an attempt to clean up the price history, be it for TA (trendlines, S/R etc.) or use in algos or other indicators, without reliance on one exchange. It uses the new Array functionality to generate median and averages, and is entirely original work.

Bitcoin Bullish Percent IndexHello Traders,
This is Bitcoin Bullish Percent Index script. First lets talk about what the Bullish Percent Index and how it is calculated:
"The Bullish Percent Index (BPI) is a breadth indicator based on the number of securities on Point & Figure Buy Signals, Developed by Abe Cohen in the mid-1950s. Because a security is either on a P&F Buy or Sell Signal, there is no ambiguity when it comes to P&F charts. This makes BPI a straightforward indicator with clearly defined signals."
The calculation is straightforward and simple: (Number of securities on P&F Buy signals) / (Total number of securities)
Here you can see what the P&F buy signal is:
In this script I choose 40 cryptos that is correlated ( as I see ) with BTC (including BtcUsdt). in the first part the script creates P&F chart for each security and check if there is Buy or Sell signal and sum the buy signals if there is. in the second part it creates P&F chart by using the P&F buy/sell signals coming from the securities P&F chart. because of complicated calculation the script may need a few seconds to load.
in the first part reversal value is 3 by default but you can set different values as reversal. sometimes I got better results with reversal = 5.
in BPI part reversal = 3 is used. so each box represents 2% (each X or O is a box). And this means it takes at least a 6% move in BPI for a reversal. the Bullish Percent Index favors the bulls when above 50% and the bears when below 50%. The bulls have the edge when over 50% of stocks are on a P&F Buy Signal. BPI is also considered overbought when above 70% and oversold when below 30%. BPI can move between 0 and 100.
Because of 40 securities are used in the script and all different prices, it uses Percentage scaling only. it can calculate the Percentage automatically by using the time frame of the chart or you can set it as you wish.
The Signals coming from BPI:
Bull Alert: BPI is below 30% and then forms a new column of X's (rises)
Bear Alert: BPI is above 70% and then forms a new column of O's that decline below 70%.
Bull Confirmed: BPI is on a P&F buy signal and in a column of X's (rising).
Bear Confirmed: BPI is on a P&F sell signal and in a column of O's (falling).
Bull Correction: BPI is on a P&F buy signal, but currently falling (column of O's).
Bear Correction: BPI is on a P&F sell signal, but currently rising (column of X's).
If you are not familiar with Bullish Percent Index you better search it on the net to get more info, you can find a lot of articles and web sites about BPI.
as I remember I developed the script 6-7 months ago and today I had chance to publish it as it was
Enjoy!

Probability of ATR Index [racer8]Deriving the indicator:
PAI is an indicator I created that tells you the probability of current price moving a specified ATR distance over a specified number of periods into the future. It takes into account 4 variables: the ATR & the standard deviation of price, and the 2 parameters: ATR distance and # bars (time).
The formula is very complex so I will not be able to explain it without confusion arising.
What I can say is that I used integral calculus & the Taylor series to derive a formula that calculates the area under half of the normal distribution function. Thus, the formula was repeated twice in the code to derive the full probability (half + half = whole). If you can read the code, you might be wondering why the formula is so long...
The reason for this is because in Pine Script, the erf function doesn't exist. You see, the formula for normal distribution is: f(x) = (1/sqrt(2pi))*e^(-xx/2), assuming of course that the standard deviation = 1 and mu (mean) = 1. The next step is to take the integral of this formula in order to find the area under f(x). The problem is that I found the integral, F(x), of the normal distribution formula to be equal to F(x) = erf(x/sqrt(2))/2...and the erf function cannot be directly computed into Pinescript.
So I developed a solution...why not estimate the integral function? So that's exactly what I did using a technique involving the Taylor series. The Taylor series is an algebraic function that allows you to create a new function that can estimate the existing function. On a graph, the new function has the same values as the existing one, the only difference is that it uses a differnt formula, in this case, a formula that makes it possible to compute the integral. The disadvantage of using this new formula is that it is super long and if you want it to better represent the original integral over a wider range of x-values, you have to make it longer.
Signal Interpretion:
The hotter the colour, the more likely price will reach your specified distance.
The 2 values of PAI in the bottom window represent probability & average probability of your specifed distance geting hit.
Applications:
Stop loss placement---
This indicator is useful because it gives you an idea of the likelihood that a stop loss at a particular distance away from price (in ATRs) will be hit over a period of time specified. This is helpful in placing stop losses.
Options trading---
PAI can also be used in options trading. For example, you are using a strangle options strategy, and you want to make sure that price stays within the Strangle's profit range. So you only trade when PAI presents a low probability value of moving at a particular distance in ATRs over n periods.
Anyhow, I hope you guys like it. Enjoy! and hit that like button for me :)

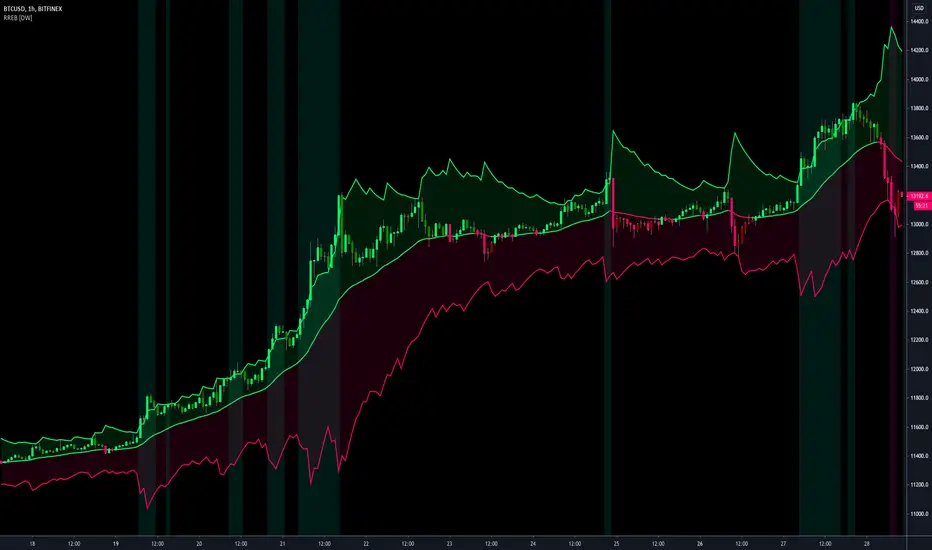
Resampling Reverse Engineering Bands [DW]This is an experimental study designed to reverse engineer price levels from centered oscillators at user defined sample rates.
This study aims to educate users on the process of oscillator reverse engineering, and to give users an alternative perspective on some of the most commonly used oscillators in the trading game.
Reverse engineering price levels from an oscillator is actually a rather simple, straightforward process.
Rather than plugging price values into a function to solve for oscillator values, we rearrange the function using some basic algebraic operations and plug in a specified oscillator value to solve for price values instead.
This process tells us what price value is needed in order for the oscillator to equal a certain value.
For example, if you wanted to know what price value would be considered “overbought” or “oversold” according to your oscillator, you can do that using this process.
In this study, the reverse engineering functions are used to calculate the price values of user defined high and low oscillator thresholds, and the price values for the oscillator center.
This allows you to visualize what prices will trigger thresholds as a sort of confidence interval, which is information that isn't inherently available when simply analyzing the oscillator directly.
This script is equipped with three reverse engineering functions to choose from for calculating the band values:
-> Reverse Relative Strength Index (RRSI)
-> Reverse Stochastic Oscillator (RStoch)
-> Reverse Commodity Channel Index (RCCI)
You can easily select the function you want to utilize from the "Band Calculation Type" dropdown tab.
These functions are specially designed to calculate at any sample rate (up to 1 bar per sample) utilizing the process of downsampling that I introduced in my Resampling Filter Pack.
The sample rate can be determined with any of these three methods:
-> BPS - Resamples based on the number of bars.
-> Interval - Resamples based on time in multiples of current charting timeframe.
-> PA - Resamples based on changes in price action by a specified size. The PA algorithm in this script is derived from my Range Filter algorithm.
The range for PA method can be sized in points, pips, ticks, % of price, ATR, average change, and absolute quantity.
Utilizing downsampled rates allows you to visualize the reverse engineered values of an oscillator calculated at larger sample scales.
This can be rather beneficial for trend analysis since lower sample rates completely remove certain levels of noise.
By default, the sample rate is set to 1 BPS, which is the same as bar-to-bar calculation. Feel free to experiment with the sample rate parameters and configure them how you like.
Custom bar colors are included as well. The color scheme is based on disparity between sources and the reverse engineered center level.
In addition, background highlights are included to indicate when price is outside the bands, thus indicating "overbought" and "oversold" conditions according to the thresholds you set.
I also included four external output variables for easy integration of signals with other scripts:
-> Trend Signals (Current Resolution Prices) - Outputs 1 for bullish and -1 for bearish based on disparity between current resolution source and the central level output.
-> Trend Signals (Resampled Prices) - Outputs 1 for bullish and -1 for bearish based on disparity between resampled source and the central level output.
-> Outside Band Signal (Current Resolution Prices) - Outputs 1 for overbought and -1 for oversold based on current resolution source being outside the bands. Returns 0 otherwise.
-> Outside Band Signal (Resampled Prices) - Outputs 1 for overbought and -1 for oversold based on resampled source being outside the bands. Returns 0 otherwise.
To use these signals with another script, simply select the corresponding external output you want to use from your script's source input dropdown tab.
Reverse engineering oscillators is a simple, yet powerful approach to incorporate into your momentum or trend analysis setup.
By incorporating projected price levels from oscillators into our analysis setups, we are able to gain valuable insights, make (potentially) smarter trading decisions, and visualize the oscillators we know and love in a totally different way.
I hope you all find this script useful and enjoyable!
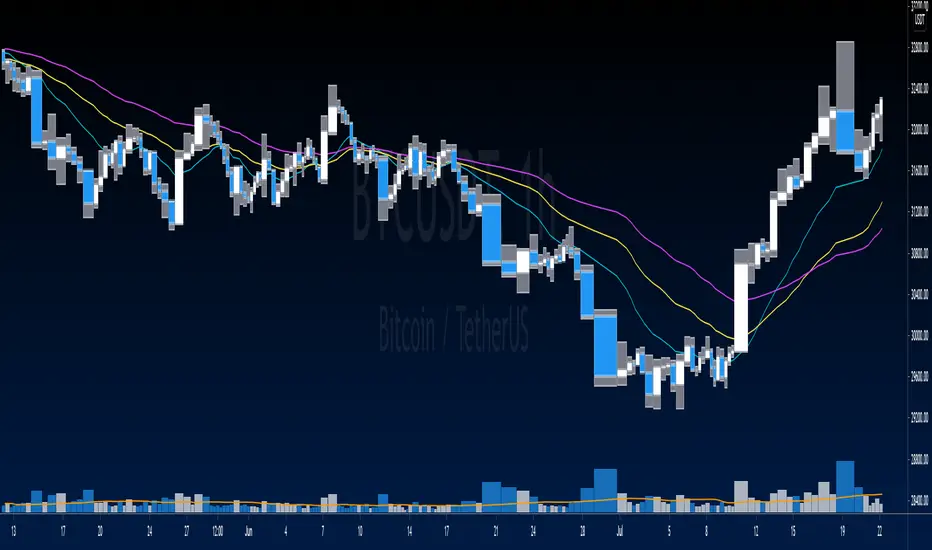
72s: Adaptive Hull Moving Average+One challenging issue for beginner traders is to differentiate market conditions, whether or not the current market is giving best possibility to stack profits, as earliest, in shortest time possible, or not.
On intraday, we've seen some big actions by big banks are somewhat can be defined --or circling around-- by HMA 200 . I've been thinking on to make the visuals more conform to price dynamics (separating major movement and minor noise) to get clearer signs of when it starts to happen. So it will be easier to see in a glance when the strength starts really taken place, with less cluttered chart.
This Adaptive HMA is using the new Pine Script's feature which now support Dynamic Length arguments for several Pine functions. ( read: www.tradingview.com). It hasn't support the built-in HMA() directly, but thankfully we can use its wma() formula to construct. (Note: I tweaked a bit HMA formula already popular here by using plain int() instead of round() on its wma's length, since I find it precisely match tradingview's built-in HMA).
You can choose which aspect the Adaptive HMA period will adapt to.
In this study I present it with two options: Volume and Volatility . It will "moves" faster or slower depends on which situation the aspect is currently into. ie: When volume is generally low or volatile readings is not there, price won't move very much, so the adapting MA will slow down by dynamically lengthen the lookback period, and vice versa, and so on.
Colour-markings in the Adaptive resembles which situation explained above. In addition, I also combine it with slope calculation of the MA to help measuring trend-strength or sideway/choppy conditions.
This way when we use it as dynamic support/resistance it will be more visually-reliable.
Secondly, and more important, it might help us traders with better probability info of whether or not a trade should even worth to be made . ie: If in the mean time market won't give much movement, any profit would also only as much. In most cases, we might better save our dime for later or place it somewhere else.
HOW TO USE:
Aside from better dynamic support/resistance and clearer breakout confirmation, MA is coloured as follow:
YELLOW:
Market is in consolidation or flat. Be it sideways, choppy, or in relatively small movements. If it shows up in a trending market, it may be an earlier sign that current trend might about to change its direction, or confirming a price broke-out to another side.
LIGHT GREEN or LIGHT RED:
Tells if a trend is forming but still relatively weak (or getting weaker), as it doesn't have volume or volatility to support.
DARKER GREEN ot DARKER RED:
This is where we can expect some good and strong price movement to ride. If it's strong enough, many times it marks a start of new long-lasting major trend.
SETTINGS:
Charger:
Choose which aspect your HMA should plug itself into, thus it will adapt to it.
Minimum Period, Maximum Period:
172 - 233 is just my own setting to outmatch the static HMA 200 for intraday. I find it --in my style of trading-- best in 15m tf in almost any pair, and 15m to 1H for some stocks. It also works nicely with conventional EMA 200, sometimes as if they somewhat work hand-in-hand in defining where the price should go. But you can, ofcourse, experiment with other ranges, broader or narrower. Especially if you already have an established strategy to follow to. As you might do with:
Consolidation area threshold:
This has to do with slope calculation. The bigger the number means your MA needs bigger degree to define the market is out of flat (yellow) area. This can be useful if needed to lighten up the filter or vice-versa.
Background colouring:
Just another colouring to help highlighting the difference in market conditions.
ALERTS:
There are two alerts:
Volume Break: when volume is breaking up above average, and
Volatility Meter: when the market more likely is about to have its moment of the big wiggling brush.
USAGE:
Very very nice BUY entry to catch big up-movement if:
1. Price is above MA. (It is best when price is also not to far distance from the MA, or you can also use distance oscillator to help out too)
2. HMA's color is in darker green. Means it's on the charging plug with your chosen aspect.
3. RSI is above 50. This is to help as additional confirmation.
Clear SELL entry signal is same as above, just the opposite.
-------------------------------------------------------
Note:
Lower timeframe of course means more noise to be filtered. Depends on the instrument, you might need to tweak the settings a bit till it conform nicely and shows lots of good trades in history. Here's another example on GBPUSD 5m timeframe:
For exit/take-profit point, you can use a second faster period static HMA. Or you can also use RSI. Here's an example:
Don't get me wrong, on few occasions I found it's still best using static MA to spot fakeouts, breakouts, etc, especially ones that's been already use widely. If that's the case or price actions seems suspicious, simply put the same value for minimum and maximum period settings, and there you have the original HMA with extra features.
For developer, check in the code if you need to customise your own charger.
-------------------------------------------------------
That's it. Hopefully this Adaptive HMA+ could at least be a good sidekick to your own strategy, as it does mine. ;)

Responsive Linear Regression ChannelsThis is a linear trend indicator that can:
- automagically adjust to different chart resolutions
- snap to day/session boundaries on intraday
- totally not do the above and use ye olde good fixed lookback window
- show the regression trend and its RMSE channels
- disregard the trend and just show the period average and standard deviation lines (often acting as support and resistance)
The main idea was to allow you to quickly view linear trends for different time periods without having to calculate the required amount of bars.
By default, you will be able to quickly switch between 1-3 months, 6 months, 1 year, 2 years and 5 years of data, as well as various daily lookback periods.
Please adjust resolution settings to your liking.
Caveats:
- More data means more noise and slower calculations.
- HLC3 source is recommended, especially at resolutions above hourly.
- Trend will be slightly different if you use extended hours.
- If you use extended hours and don't have a data subscription, trend will be SUBSTANTIALLY different, especially at smaller resolutions like 1m.
- You might want to use 3.5 days per week for crypto (it's 7 days by default).
Known problems:
- If you can't see the trendlines, scroll to the left or zoom out - the origin could be outside of your viewport.
- Futures' sessions start on the previous day. We currently snap only to day boundaries, not session breaks.
- UVXY and the like that have extremely high price datapoints. The calculations will be wrong on some resolutions.
- Replay can freeze circa bar_index 244 — disable smart lookback and keep your window under 240 bars if you encounter this.
ACKNOWLEDGEMENTS:
Many thanks to alexgrover for his extremely efficient functions (used with permission)

Voss Predictor (A Peek Into the Future) - Dr. John EhlersI have been sitting on this for over a year, but I now present this "Voss Predictive Filter" multicator employing PSv4.0 upon initial release, originally formulated by the great and empowering Dr. John Ehlers for TASC - August 2019 Traders Tips. This is a slightly modified version of the original indicator John Ehlers designed. My improved implementation is an all-in-one combination of three indicators, consisting of Ehlers' 2-pole bandpass filter, fed into the Voss predictor, and my Correlation Color. I also purposefully attempted to make this indicator work on both "Light" and "Dark" charts equally well.
You can search for this indicator's white paper, entitled "A PEEK INTO THE FUTURE By John Ehlers", on his site in the educational reference section. It's VERY important that you fully grasp how this indicator works and when it doesn't during trending price movements. According to "TV House Rules", I can't link directly to his white paper on his web site. Technically he's a vendor, even though it has been divulged to me, that he is intending to retire after his last and final wØℾk$#Øp, where he is publicly disseminating the bulk of his unpublished proprietary code that drives his other website VERY SOON.
I love John Ehlers in a respectfully appreciative manner and he is my hero in life! I simply don't revel about pretended celebrities and supposed rock stars. I will never be able to adequately explain to you how much he has influenced me AND this website as it currently exists AND what is in store for the future of the ever evolving "Power of Pine". His inspiring legacy of code poetry shall forever be immortally enshrined here on TV and influence it.
Back to the topic of interest, this script originating from John Ehlers' mind... This indicator helps to anticipate cyclic turning points via negative group delay. It is NOT a predictive crystal ball. Do not become cluelessly disillusioned by it's title. I need to explain.
For example, this indicator could not have anticipated that the bold faced lie of "15 Days to Slow the Spread" of the CHImeravirus "plandemic" in the USA, would turn into our factual reality of multi state mandated orders demanding months of unconstitutional prison cell styled lockdowns with closures and the absurd criminalization of not wearing a mouth mask made from underwear while not being evidently ill, additionally combined with 24/7 black magick mass hypnosis spoon feeding non-scientific fear based psychological propaganda from the world's "finest" epidemiological data analysts and misleaders, eventually decimating the world's markets into zombie economies with abhorrent results of long term massive unemployment and financial hardship on a chart scale never before witnessed. Yep, it's NOT capable of predetermining any of that. I just wanted to make that very clear by example in a metaphorical manner many people can relate to concerning Voss' ability to anticipate.
The indicator consists of a bandpass filter coupled to the Voss predictor. Also, one thing about the Voss predictor, it can catch minute turning points or even false ones as explained in the white paper. So... I included my Correlation Color as a fitting companion to aid you in filtering out false signals during trending price movements. The Voss Predictive Filter should never be used alone, be forewarned!
Features List Includes:
Dark Background - Easily disabled in indicator Settings->Style for "Light" charts or with Pine commenting
AND a few more... Why list them, when you have the source code to explore!
When available time provides itself, I will consider your inquiries, thoughts, and concepts presented below in the comments section, should you have any questions or comments regarding this indicator. When my indicators achieve more prevalent use by TV members , I may implement more ideas when they present themselves as worthy additions. Have a profitable future everyone!

Multi-Sub by jchang274How it begin?
Traders and investors use market breadth in order to assess the index’s overall health. Market breadth can be a reliable, if not an accurate, indicator of an upcoming price rise in the index. Similarly, it can also provide early warning signs for a future price decline.
What is it?
Market breadth indicators analyze the number of stocks advancing relative to those that are declining in a given index or on a stock exchange.
Market breadth refers to how many stocks are participating in a given move in an index or on a stock exchange. An index may be rising yet more than half the stocks in the index are falling because a small number of stocks have such large gains that they drag the whole index higher.
How it works?
Market breadth studies attempt to uncover strength or weakness in the movements of an index that are not visible simply by looking at a chart of the index.