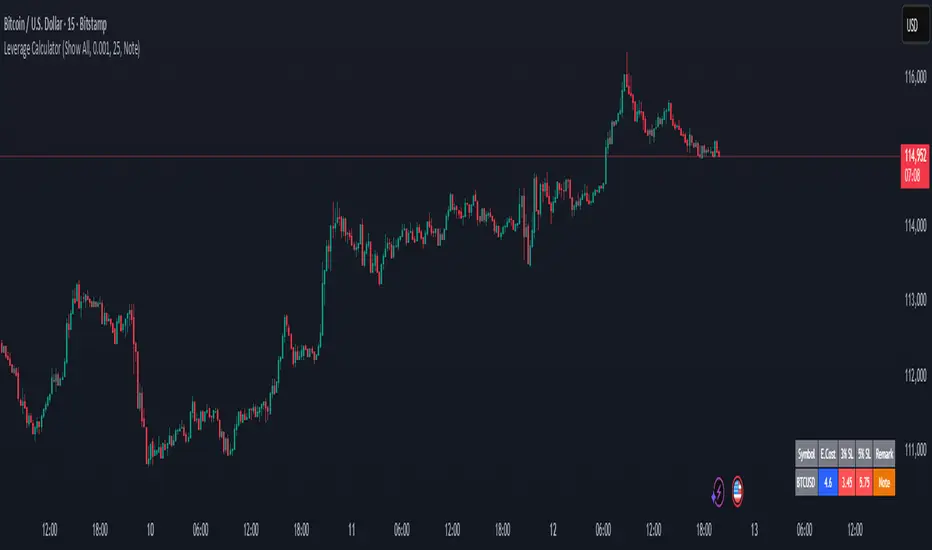
Margin Cost Calculator Screener - Taylor V1.2# Leverage Position Cost Calculator & Stop Lose Cost Screener #
Designed to provide traders with crucial insights into their leveraged positions directly on the TradingView chart.
Key Features:
> Dynamic Display: Choose to view only the estimated entry cost, or a comprehensive overview including potential losses at specific stop-loss levels, and a custom remark.
> Contract Size Input: Easily specify the contract size for your trades.
> Leverage Level Input: Set your desired leverage level, with helpful tooltips explaining the margin requirements for various leverage ratios (e.g., 25x, 10x, 5x) and an included fee estimate.
> Cost Calculation: Accurately calculates the estimated entry cost for your position based on the current market price, contract size, and leverage.
> Stop-Loss Projections: It projects potential losses for stop-loss orders set at 3% and 5% below the entry price, helping you manage risk effectively.
> Clear Table Visualization: All calculated data is presented in a clean, organized table anchored to the bottom-left of your chart, making it easy to reference at a glance.
> Symbol Identification: Automatically displays the short ticker symbol for the asset you are analyzing.
This tool is invaluable for traders who utilize leverage and need a quick, visual way to understand their financial exposure and potential outcomes before entering or managing a trade.
COST
Liquitive Buy/Sell Dollar AveragerLiquitive Buy/Sell Dollar Averager Indicator
The "Liquitive Buy/Sell Dollar Averager" is a versatile trading tool designed for intraday and multi-timeframe analysis, combining advanced range-bound calculations, RSI normalization, volume spikes, and candle pattern recognition to identify optimal buy and sell conditions. This indicator is particularly suitable for traders employing strategies that focus on dollar-cost averaging, position scaling, and systematic buy/sell decision-making.
Key Features:
Adaptive RSI-Based Levels:
Dynamically calculates inner bounds (IB) and outer bounds (OB) using RSI and price ranges, helping to identify overbought and oversold conditions relative to the price action.
Normalizes RSI values to the price range for seamless visualization overlaid on the chart.
Volume and Candle Analysis:
Detects significant volume spikes relative to a moving average, signaling increased market activity.
Identifies spiking green/red candles to capture momentum-driven price movements.
Dynamic Support and Resistance:
Calculates and plots support and resistance levels based on recent swing highs and lows.
Median and boundary lines help visualize key price levels for decision-making.
Profitability Check:
Buy and Sell Signals:
Checks profitability thresholds based on percentage gains/losses.
Incorporates logic for "time to buy" and "time to sell" using target profit margins.
Implements average move percentage to define realistic thresholds for buy/sell actions.
Time-Based Trading Restrictions:
Configures trading logic to disallow trades after a specific time (e.g., 3:40 PM for intraday sessions).
Ensures logical entry and exit decisions are only made within active trading hours.
Color-Coded Visualization:
Background colors dynamically shift between green (bullish), red (bearish), and neutral, depending on RSI and price position relative to the inner bounds.
Opacity of the background adjusts based on normalized RSI differences to provide a visual cue of market strength.
Customizable Parameters:
Allows user input for key settings like lookback periods, RSI length, percent ranges, volume thresholds, and transparency levels, enabling flexible configuration tailored to individual strategies.
Actionable Alerts and Signals:
Plots "Open Position", "Add to Position", and "Close Position" markers directly on the chart, making it easy to follow systematic trading rules.
How It Works:
Buy Signals:
Triggered when price conditions, volume spikes, and RSI-based thresholds align with profitability metrics.
Designed for dollar-cost averaging, identifying opportunities to add to long positions or open new positions.
Sell Signals:
Evaluates profitability conditions to identify when to close or scale out of positions.
Incorporates real-time evaluation of market momentum and profitability.

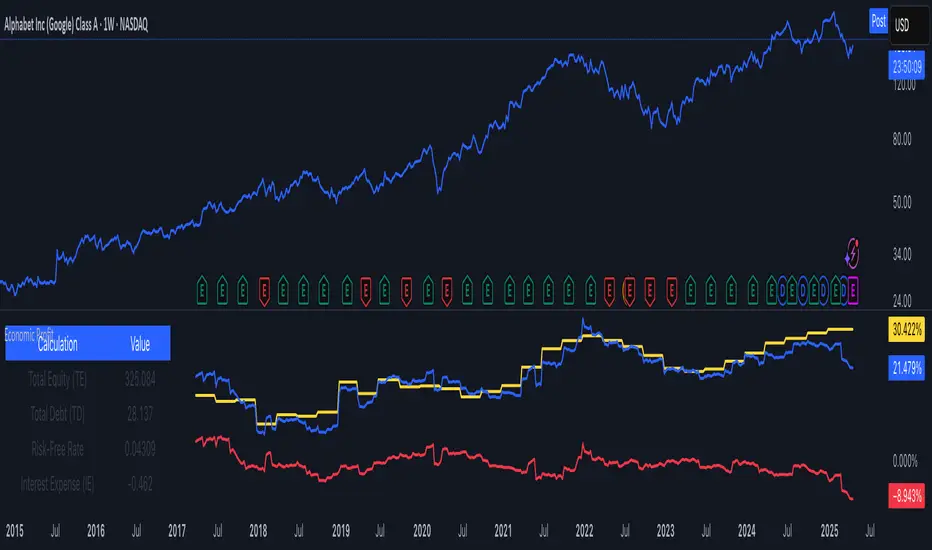
Economic Profit (YavuzAkbay)The Economic Profit Indicator is a Pine Script™ tool for assessing a company’s economic profit based on key financial metrics like Return on Invested Capital (ROIC) and Weighted Average Cost of Capital (WACC). This indicator is designed to give traders a more accurate understanding of risk-adjusted returns.
Features
Customizable inputs for Risk-Free Rate and Corporate Tax Rate assets for people who are trading in other countries.
Calculates Economic Profit based on ROIC and WACC, with values shown as both plots and in an on-screen table.
Provides detailed breakdowns of all key calculations, enabling deeper insights into financial performance.
How to Use
Open the stock to be analyzed. In the settings, enter the risk-free asset (usually a 10-year bond) of the country where the company to be analyzed is located. Then enter the corporate tax of the country (USCTR for the USA, DECTR for Germany). Then enter the average return of the index the stock is in. I prefer 10% (0.10) for the SP500, different rates can be entered for different indices. Finally, the beta of the stock is entered. In future versions I will automatically pull beta and index returns, but in order to publish the indicator a bit earlier, I have left it entirely up to the investor.
How to Interpret
We see 3 pieces of data on the indicator. The dark blue one is ROIC, the dark orange one is WACC and the light blue line represents the difference between WACC and ROIC.
In a scenario where both ROIC and WACC are negative, if ROIC is lower than WACC, the share is at a complete economic loss.
In a scenario where both ROIC and WACC are negative, if ROIC has started to rise above WACC and is moving towards positive, the share is still in an economic loss but tending towards profit.
A scenario where ROIC is positive and WACC is negative is the most natural scenario for a company. In this scenario, we know that the company is doing well by a gradually increasing ROIC and a stable WACC.
In addition, if the ROIC and WACC difference line goes above 0, the company is now economically in net profit. This is the best scenario for a company.
My own investment strategy as a developer of the code is to look for the moment when ROIC is greater than WACC when ROIC and WACC are negative. At that point the stock is the best time to invest.
Trading is risky, and most traders lose money. The indicators Yavuz Akbay offers are for informational and educational purposes only. All content should be considered hypothetical, selected after the facts to demonstrate my product, and not constructed as financial advice. Decisions to buy, sell, hold, or trade in securities, commodities, and other investments involve risk and are best made based on the advice of qualified financial professionals. Past performance does not guarantee future results.
This indicator is experimental and will always remain experimental. The indicator will be updated by Yavuz Akbay according to market conditions.
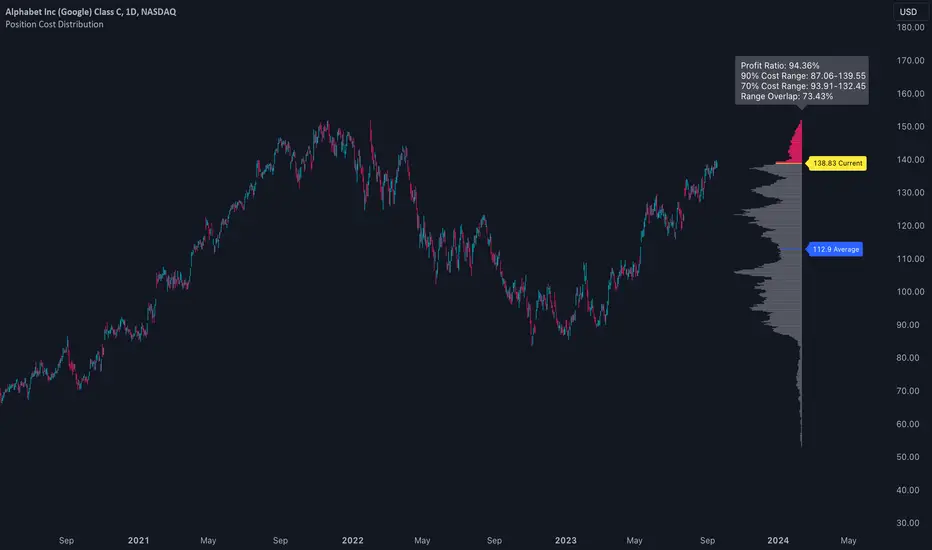
Position Cost DistributionThe Position Cost Distribution indicator (also known as the Market Position Overview, Chip Distribution, or CYQ Algorithm) provides an estimate of how shares are distributed across different price levels. Visually, it resembles the Volume Profile indicator, though they rely on distinct computational approaches.
🟠 Principle
The Position Cost Distribution algorithm is based on the principle that a security's total shares outstanding usually remains constant, except under conditions like stock splits, reverse splits, or new share issuance. It views all trading activity as simply exchanging share positions between holders at different price points.
By analyzing daily trade volume and the prior day's distribution, the algorithm infers the resulting share distribution after each day. By tracking these inferred transpositions over time, the indicator builds up an aggregate view of the estimated share concentration at each price level. This provides insights into potential buying and selling pressure zones that could form support or resistance areas.
Together with the Volume Profile, the Position Cost Distribution gives traders multiple lenses for examining market structure from both a volume and positional standpoint. Both can help identify meaningful technical price levels.
🟠 Algorithm
The algorithm initializes by allocating all shares to the price range encompassed by the first bar displayed on the chart. Preferably, the chart window should include the stock's IPO date, allowing the model to distribute shares specifically to the IPO price.
For subsequent trading sessions, the indicator performs the following calculations:
1. The daily turnover ratio is calculated by dividing the bar's trading volume by total outstanding shares.
2. For each price level (bucket), the number of shares is reduced by the turnover amount to represent shares transferring from existing holders.
3. The bar's total volume is then added to buckets corresponding to that period's price range.
Currently, the model assumes each share has an equal probability of being exchanged, regardless of how long ago it was acquired or at what price. Potential optimizations could incorporate factors like making shares held longer face a smaller chance of transfer compared to more recently purchased shares.
────────────────────────────────────────────
中文介绍:该指标为“筹码分布”的一个 TradingView 实现 :)
Average purchase price 0.1 [PATREND]
Average purchase price
This tool calculates the average purchase and sell price and the profit/loss ratio for the selected symbol based on the user's inputs for the purchase and sell prices and the entry and exit amounts.
Using Average purchase price with DCA strategy
This tool can be used to track the performance of your dollar cost averaging (DCA) investment strategy.
This tool allows you to enter information about your purchase and sell transactions, such as the purchase and sell price and the entry and exit amount, and it calculates the average purchase and sell price and the profit/loss ratio based on this information.
When using a DCA strategy, you can enter information about your regular purchase and sell transactions and the tool will calculate the average purchase and sell price for you.
You can use this information to determine if your strategy is working well and make the necessary adjustments.
In addition, this tool can help you determine when you should increase or decrease the regular investment amounts that you make as part of your DCA strategy.
It can also show you the profit/loss ratio for each sell transaction that you made.
_________________________________
We hope you find it useful.
Don't hesitate to try this tool and customize its settings to meet your trading needs.
We look forward to seeing your opinions and comments.
______________________________________________________________________________________________________
Average purchase price
هذه الأداة تحسب متوسط سعر الشراء والبيع ونسبة الربح / الخسارة للرمز المحدد بناءً على إدخالات المستخدم لأسعار الشراء والبيع ومبالغ الدخول والخروج.
استخدام Average purchase price مع استراتيجية DCA
يمكن استخدام هذه الأداة لتتبع أداء استراتيجية الاستثمار المتوسط التكلفة الدولارية (DCA) الخاصة بك.
تتيح لك هذه الأداة إدخال معلومات عن عمليات الشراء والبيع الخاصة بك، مثل سعر الشراء والبيع وكمية الدخول والخروج، ويقوم بحساب متوسط سعر الشراء والبيع ونسبة الربح / الخسارة بناءً على هذه المعلومات.
عند استخدام استراتيجية DCA، يمكنك إدخال معلومات عن عمليات الشراء والبيع المنتظمة التي تقوم بها وستقوم الأداة بحساب متوسط سعر الشراء والبيع لك. يمكنك استخدام هذه المعلومات لتحديد ما إذا كانت استراتيجيتك تعمل بشكل جيد وإجراء التعديلات اللازمة.
بالإضافة إلى ذلك
يمكن لهذه الأداة مساعدتك في تحديد متى يجب عليك زيادة أو تقليل مبالغ الاستثمار المنتظمة التي تقوم بها كجزء من استراتيجية DCA. كما يمكنها أن تظهر لك نسبة الربح / الخسارة في كل عملية بيع قمت بها.
تصرف كخبير ترجمه مختص باسواق المال وترجم هذا النص للغه الانكليزيه بشكل دقيق
_________________________________
نأمل أن تجدوه مفيدًا لكم .
لا تترددوا في تجربة هذه الأداة وتخصيص إعداداتها لتلبية احتياجاتكم التداولية.
نتطلع إلى رؤية آرائكم وتعليقاتكم .

Anchored VWAP+This indicator is an enhanced version of the Anchored VWAP indicator with additional functions:
1. Anchored AP (average price). It removes the volume weighting step in Anchored VWAP, and can display the average price over a period of time. For example, if the price of the stock in the last 3 days is 100, 200, 300, then AP is their average value of 200
2. Anchored AC (average cost). The average cost over time can be displayed. For example, if the price of the stock in the last 2 days is 100,300, then AC is (1+1)/(1/100+1/300)=150
When using the indicator, you need to choose a starting point, then the indicator will start to calculate the subsequent VWAP, AP and AC from this starting point, and draw 3 lines in the graph
These three lines can be regarded as the average cost line of the market, with potential support and resistance effects
We have filled the shadow between VWAP and AP, which can be regarded as a potential support resistance band
===========================中文版本===========================
该指标为增强版本的Anchored VWAP指标。在Anchored VWAP基础上增加了额外功能:
1. Anchored AP。其去掉了Anchored VWAP中成交量加权的步骤,可以显示一段时间的平均价格。举个例子,假如股票最近3天的价格为100,200,300,那么AP为他们的平均值200
2. Anchored AC。可以显示一段时间的平均成本。举个例子,假如股票最近2天的价格为100,300,那么AC为(1+1)/(1/100+1/300)=150
使用指标时你需要先选择一个起点,随后指标将会以该起点开始计算后续的VWAP、AP和AC,并且在图中绘制3根线
这3根线均可以视作是市场的平均成本线,具有潜在的支撑和阻力效果
我们让VWAP和AP之间填充了阴影,该阴影可以视作潜在的支撑阻力带

Average Cost (Costo Promedio)ENGLISH
This 'Average Cost' script allows the user to input and visualize profit or loss for different stocks (up to 50) with average cost and quantity data on a single chart. This is useful for tracking the profit or loss of each stock in real-time.
To use this script, the user should follow these steps:
1. Add the 'Average Cost' script to your TradingView chart.
2. In the script's configuration window, input the tickers, average costs, and quantity of shares for each ticker you want to monitor.
3. Click 'Accept' to apply the changes.
This script is primarily designed for stock markets, but can also be useful in other financial markets where the user is interested in tracking the performance of multiple assets.
ESPAÑOL
Este script de "Costo Promedio" permite al usuario ingresar y visualizar si hay ganancia o perdida para diferentes acciones (hasta 50) con los datos de costos promedio y cantidad de acciones en un solo gráfico. Esto es útil para realizar un seguimiento de la ganancia o pérdida de cada acción en tiempo real.
Para utilizar este script, el usuario debe seguir estos pasos:
1. Agregue el script "Costo Promedio" a su gráfico en TradingView.
2. En la ventana de configuración del script, ingrese los tickers, costos promedio y cantidad de acciones para cada ticker que desee monitorear.
3. Haga clic en "Aceptar" para aplicar los cambios.
Este script está diseñado principalmente para los mercados de acciones, pero también puede ser útil en otros mercados financieros donde el usuario esté interesado en rastrear el rendimiento de múltiples activos.

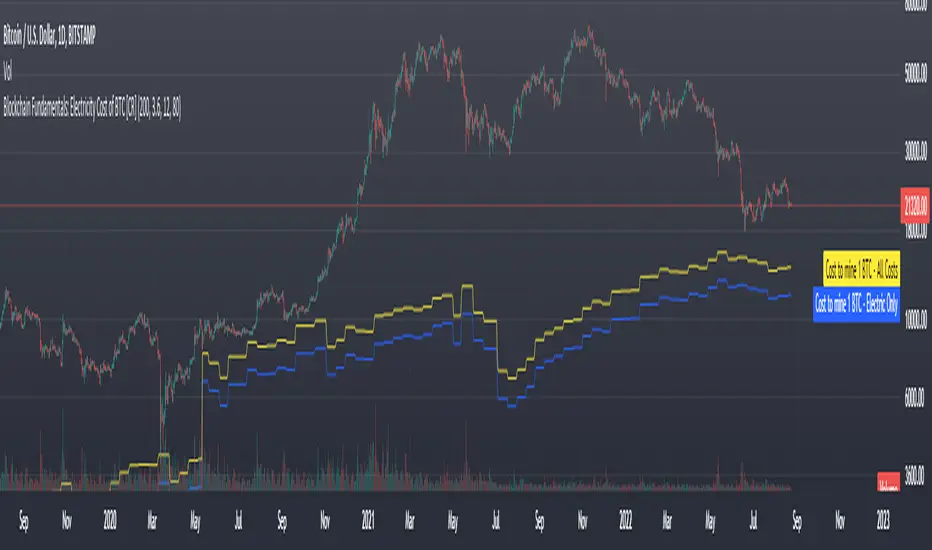
Blockchain Fundamentals: Electricity Cost of BTC [CR] Blockchain Fundamentals: Electricity Cost of BTC
After a hiatus, now a return to publishing tools and scripts for the community. This is my first script in over and year, and I have a number more coming soon as well! (so Stay Tuned!)
This is a simple calculator to estimate the cost of Bitcoin miners to mine one bitcoin. It works on all timeframes (doesnt have to be on daily).
By entering the inputs of total TH's, kWh used, cost of electricity per kWh (in USD cents) we can generate the electricity cost.
But miners also have other costs of operation including HVAC, maintenance, rent, etc. In light of that we include a multiplier that accounts for these extra costs. First, type in what percent of your total operating costs come from the electricity. Then check the enable total cost plot option and you will also see total costs in addition to electricity costs.
Its a simple model and gives anyone curious a starting point for their own testing and research.
SrgArt_NoteTrade Position Calculator
This indicator is intended for those who use manual classic trades with stop losses, take profits in their trading and determine the % risk of their deposit in each trade (without safety orders)
The indicator is a calculator for calculating a position on a trade, taking into account risk management.
How to use:
1) Enter your initial trading deposit in the settings
2) Specify the parameters of your transaction: % TP, % SL
3) Enter the risk value for the transaction in%: what part of the deposit will you lose if the transaction is closed by stop loss
4) The leverage with which you will enter the deal is indicated
5) Calculations are made in the table:
- what will be your profit in case of closing the deal on TP (in $)
- what will be your loss in case of closing the transaction on SL (in $)
- how much of your $ you need to allocate to open a position at the risks you set and the leverage used
- how much $, taking into account the leverage, will be used in the transaction

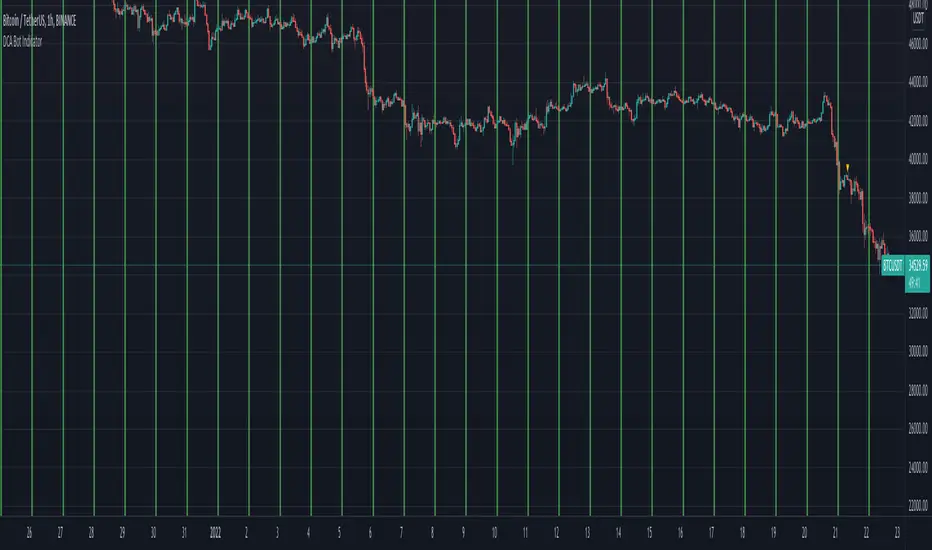
DCA Bot IndicatorName: DCA Bot Indicator
Category: Dollar Cost Average.
Operating mode: Alerts at a specific time, day of the week and day of the month.
Trades duration: N/A.
Timeframe: 1H
Suggested usage: long-term investing DCA strategies.
Entry: Only indicates the time and then the day of the week or the day of the month to buy.
Exit: As per long-term Investor’s strategy.
Usage: If you want to perform a Dollar Cost Averaging approach with:
- Daily purchases (at a specific time)
- Weekly purchases (at a specific time and day of the week)
- Monthly purchases (at a specific time and day of the month)
It is then possible to set the alert text with a preferred message or for use with trade automation systems. The green background identify the specific time chosen.
It is possible to identify through the Bias Analyzer the best time for the daily purchase.
Configuration:
- Buy Time: hour you would like to buy, please consider that the script is executed at the end of the defined time, so if you would like to buy at 2, have to put 1.
- Buy only Days of the Week: you can select the day you want.
- Buy only on Day of Month, you can specify a specific day.
Credits:
- dsteaves for inspiration
Cost of SpreadAdd to a quote, set the current total transaction cost (i.e. Spread (%) to 0.04 if BTCUSDT binance future, Spread (base) 0.0001 if trading EURUSD with 1 pip net spread).
Both lines indicate the relative volatility corrected cost of trading (ATR as orange line, StdDev as cyan).


Bitcoin Production CostBitcoin's Production Cost
Based on raw data from CBECI.
Follow me to read more about the calculation logic.

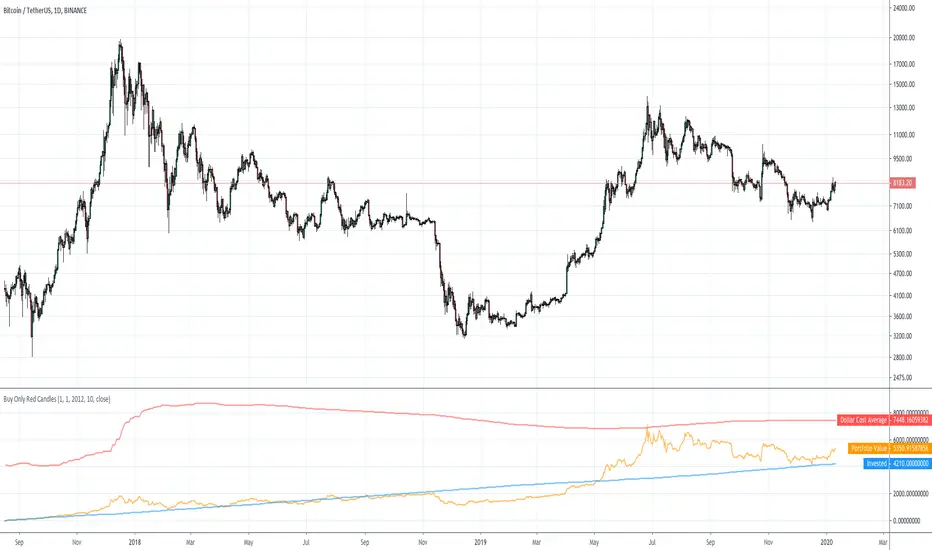
Dollar Cost Averaging Only Red CandlesThis just shows you the results if, for example, you bought the closing price each day that formed a red candle.
Works on other timeframes than daily.
In the options you can set your own start date, as well as the dollar amount to spend on each buy.
Displays your dollar cost average, total invested, and total portfolio value over time.
Bitcoin Cost of Transaction (%)The Bitcoin Relative Cost of Transaction shows the miners' revenue as a percentage of the transaction volume registered in the block.

Bitcoin Cost per Transaction (USD)The Bitcoin Cost per Transaction (USD) is the result of dividing the miners' revenue (Block Reward + Transaction Fees) between the number of transactions per block.
Here is an example with made up numbers:
Block reward is 12.5 BTC + 0.5 BTC in transaction fees.
There are 2700 transactions in the block.
Current exchange rate is 5700 USD/BTC.
(12.5 BTC + 0.5 BTC) / 2700 transactions = 0.00481481 BTC per transaction
5700 USD/BTC * 0.00481481 BTC per transaction = $27.44 per transaction
Hope that helps!

Mining Cash Flow LineTakes QUANDL Bitcoin blockchain difficulty data, three variables (hashrate in THs/sec, power consumption in kWh, and electricity costs in cents/kWh) and calculates the base line for cash flow in US dollars. The default is an AntMiner S15 at 10 cents/kWh.
When price is above this line, miners with the given conditions have positive cash flow (i.e. they make more money mining than their running costs), and when below the line, they would be better off turning their rigs off (if this simple model can be applied to their particular circumstance).
Assumptions:
1. All costs are consolidated into one "electricity cost" variable, including things like rent and wages for mining farms.
2. 12.5 BTC/block emission schedule (update source code upon next halving).
Warnings:
It is likely that actual costs to miners varies in complex ways. This indicator only shows a cash flow calculation for a very simple set of parameters that will generally apply to miners, but not necessarily all of them. (For example, a miner may be locked into a prepaid contract for cheap electricity, or sell exhaust heat in the winter for extra revenue.)
Positive cash flow is also different from ROI, as this model does not take into account the cost of acquiring an ASIC mining rig.
