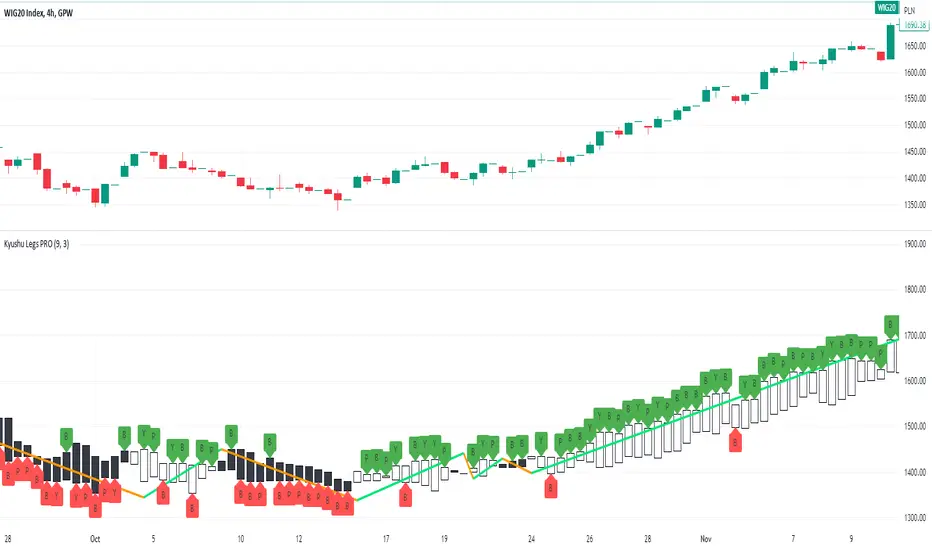
Kyushu Legs PRO

In its core idea it compares current data to the data from 9 weeks back in order to show long running trend and detect trend change moments.
This is a PRO version with all the features:
- Show Kyushu Legs
- Show Kyushu leg formations for both up and down trend
- Draw trend based on Kyushu Legs
- Sends alerts when trend is changing.
- Shows places where historically alerts were send
Script Settings:
| KYUSHU |
Legs - Check box turning on/off Kyushu Legs visualization
Length - Period length, 9 by default.
Candle body color up and down
Formations – Showing labels with B, P, Y formations
Trend – Showing trend over the chart. Line width, trend up color, trend down color
Shadow – Drawing second doted trend based on higher highs and lower lows instead of moment of detection.
| Alerts – It need to be added on the chart to work |
One alert per bar – Limits alert events to only one per bar.
Show signals – Showing dialog boxes with alert signals over the chart.
Change to trend UP – Send signal when trend direction is changing from down to UP
Change to trend DOWN – Send signal when trend direction is changing from up to DOWN
Warning !!!
You need to add alerts on the chart first to receive any notification. To do so, just click 3 dots (more icon) at the end of script name, pick “Add alert on Kyushu Legs PRO ….”, configurate your alert and press “Create” button. Now you can enable alerts in script settings.
Troubleshooting:
In case of any problems, send error details to the author of the script.
สคริปต์แบบเฉพาะผู้ได้รับเชิญเท่านั้น
เฉพาะผู้ใช้งานที่ผู้เขียนอนุมัตเท่านั้นจึงจะสามารถเข้าถึงสคริปต์นี้ได้ คุณจะต้องขอและได้รับอนุญาตก่อนใช้งาน ซึ่งโดยทั่วไปจะได้รับอนุญาตหลังจากชำระเงินแล้ว สำหรับรายละเอียดเพิ่มเติม โปรดทำตามคำแนะนำของผู้เขียนด้านล่าง หรือติดต่อ Investor_R โดยตรง
TradingView ไม่แนะนำให้จ่ายเงินหรือใช้สคริปต์ เว้นแต่คุณจะเชื่อถือผู้เขียนและเข้าใจวิธีการทำงานของสคริปต์นั้นอย่างถ่องแท้ คุณยังสามารถหาทางเลือกแบบโอเพนซอร์สฟรีได้ใน สคริปต์ชุมชนของเรา
คำแนะนำของผู้เขียน
More details on Website and Youtube.
คำจำกัดสิทธิ์ความรับผิดชอบ
สคริปต์แบบเฉพาะผู้ได้รับเชิญเท่านั้น
เฉพาะผู้ใช้งานที่ผู้เขียนอนุมัตเท่านั้นจึงจะสามารถเข้าถึงสคริปต์นี้ได้ คุณจะต้องขอและได้รับอนุญาตก่อนใช้งาน ซึ่งโดยทั่วไปจะได้รับอนุญาตหลังจากชำระเงินแล้ว สำหรับรายละเอียดเพิ่มเติม โปรดทำตามคำแนะนำของผู้เขียนด้านล่าง หรือติดต่อ Investor_R โดยตรง
TradingView ไม่แนะนำให้จ่ายเงินหรือใช้สคริปต์ เว้นแต่คุณจะเชื่อถือผู้เขียนและเข้าใจวิธีการทำงานของสคริปต์นั้นอย่างถ่องแท้ คุณยังสามารถหาทางเลือกแบบโอเพนซอร์สฟรีได้ใน สคริปต์ชุมชนของเรา
คำแนะนำของผู้เขียน
More details on Website and Youtube.