OPEN-SOURCE SCRIPT
Stochastic/LSMA
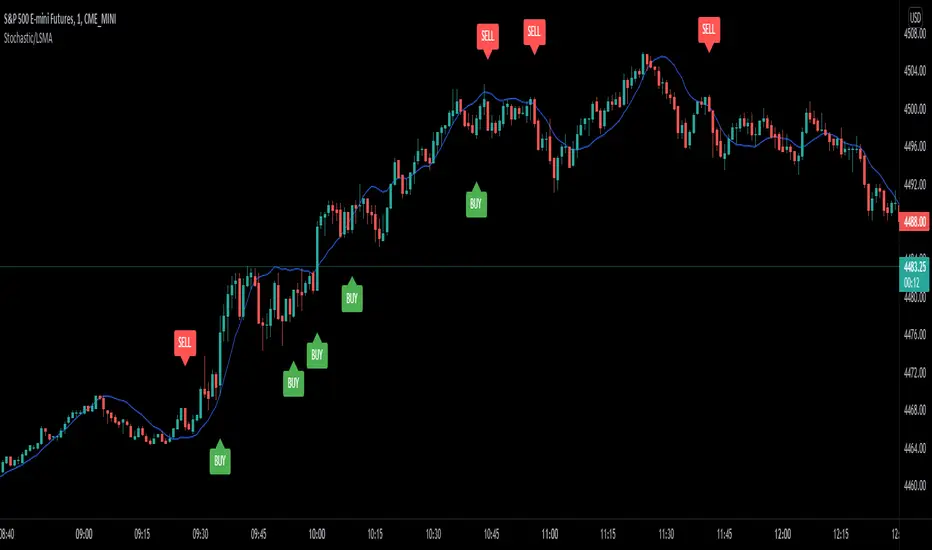
This is the Stochastic/LSMA Buy and Sell indicator. The Buy signal is generated when the %K line crosses up above the %D line from the stochastics while the signal candle is green and has come after a red candle. The Sell signal is generated when the %K line crosses down below the %D line from the stochastics while the signal candle is red and has come after a green candle. The default settings are %K Length is 5, the %K Smoothing is 3, and the %D Smoothing is 3 with the LSMA period being 30. I use this indicator to scalp 2 points at a time on the E-Mini (ES) on a 1 minute timeframe. I like to use a stop loss of 2 points and a target of 2 points. The LSMA helps to reduce fake signals and should also be used to see the overall trend. I hope this helps.
สคริปต์โอเพนซอร์ซ
ด้วยเจตนารมณ์หลักของ TradingView ผู้สร้างสคริปต์นี้ได้ทำให้เป็นโอเพนซอร์ส เพื่อให้เทรดเดอร์สามารถตรวจสอบและยืนยันฟังก์ชันการทำงานของมันได้ ขอชื่นชมผู้เขียน! แม้ว่าคุณจะใช้งานได้ฟรี แต่โปรดจำไว้ว่าการเผยแพร่โค้ดซ้ำจะต้องเป็นไปตาม กฎระเบียบการใช้งาน ของเรา
คำจำกัดสิทธิ์ความรับผิดชอบ
ข้อมูลและบทความไม่ได้มีวัตถุประสงค์เพื่อก่อให้เกิดกิจกรรมทางการเงิน, การลงทุน, การซื้อขาย, ข้อเสนอแนะ หรือคำแนะนำประเภทอื่น ๆ ที่ให้หรือรับรองโดย TradingView อ่านเพิ่มเติมใน ข้อกำหนดการใช้งาน