PROTECTED SOURCE SCRIPT
ที่อัปเดต: Jai's Algo Signals
Overview:
Jai's Algo Trade Indicator is a sophisticated trading tool designed to enhance your trading strategy by combining the strengths of two widely-used technical indicators: the Exponential Moving Average (EMA) and the Moving Average Convergence Divergence (MACD). This synergy provides a robust framework for identifying market trends and potential trade opportunities, making it ideal for both novice and experienced traders.
Justification for Combining EMA and MACD:
The EMA is a trend-following indicator that smooths out price data to highlight the direction of the trend, while the MACD is a momentum oscillator that reveals changes in the strength, direction, momentum, and duration of a trend. By integrating these two indicators, Jai's Algo Trade Indicator offers a comprehensive view of market conditions, allowing traders to make more informed decisions based on both trend direction and momentum.
How It Works:
Exponential Moving Average (EMA):
Calculation: The EMA is calculated using a user-defined period (default: 13). This moving average gives more weight to recent prices, making it responsive to new information.
Visualization: The EMA line is plotted on the chart and dynamically changes color: green when the price is above the EMA, red when below, and blue when the price is at the EMA.
Moving Average Convergence Divergence (MACD):
Calculation: The MACD is computed using three parameters: fast length (default: 12), slow length (default: 26), and signal smoothing (default: 9). The MACD line, signal line, and histogram are plotted to show the relationship between two moving averages of a security’s price.
Histogram: The MACD histogram is color-coded to indicate bullish (green), bearish (red), and neutral (gray) conditions, providing visual cues for momentum changes.
Impulse System:
Bar Colors: Bars are colored based on impulse conditions:
Green bars for bullish conditions (price above EMA and MACD histogram > 0).
Red bars for bearish conditions (price below EMA and MACD histogram < 0).
Blue bars for neutral conditions.
Trade Signals:
Buy Signal: A buy (call) signal is generated when a bullish candle crosses and closes above the EMA.
Sell Signal: A sell (put) signal is generated when a bearish candle crosses and closes below the EMA.
Visualization: Signals are displayed as green "BUY" labels below the bars and red "SELL" labels above the bars, providing clear entry and exit points.
How to Use:
Input Parameters:
Customize the EMA length, MACD fast length, slow length, and signal smoothing to fit your trading strategy and timeframe.
Visual Analysis:
Monitor the color-coded EMA line and histogram to understand the current market trend and momentum.
Use the bar colors to quickly identify bullish, bearish, and neutral conditions.
Trade Signals:
Follow the "BUY" and "SELL" signals to execute trades based on the indicator's analysis.
Combine these signals with other analysis techniques and risk management practices for optimal results.
Ideal For:
Traders looking to leverage a combination of trend-following and momentum indicators for more accurate trade entries and exits.
Those who want a clear and visual representation of market conditions to aid in their decision-making process.
Conclusion:
Jai's Algo Trade Indicator integrates the EMA and MACD to provide a powerful and comprehensive trading tool. By combining trend and momentum analysis, this indicator helps traders to make more informed decisions, enhancing their trading performance and confidence.
เอกสารเผยแพร่
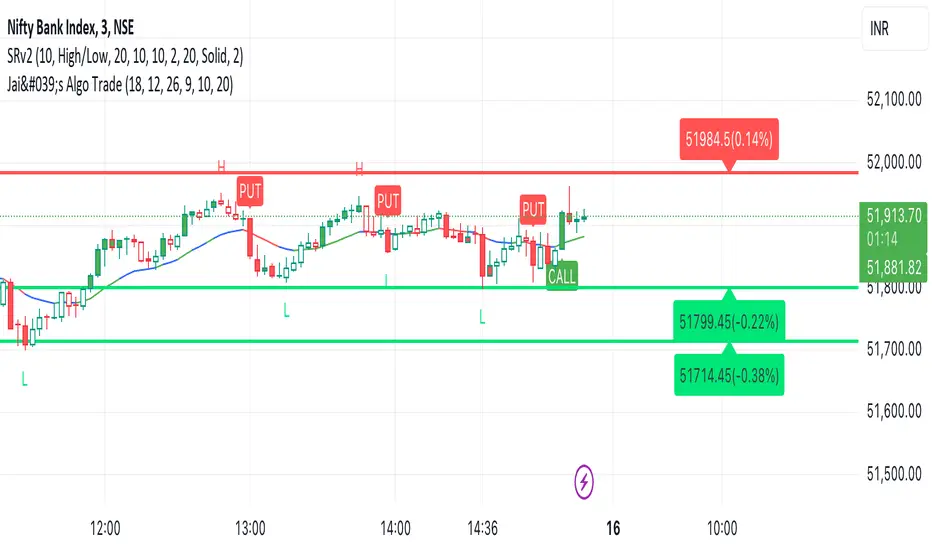
Overview:This script combines the strengths of multiple indicators (EMA, MACD, ATR Trailing Stop, and ADX) to generate reliable trading signals for both trend-following and momentum-based strategies. It provides a visual system where the color of the candles changes based on key market conditions, helping traders quickly identify bullish or bearish momentum. Additionally, it plots buy ("CALL") and sell ("PUT") signals when specific crossover events occur.
Components & Functionality:
Exponential Moving Average (EMA):
The script uses a 13-period EMA to track short-term trends and a 25-period EMA to further filter signals. When the price crosses above the 13-period EMA and bullish conditions are met, the EMA is colored green. Conversely, when bearish conditions are detected, the EMA turns red. This dynamic color-coding helps identify potential shifts in market momentum.
MACD Histogram:
The MACD indicator is a widely-used momentum indicator, and here it is displayed in a histogram format. The script plots green bars for bullish momentum and red bars for bearish momentum. These colors align with the EMA conditions to help confirm buy or sell signals.
ATR Trailing Stop:
An ATR-based trailing stop is calculated and used to help determine whether the current trend is strong or weak. When the price is above the trailing stop and EMA, it suggests a bullish trend, while price below the trailing stop suggests a bearish trend.
ADX & DI (Directional Movement Index):
The ADX is calculated with a customizable threshold to identify the strength of a trend. The buy (CALL) signal is triggered when the +DI crosses above the -DI and ADX is above the threshold, indicating strong bullish momentum. Similarly, a sell (PUT) signal is generated when -DI crosses above +DI, and ADX shows a strong bearish trend.
How to Use:
Buy Signal (CALL):
A green "CALL" label appears when the price crosses above the EMA, the MACD histogram is bullish, and the ADX indicates a strong uptrend. This is a signal to enter a long position.
Sell Signal (PUT):
A red "PUT" label appears when the price crosses below the EMA, the MACD histogram is bearish, and the ADX indicates a strong downtrend. This signals an opportunity to enter a short position.
Intended Use Case:
This strategy is useful for traders looking to capitalize on short- to medium-term market momentum while incorporating trend-following elements. It works well across multiple timeframes and markets, but it's especially effective on 1-hour and daily charts for swing trading strategies.
สคริปต์ที่ได้รับการป้องกัน
สคริปต์นี้ถูกเผยแพร่เป็นแบบ closed-source อย่างไรก็ตาม คุณสามารถใช้ได้อย่างอิสระและไม่มีข้อจำกัดใดๆ – เรียนรู้เพิ่มเติมได้ที่นี่
คำจำกัดสิทธิ์ความรับผิดชอบ
ข้อมูลและบทความไม่ได้มีวัตถุประสงค์เพื่อก่อให้เกิดกิจกรรมทางการเงิน, การลงทุน, การซื้อขาย, ข้อเสนอแนะ หรือคำแนะนำประเภทอื่น ๆ ที่ให้หรือรับรองโดย TradingView อ่านเพิ่มเติมใน ข้อกำหนดการใช้งาน