OPEN-SOURCE SCRIPT
Volatility Bands Reversal Strategy [Long Only]
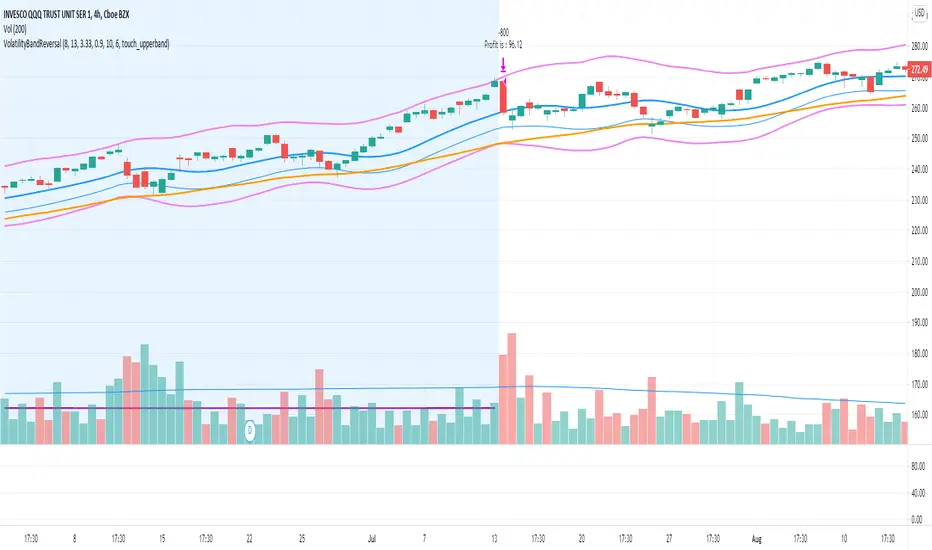
This strategy based on existng indicator available on TV
If finds the reversals for LONG entries ... I have modified the settings to back test it ...
BUY
====
When the price touches lower band , and tries to close above lower band
some signals are mixed up, you can research and look for a confirmation ...
if the middle band is above EMA50 , you can simply follow the strategy BUY signal
but if the middle band is EMA50 , wait for the price to close above middle band
Sell / Close
==========
wait for the sell signa OR close when price touches the upper band
How do you want to close , you can chose in settings. Chnage these values and see the performance
Please note , sell means just closing the existing LONG position , not short selling
Stop Loss
=========
Stop Loss is defaulted to 6%
This is tested in 1HR, 2HR and 4 HRs chart for SPY and QQQ ETFS ...
for long term investing style , 4 Hrs is the best time frme for this strategy
Warning
========
It is not a financial advise , it is for educational purposes only. Please do your own research before taking any trading decission
สคริปต์โอเพนซอร์ซ
ด้วยเจตนารมณ์หลักของ TradingView ผู้สร้างสคริปต์นี้ได้ทำให้เป็นโอเพนซอร์ส เพื่อให้เทรดเดอร์สามารถตรวจสอบและยืนยันฟังก์ชันการทำงานของมันได้ ขอชื่นชมผู้เขียน! แม้ว่าคุณจะใช้งานได้ฟรี แต่โปรดจำไว้ว่าการเผยแพร่โค้ดซ้ำจะต้องเป็นไปตาม กฎระเบียบการใช้งาน ของเรา
คำจำกัดสิทธิ์ความรับผิดชอบ
ข้อมูลและบทความไม่ได้มีวัตถุประสงค์เพื่อก่อให้เกิดกิจกรรมทางการเงิน, การลงทุน, การซื้อขาย, ข้อเสนอแนะ หรือคำแนะนำประเภทอื่น ๆ ที่ให้หรือรับรองโดย TradingView อ่านเพิ่มเติมใน ข้อกำหนดการใช้งาน