PROTECTED SOURCE SCRIPT
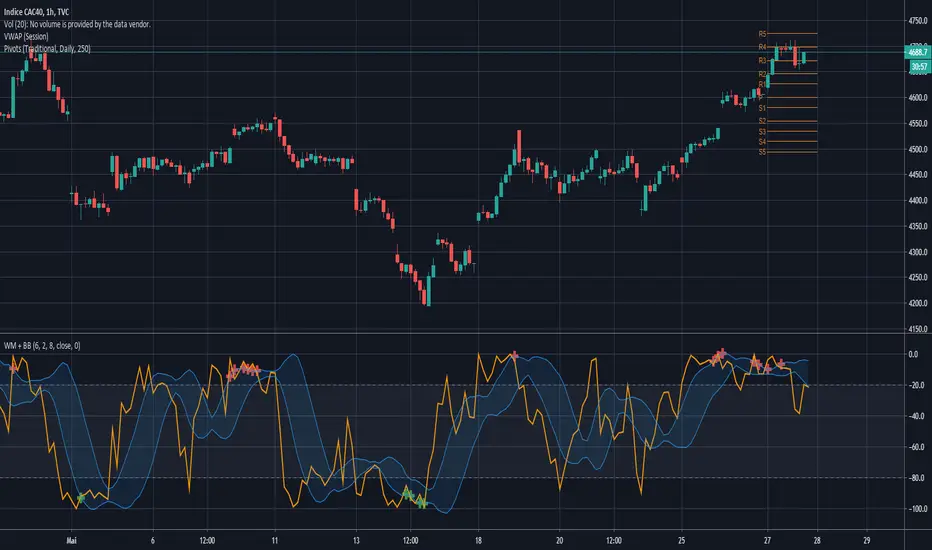
Williams + BB Buy Sell signal

Williams %R with Bollinger Bands
This script can help traders to determine if there is a buy or sell signal.
It indicates when the Williams %R crosses the Bollingers bands levels at the overbought and oversold areas.
Red cross: when the Williams crosses the upper level of BB in the overbought area, that can be considered as a double confirmation to sold.
Green cross: when the Williams crosses the lower level of BB in the oversold area, that can be considered as a double confirmation to buy.
Configuration:
This indicator gives accurate signals with this configuration:
Williams %R: period length 12
MA period: period length 8
Bollinger bands: period length 6
สคริปต์ที่ได้รับการป้องกัน
สคริปต์นี้ถูกเผยแพร่เป็นแบบ closed-source อย่างไรก็ตาม คุณสามารถใช้ได้อย่างอิสระและไม่มีข้อจำกัดใดๆ – เรียนรู้เพิ่มเติมได้ที่นี่
คำจำกัดสิทธิ์ความรับผิดชอบ
ข้อมูลและบทความไม่ได้มีวัตถุประสงค์เพื่อก่อให้เกิดกิจกรรมทางการเงิน, การลงทุน, การซื้อขาย, ข้อเสนอแนะ หรือคำแนะนำประเภทอื่น ๆ ที่ให้หรือรับรองโดย TradingView อ่านเพิ่มเติมใน ข้อกำหนดการใช้งาน