OPEN-SOURCE SCRIPT
ที่อัปเดต: 3-in-1 Custom Moving Average Indicator
Introduction
This is a 3 in 1 indicator, if used wisely could yield some good profits based on the strategy that will be detailed later.
The three indicators so combined are:
a) Moving averages - 3 Moving averages that could be customised to display SMAs and EMAs on the chart
b) Bollinger Bands
c) RSI
By default indicator is set to shown 21,55 & 100 EMAs, where 100 EMA is toggled off and is used on need base. The length and type of the moving average used can be changed based on user preference. 1st and 2nd moving average is color coded for easy identification of trend. Similarly Bollinger Bands and RSI setting too could be adjusted with the exception of the RSI signal displayed.
Following condition was set to reduce noise of RSI:
Signal will only be displayed if there is a Bullish or Bearish Engulfing candle that coincide with the overbought or oversold levels.
How to use
This method follows the known conditions that;
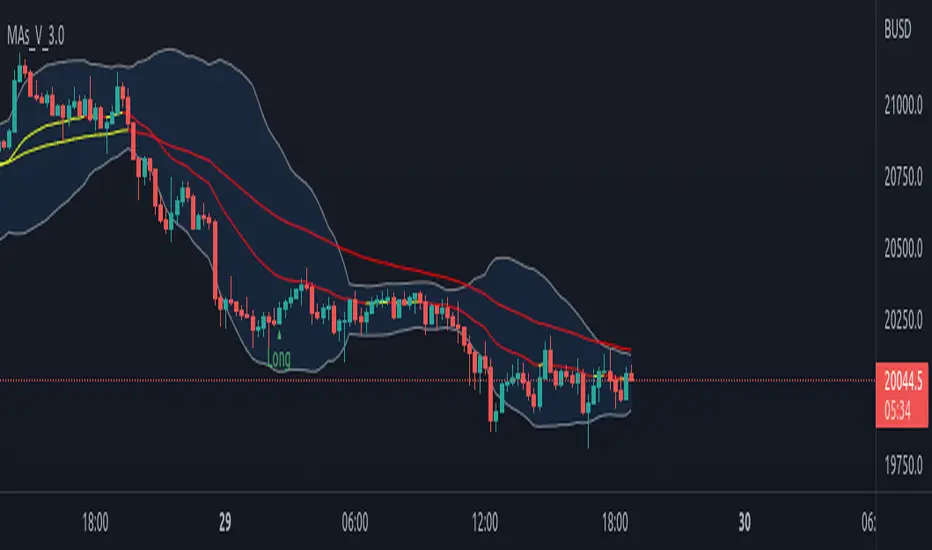
a) the price will return back to the to the Moving average like a magnate after a sudden change/divergence away from the MA
b) the price will return back to the median after breaching the Bollinger bands
c) there will be a reversal if the script is overbought or oversold
Look at the chart displayed to observe condition "a & b" and you will notice that the price always returns back to the moving average. If you time your entry correctly using trend analysis and with the help of stochastic RSI, you could profit from the price reversal.
Condition "c" is a simple add-on that is put up, to help alert you to the entry opportunity being presented. Signal from condition "c" is not absolute, it is only indicative and needs refinement, hence entry is subjective to your attention and analysis of mentioned conditions "a &b"
This is a 3 in 1 indicator, if used wisely could yield some good profits based on the strategy that will be detailed later.
The three indicators so combined are:
a) Moving averages - 3 Moving averages that could be customised to display SMAs and EMAs on the chart
b) Bollinger Bands
c) RSI
By default indicator is set to shown 21,55 & 100 EMAs, where 100 EMA is toggled off and is used on need base. The length and type of the moving average used can be changed based on user preference. 1st and 2nd moving average is color coded for easy identification of trend. Similarly Bollinger Bands and RSI setting too could be adjusted with the exception of the RSI signal displayed.
Following condition was set to reduce noise of RSI:
Signal will only be displayed if there is a Bullish or Bearish Engulfing candle that coincide with the overbought or oversold levels.
How to use
This method follows the known conditions that;
a) the price will return back to the to the Moving average like a magnate after a sudden change/divergence away from the MA
b) the price will return back to the median after breaching the Bollinger bands
c) there will be a reversal if the script is overbought or oversold
Look at the chart displayed to observe condition "a & b" and you will notice that the price always returns back to the moving average. If you time your entry correctly using trend analysis and with the help of stochastic RSI, you could profit from the price reversal.
Condition "c" is a simple add-on that is put up, to help alert you to the entry opportunity being presented. Signal from condition "c" is not absolute, it is only indicative and needs refinement, hence entry is subjective to your attention and analysis of mentioned conditions "a &b"
เอกสารเผยแพร่
DETAILS OF CHANGES MADE T O THE SCRIPT1)Improvements have been made to input UI
2)Code has been tidied and unwanted lines removed, to make script code more readable
3)Addition of more details to "introductions"
INTRODUCTION(Cont..)
Following are some of the information that was missed out in the initial intro to script
a) 1st and 2nd moving average length(21 & 55) is based on Fibonacci Numbers as the said two lengths tend to give best results on any time frame [personal observation based on my trading experience]
b) For 3rd moving average the default length chose is 100; as it is a commonly used length and it tends to show support or resistance, if 1st and 2nd MA is beached, on higher time frame. Fibonacci number of 144 can be used instead of 100 ( whatever works best for you)
c) 3rd moving average should only be used on higher time frame ranging from 15 min or higher as this gives effective long term support compared to lesser time frames.
Best result for the mentioned strategy [check how to use] for intraday trading is obtained on 5 and 15 min time frame. It can also be used as a reference on higher time frame for knowing the possible trend reversal in the short run.
เอกสารเผยแพร่
Release Notes: DETAILS OF CHANGES MADE T O THE SCRIPT1)Added the ability to change MA1 & MA2's thickness and color.
By default the thickness has been reduced to get a better reading on the rate of change happening
2)Added an alert that will better help with the strategy outlined for this setup.
By default alert% has been set to 0.75%. Optimal setting is anywhere between 1.05% and 0.60%.
3)Addition of more details to "introductions"
INTRODUCTION(Cont..)
Following are some of the additional information that maybe helpful for better utilisation of the indicator as well as strategy
a)Use the alert feature on 2hr time frame
Go to 2hr time frame>Add alerts>Condition> MAs_V_2.0>RateOfChange>Once per bar
b)Once alert is triggered shift back to 15min chart and observer if "a&b" of how to use is visible(see intro June 1,2021)
i.e if price is away from 21 EMA and breaches the bollinger bands. If yes, then you can take a reversal entry and book profit once candle/price touched the 21 EMA
Note: Along with the 21EMA you may use a 9 EMA to get a cleaner entry.Meaning if price is away from 21 EMA and there is a reasonable gap between candle formations and 9 EMA and you spot a reversal candle forming(green in a falling market and red when in an uptrend), then take the entry. Exit 20-25% of you position when price touches 9EMA..Completely exit position when price touches 21 EMA or you can hold 25% instead of fully exiting and see if it goes up after 21EMA is touched.
Always don't forget to use Stop Loss[SL] to protect capital from adverse move or if price goes against your prediction
สคริปต์โอเพนซอร์ซ
ด้วยเจตนารมณ์หลักของ TradingView ผู้สร้างสคริปต์นี้ได้ทำให้เป็นโอเพนซอร์ส เพื่อให้เทรดเดอร์สามารถตรวจสอบและยืนยันฟังก์ชันการทำงานของมันได้ ขอชื่นชมผู้เขียน! แม้ว่าคุณจะใช้งานได้ฟรี แต่โปรดจำไว้ว่าการเผยแพร่โค้ดซ้ำจะต้องเป็นไปตาม กฎระเบียบการใช้งาน ของเรา
คำจำกัดสิทธิ์ความรับผิดชอบ
ข้อมูลและบทความไม่ได้มีวัตถุประสงค์เพื่อก่อให้เกิดกิจกรรมทางการเงิน, การลงทุน, การซื้อขาย, ข้อเสนอแนะ หรือคำแนะนำประเภทอื่น ๆ ที่ให้หรือรับรองโดย TradingView อ่านเพิ่มเติมใน ข้อกำหนดการใช้งาน