OPEN-SOURCE SCRIPT
Intraday Volatility Bars
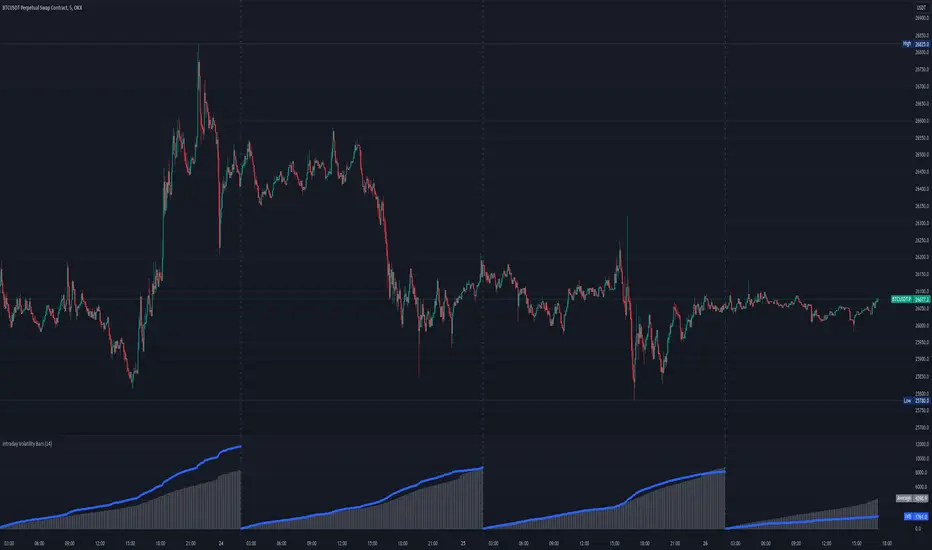
This script produce a volatility histrogram by bar with the current volatility overlayed.
The histogram shows cumulative average volatility over n days.
And the dots are todays cumulative volatility.
In other words, it calculates the True Range of each bar and adds it to todays value.
This script is build for intraday timeframes between one and 1440 minutes only.
I use this to show me when volatility is above/below/equal to the average volatility.
When the dots are above the histogram then it is a more volatile day, and vice versa.
Recognizing a more volatile day as early as possible can be an advantage for daytrader.
Days that start with higher volatility seems to continue to increase relative to the past few days. Or when midday volatility rises it seems to continue as well.
Happy Trading!
สคริปต์โอเพนซอร์ซ
ด้วยเจตนารมณ์หลักของ TradingView ผู้เขียนสคริปต์นี้ได้เผยแพร่เป็นโอเพนซอร์ส เพื่อให้เทรดเดอร์สามารถเข้าใจและตรวจสอบได้ ต้องขอบคุณผู้เขียน! ที่ให้คุณใช้ได้ฟรี แต่การนำโค้ดนี้ไปใช้ในการเผยแพร่ซ้ำจะต้องอยู่ภายใต้ กฎระเบียบการใช้งาน คุณสามารถตั้งเป็นรายการโปรดเพื่อใช้บนชาร์ตได้
คำจำกัดสิทธิ์ความรับผิดชอบ
ข้อมูลและบทความไม่ได้มีวัตถุประสงค์เพื่อก่อให้เกิดกิจกรรมทางการเงิน, การลงทุน, การซื้อขาย, ข้อเสนอแนะ หรือคำแนะนำประเภทอื่น ๆ ที่ให้หรือรับรองโดย TradingView อ่านเพิ่มเติมที่ ข้อกำหนดการใช้งาน