OPEN-SOURCE SCRIPT
Weekly/Monthly Close
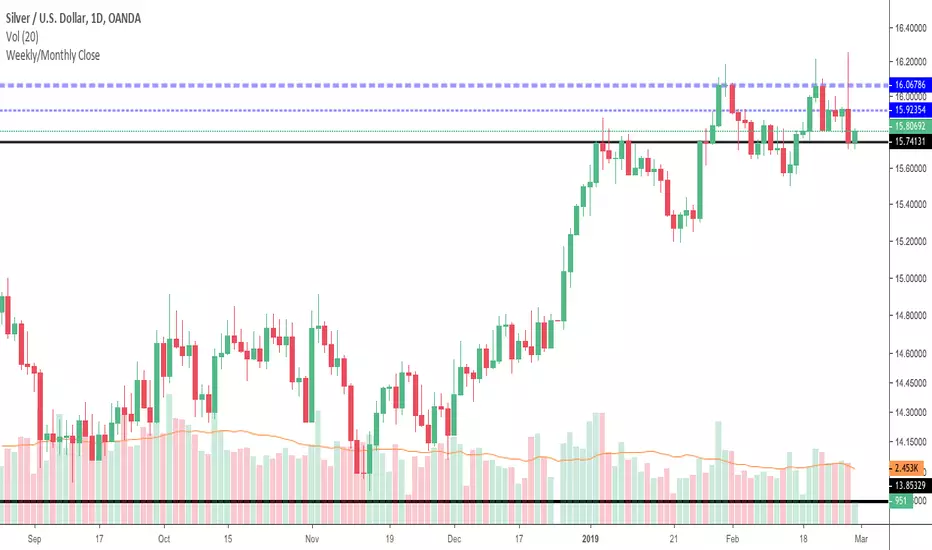
Just a simple support/resistance indicator that display weekly/monthly close price and it is configurable to work in two modes:
See how last month's close (ticker blue line) provides nice resistance and the price forms a double top then it consolidates under last week's close line (thiner blue line).

It also works on intraday charts and displays history close prices, see below how last month's close (ticker blue line) provides support over and over and also how price bounces off weekly close history prices (thiner blue line).

- tracking mode - to display last week/month's close
- history mode - to display weekly/monthly close prices
See how last month's close (ticker blue line) provides nice resistance and the price forms a double top then it consolidates under last week's close line (thiner blue line).
It also works on intraday charts and displays history close prices, see below how last month's close (ticker blue line) provides support over and over and also how price bounces off weekly close history prices (thiner blue line).
สคริปต์โอเพนซอร์ซ
ด้วยเจตนารมณ์หลักของ TradingView ผู้สร้างสคริปต์นี้ได้ทำให้เป็นโอเพนซอร์ส เพื่อให้เทรดเดอร์สามารถตรวจสอบและยืนยันฟังก์ชันการทำงานของมันได้ ขอชื่นชมผู้เขียน! แม้ว่าคุณจะใช้งานได้ฟรี แต่โปรดจำไว้ว่าการเผยแพร่โค้ดซ้ำจะต้องเป็นไปตาม กฎระเบียบการใช้งาน ของเรา
คำจำกัดสิทธิ์ความรับผิดชอบ
ข้อมูลและบทความไม่ได้มีวัตถุประสงค์เพื่อก่อให้เกิดกิจกรรมทางการเงิน, การลงทุน, การซื้อขาย, ข้อเสนอแนะ หรือคำแนะนำประเภทอื่น ๆ ที่ให้หรือรับรองโดย TradingView อ่านเพิ่มเติมใน ข้อกำหนดการใช้งาน