OPEN-SOURCE SCRIPT
Crypto USDT Volume
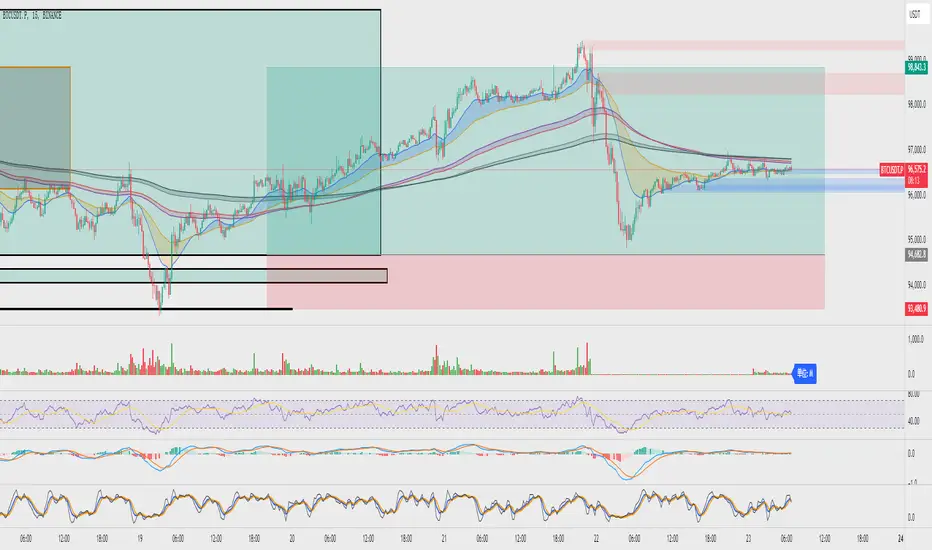
Script Title: USDT Volume
This TradingView indicator calculates a volume metric weighted by price, referred to as "Money." It works by first computing the typical price for each bar as the average of the open, high, low, and close prices. Multiplying this typical price by the bar's volume yields the Money value, which serves as a proxy for the dollar (or USDT) flow during that period.
To improve readability, the script dynamically adjusts the units based on recent data. It examines the highest Money value over the past 100 bars and applies a scaling factor:
Values above 1e9 are scaled to billions (B),
Above 1e6 to millions (M),
Above 1e3 to thousands (K),
Otherwise, no scaling is applied.
The indicator plots these scaled Money values as a column chart. It uses TradingView's default colors—green for bullish bars (where the open is less than the close) and red for bearish bars. Additionally, a label is updated on the last bar to display the current unit used for scaling.
Overall, this script provides a visually intuitive way to track and compare the volume-weighted money flow, making it easier to analyze market activity.
สคริปต์โอเพนซอร์ซ
ด้วยเจตนารมณ์หลักของ TradingView ผู้สร้างสคริปต์นี้ได้ทำให้เป็นโอเพนซอร์ส เพื่อให้เทรดเดอร์สามารถตรวจสอบและยืนยันฟังก์ชันการทำงานของมันได้ ขอชื่นชมผู้เขียน! แม้ว่าคุณจะใช้งานได้ฟรี แต่โปรดจำไว้ว่าการเผยแพร่โค้ดซ้ำจะต้องเป็นไปตาม กฎระเบียบการใช้งาน ของเรา
คำจำกัดสิทธิ์ความรับผิดชอบ
ข้อมูลและบทความไม่ได้มีวัตถุประสงค์เพื่อก่อให้เกิดกิจกรรมทางการเงิน, การลงทุน, การซื้อขาย, ข้อเสนอแนะ หรือคำแนะนำประเภทอื่น ๆ ที่ให้หรือรับรองโดย TradingView อ่านเพิ่มเติมใน ข้อกำหนดการใช้งาน