OPEN-SOURCE SCRIPT
Weekly Stock Trend Trading Tool
// Created by TheBullTrader, 2017.
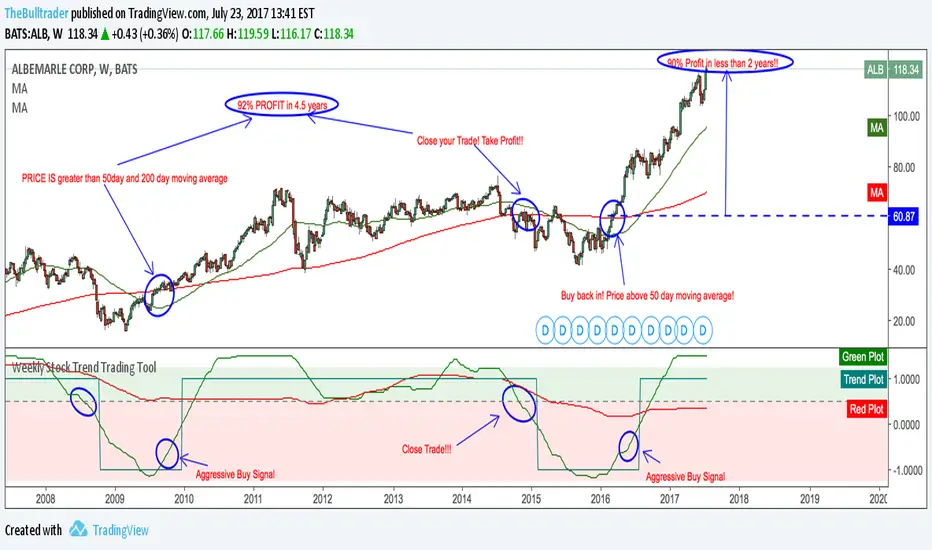
// Hi everyone, welcome to my Weekly Trend Trading Tool with the 50 day and 200 day moving averages
// This indicator scores each stock/ index individually and scores them on a simple scale -1.5 to +1.5
// This indicator has 2 zones: green zone = bullish, and red zone = bearish
// There are 3 plots: green = 50 day sma, red = 200 day sma, and trend signal= teal
// Buying Signal is when the green plot crosses teal plot or AGGRESSIVE Buy = green plot beginning to curve up from bearish zone.
// Sell Signal is when the green plot enters the RED ZONE
// By using this indicator as described, it will help you pick stock bottoms and COULD GET YOU OUT OF A STOCK CRASH!
// Recommendations is to scan this indicator against the top 100 US stocks with a long stock history greater than 10 years.
// I usually find 5-10 really good deals every few months. Slow and Easy way to build wealth. **Thanks for reading**
สคริปต์โอเพนซอร์ซ
ด้วยเจตนารมณ์หลักของ TradingView ผู้สร้างสคริปต์นี้ได้ทำให้เป็นโอเพนซอร์ส เพื่อให้เทรดเดอร์สามารถตรวจสอบและยืนยันฟังก์ชันการทำงานของมันได้ ขอชื่นชมผู้เขียน! แม้ว่าคุณจะใช้งานได้ฟรี แต่โปรดจำไว้ว่าการเผยแพร่โค้ดซ้ำจะต้องเป็นไปตาม กฎระเบียบการใช้งาน ของเรา
คำจำกัดสิทธิ์ความรับผิดชอบ
ข้อมูลและบทความไม่ได้มีวัตถุประสงค์เพื่อก่อให้เกิดกิจกรรมทางการเงิน, การลงทุน, การซื้อขาย, ข้อเสนอแนะ หรือคำแนะนำประเภทอื่น ๆ ที่ให้หรือรับรองโดย TradingView อ่านเพิ่มเติมใน ข้อกำหนดการใช้งาน