PROTECTED SOURCE SCRIPT
Daily Data
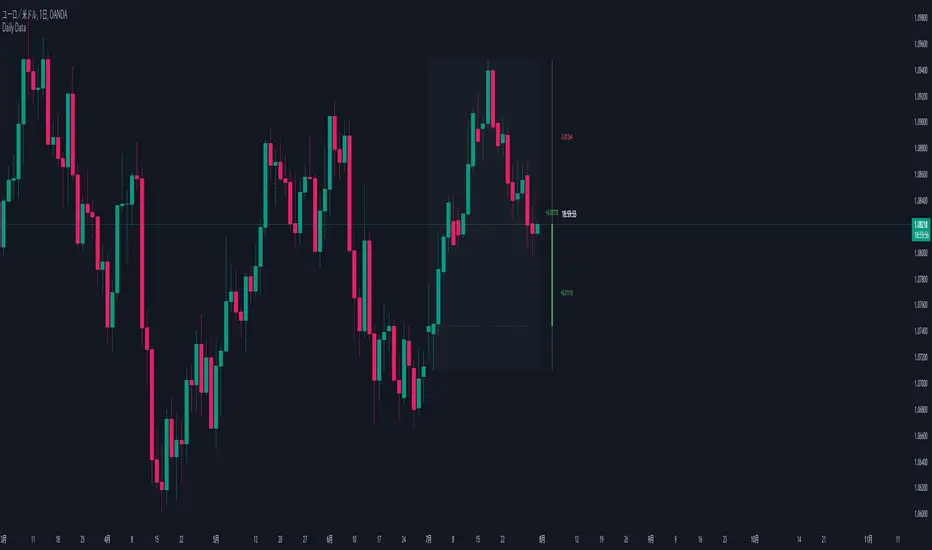
1. Purpose:
This indicator visualizes higher timeframe data on lower timeframe charts, facilitating multi-timeframe analysis. It recreates and extends the functionality of the MQL indicator of the same name in PineScript.
2. Key Features:
a. Higher Timeframe Candle Display:
- Displays monthly data by default, but users can select any timeframe.
- Customizable candle colors (bullish/bearish), wick, and body sizes.
- Adjustable offset to change display position on the chart.
b. Price Range Box:
- Shows the high and low range of the higher timeframe as a semi-transparent box.
- Customizable background color.
c. Fibonacci Levels:
- Displays 7 Fibonacci levels within the higher timeframe price range (0, 23.6%, 38.2%, 50%, 61.8%, 78.6%, 100%).
- Uses different colors for each level and shows level values as labels.
- Can be toggled on/off.
d. Information Labels:
- Remaining Time Display: Countdown to the end of the current higher timeframe candle.
- Delta Display: Shows price change from the open of the current higher timeframe.
- Distance from High/Low: Displays the difference between current price and high/low.
- Each label can be customized for visibility and color.
3. Special Features:
- Displays "MARKET IS CLOSED" when the market is not open.
- Time display format includes months, days, hours, minutes, and seconds, abbreviated as needed.
- Delta and distance values change color based on positive/negative values and are displayed with up/down arrows.
4. Customizability:
- Extensive input options allow users to fine-tune appearance and functionality.
- Individual settings for colors, sizes, offsets, and display items.
สคริปต์ที่ได้รับการป้องกัน
สคริปต์นี้ถูกเผยแพร่เป็นแบบ closed-source อย่างไรก็ตาม คุณสามารถใช้ได้อย่างอิสระและไม่มีข้อจำกัดใดๆ – เรียนรู้เพิ่มเติมได้ที่นี่
คำจำกัดสิทธิ์ความรับผิดชอบ
ข้อมูลและบทความไม่ได้มีวัตถุประสงค์เพื่อก่อให้เกิดกิจกรรมทางการเงิน, การลงทุน, การซื้อขาย, ข้อเสนอแนะ หรือคำแนะนำประเภทอื่น ๆ ที่ให้หรือรับรองโดย TradingView อ่านเพิ่มเติมใน ข้อกำหนดการใช้งาน