OPEN-SOURCE SCRIPT
EMA-BAND-PIVOT-VCP
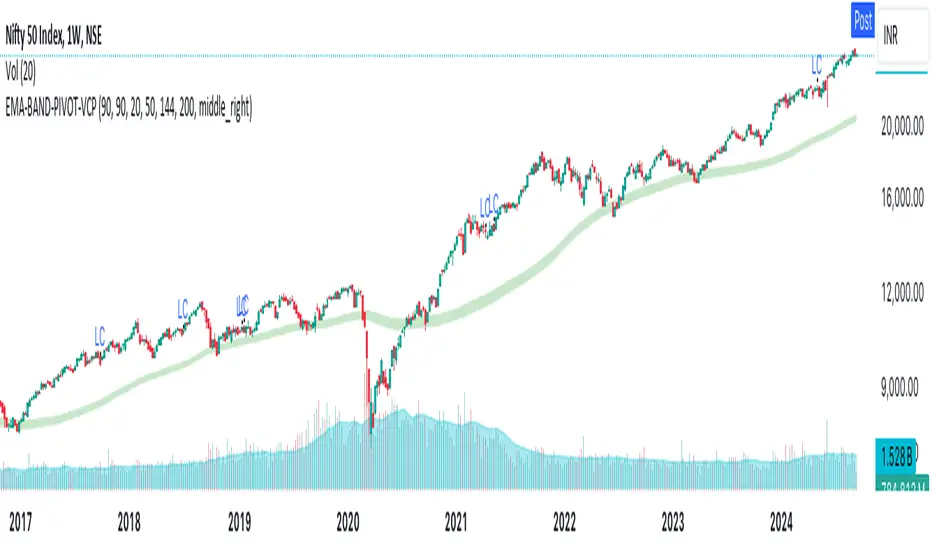
This indicator is named "EMA-BAND-PIVOT-VCP" and integrates multiple elements such as moving averages, volume, volatility contraction patterns (VCP), pivot points, and a table to display key market metrics.
Key Features:
Moving Averages: ( 4 - EMA) default settings 20 , 50 ,144 , 200 . Can be changed in settings.
Pivot Highs and Lows:
The script detects pivot highs and pivot lows using customizable left and right lengths and plots labels to mark these points on the chart.
TIG BAND : This is setting of 2 sma - with the high and low of 90 day average which forms like a band . Its a very strong indicator of trend . Buying is suggestable above this .This has to be tested on your own to knowhow it works wonders ( price magnet). Works on all timeframes . (credit : Bhushan Sir from TIG ) .These are the best buy areas.
Volatility Contraction :
It identifies specific price contraction pattern .
vc marked - used 4 candles - first candle is the mother bar ., 2,3 and 4th candles complete range ( high to low ) is within the range of mother candle.
lc marked -here the closing is considered not the wicks. used 8 candles., the 7 candles closing is within the range of motherbar. Crosses are plotted on the last candle
Table Display:
A table is displayed on the chart with data such as EMA values, relative volume (RVol), Average Daily Range (ADR), and volume ratios. This gives a comprehensive overview of current market conditions.(RVol) compared to the 50-period volume SMA, percentage volume change, and other metrics is also displayed.
สคริปต์โอเพนซอร์ซ
ด้วยเจตนารมณ์หลักของ TradingView ผู้สร้างสคริปต์นี้ได้ทำให้เป็นโอเพนซอร์ส เพื่อให้เทรดเดอร์สามารถตรวจสอบและยืนยันฟังก์ชันการทำงานของมันได้ ขอชื่นชมผู้เขียน! แม้ว่าคุณจะใช้งานได้ฟรี แต่โปรดจำไว้ว่าการเผยแพร่โค้ดซ้ำจะต้องเป็นไปตาม กฎระเบียบการใช้งาน ของเรา
คำจำกัดสิทธิ์ความรับผิดชอบ
ข้อมูลและบทความไม่ได้มีวัตถุประสงค์เพื่อก่อให้เกิดกิจกรรมทางการเงิน, การลงทุน, การซื้อขาย, ข้อเสนอแนะ หรือคำแนะนำประเภทอื่น ๆ ที่ให้หรือรับรองโดย TradingView อ่านเพิ่มเติมใน ข้อกำหนดการใช้งาน