OPEN-SOURCE SCRIPT
EMA Alignment & Spread Monitor (Sang Youn)
Overview
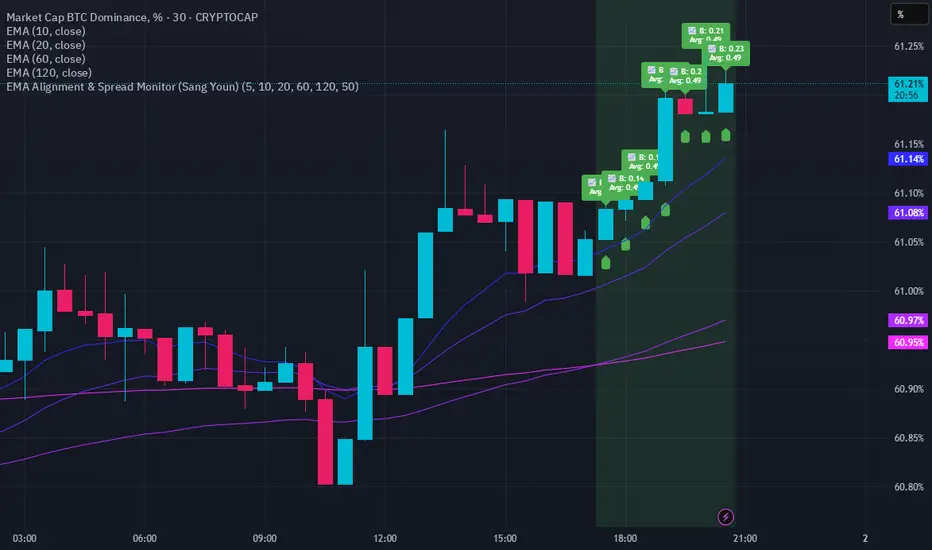
The EMA Alignment & Spread Monitor is a dynamic trading script designed to monitor EMA (Exponential Moving Average) alignments, track spread deviations, and provide real-time alerts when significant conditions are met. This script allows traders to customize their EMA periods, analyze market trends based on EMA positioning, and receive visual and audio alerts when key spread conditions occur.
🔹 Key Features
✅ Customizable EMA Periods – Users can input their own EMA lengths to adapt the script to various market conditions. (Default: 5, 10, 20, 60, 120)
✅ EMA Alignment Detection – Identifies bullish alignment (all EMAs in ascending order) and bearish alignment (all EMAs in descending order).
✅ Spread Calculation & Monitoring – Computes the spread difference between each EMA and tracks the average spread over a user-defined period.
✅ Deviation Alerts – Notifies traders when:
Bullish Trend: The spread exceeds its average, indicating a potential strong uptrend.
Bearish Trend: The spread falls below its average, signaling a possible downtrend.
✅ Chart Annotations – Displays 📈 (green triangle) when bullish spread exceeds average and 📉 (red triangle) when bearish spread drops below average for easy visualization.
✅ Real-time Alerts – Sends alerts when spread conditions are met, helping traders react to market shifts efficiently.
✅ Spread Histogram – Visual representation of bullish and bearish spread levels for trend analysis.
🔹 How It Works
1️⃣ Set your EMA periods in the script settings (default: 5, 10, 20, 60, 120).
2️⃣ Define the spread average calculation length (default: 50 candles).
3️⃣ The script tracks EMA alignment to determine bullish or bearish trends.
4️⃣ If the spread deviates significantly from its average, the script:
Places a 📈 green triangle above candles in a bullish trend when spread > average.
Places a 📉 red triangle below candles in a bearish trend when spread < average.
Triggers an alert for timely decision-making.
5️⃣ Use the histogram & real-time alerts to stay ahead of market movements.
สคริปต์โอเพนซอร์ซ
ด้วยเจตนารมณ์หลักของ TradingView ผู้สร้างสคริปต์นี้ได้ทำให้เป็นโอเพนซอร์ส เพื่อให้เทรดเดอร์สามารถตรวจสอบและยืนยันฟังก์ชันการทำงานของมันได้ ขอชื่นชมผู้เขียน! แม้ว่าคุณจะใช้งานได้ฟรี แต่โปรดจำไว้ว่าการเผยแพร่โค้ดซ้ำจะต้องเป็นไปตาม กฎระเบียบการใช้งาน ของเรา
คำจำกัดสิทธิ์ความรับผิดชอบ
ข้อมูลและบทความไม่ได้มีวัตถุประสงค์เพื่อก่อให้เกิดกิจกรรมทางการเงิน, การลงทุน, การซื้อขาย, ข้อเสนอแนะ หรือคำแนะนำประเภทอื่น ๆ ที่ให้หรือรับรองโดย TradingView อ่านเพิ่มเติมใน ข้อกำหนดการใช้งาน