OPEN-SOURCE SCRIPT
RSI - colour fill
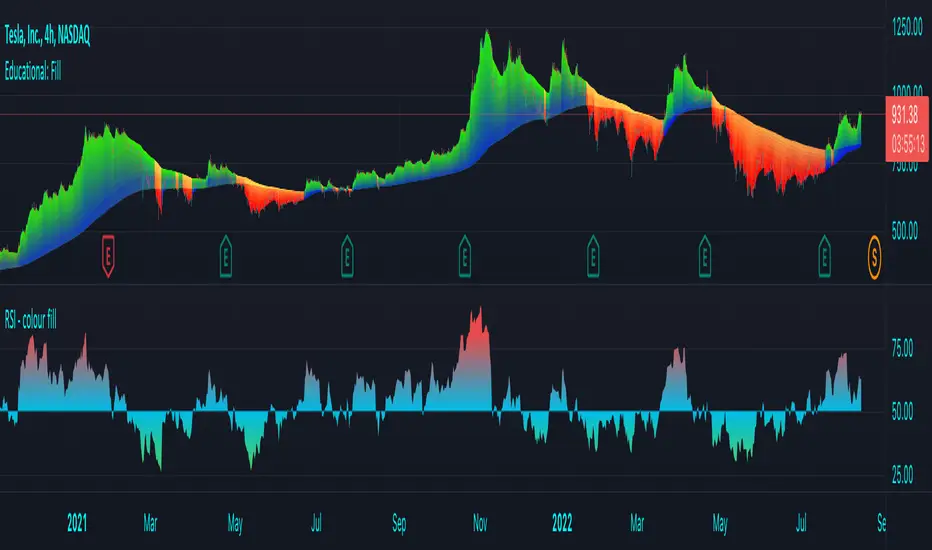
This script showcases the new (overload) feature regarding the fill() function! 🥳
2 plots could be filled before, but with just 1 colour per bar, now the colour can be a gradient type.
In this example we have 2 plots
- rsiPlot , which plots the rsi value
- centerPlot, which plots the value 50 ('centre line')
Explanation of colour fill in the zone 50-80
Default when rsi > 50
- a bottom value is set at 50 (associated with colour aqua)
- and a top value is set at 80 (associated with colour red)
This zone (bottom -> top value) is filled with a gradient colour (50 - aqua -> 80 - red)
When rsi is towards 80, you see a red coloured zone at the rsi value,
while when rsi is around 50, you'll only see the colour aqua
The same principle is applied in the zone 20-50 when rsi < 50
Cheers!
สคริปต์โอเพนซอร์ซ
ด้วยเจตนารมณ์หลักของ TradingView ผู้สร้างสคริปต์นี้ได้ทำให้เป็นโอเพนซอร์ส เพื่อให้เทรดเดอร์สามารถตรวจสอบและยืนยันฟังก์ชันการทำงานของมันได้ ขอชื่นชมผู้เขียน! แม้ว่าคุณจะใช้งานได้ฟรี แต่โปรดจำไว้ว่าการเผยแพร่โค้ดซ้ำจะต้องเป็นไปตาม กฎระเบียบการใช้งาน ของเรา
Who are PineCoders?
tradingview.com/chart/SSP/yW5eOqtm-Who-are-PineCoders/
TG Pine Script® Q&A: t.me/PineCodersQA
- We cannot control our emotions,
but we can control our keyboard -
tradingview.com/chart/SSP/yW5eOqtm-Who-are-PineCoders/
TG Pine Script® Q&A: t.me/PineCodersQA
- We cannot control our emotions,
but we can control our keyboard -
คำจำกัดสิทธิ์ความรับผิดชอบ
ข้อมูลและบทความไม่ได้มีวัตถุประสงค์เพื่อก่อให้เกิดกิจกรรมทางการเงิน, การลงทุน, การซื้อขาย, ข้อเสนอแนะ หรือคำแนะนำประเภทอื่น ๆ ที่ให้หรือรับรองโดย TradingView อ่านเพิ่มเติมใน ข้อกำหนดการใช้งาน