OPEN-SOURCE SCRIPT
Double BBW Overlay
Double BBW Overlay Indicator
Overview
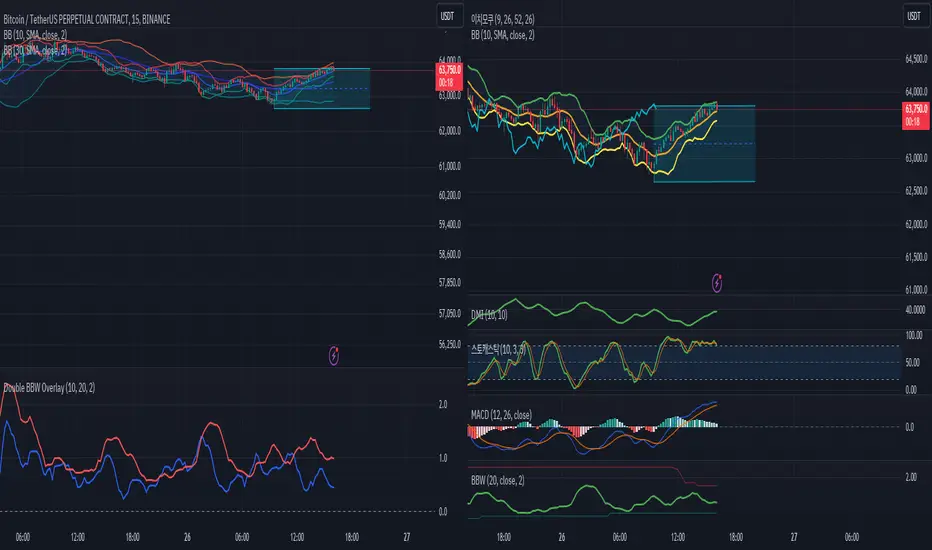
The Double BBW (Bollinger Band Width) Overlay indicator is a custom script for TradingView that combines two BBW indicators with adjustable settings. It allows traders to compare the volatility of two different periods of Bollinger Bands on the same chart. By default, the first BBW is calculated with a 10-period center line, and the second BBW with a 20-period center line, but these values can be customized.
How It Works
Bollinger Bands consist of an upper band, a lower band, and a middle band (typically a moving average). The Bollinger Band Width (BBW) measures the distance between the upper and lower bands relative to the center line. The width of these bands indicates market volatility:
Narrow Bands: Low volatility, usually preceding a breakout.
Wide Bands: High volatility, often following a strong price movement.
This indicator plots two BBW values on a non-overlay chart, making it easy to visualize and compare different market conditions over different periods.
Indicator Components
BBW 1 (default period: 10)
Calculates the BBW using a center line based on a 10-period moving average.
The width is plotted in blue by default.
BBW 2 (default period: 20)
Calculates the BBW using a center line based on a 20-period moving average.
The width is plotted in red by default.
Zero Line
A gray horizontal line at the value of 0 for reference, helping to understand the scale of BBW values.
Input Parameters
Center Line Period for BBW 1 (length1)
Default: 10
This controls the length of the moving average for the first BBW calculation. It defines how many periods are used to calculate the middle Bollinger Band for BBW 1.
Center Line Period for BBW 2 (length2)
Default: 20
This controls the length of the moving average for the second BBW calculation. It defines how many periods are used to calculate the middle Bollinger Band for BBW 2.
Standard Deviation Multiplier (mult)
Default: 2.0
This controls how far the upper and lower Bollinger Bands are from the center line. The multiplier affects how sensitive the Bollinger Bands are to price changes, with higher values producing wider bands.
How to Use
Adding the Indicator: Once the script is added to your TradingView account, simply apply the indicator to any chart. It will be displayed as a separate pane below the price chart, showing two BBW lines corresponding to the two different periods.
Customizing Periods: Use the settings panel to adjust the center line periods for BBW 1 and BBW 2 to match your desired trading strategy. For instance, you can analyze short-term versus long-term volatility by adjusting the periods.
Volatility Analysis:
When both BBW lines are narrow, it indicates low volatility across both short-term and long-term periods, which could suggest that a breakout is imminent.
If both BBW lines widen simultaneously, it shows that volatility is increasing in both timeframes, possibly indicating a strong trend.
Use Cases
Breakout Strategy: When the BBW lines contract significantly, it may signal that a low-volatility period is about to end, which is often followed by a price breakout in either direction.
Trend Strength: Comparing short-term and long-term BBW values can help determine if recent price movements are supported by broader market volatility or if they are isolated to the short term.
Chart Display
BBW 1: Blue line, representing the Bollinger Band Width calculated with a center line period of 10 (or your customized value).
BBW 2: Red line, representing the Bollinger Band Width calculated with a center line period of 20 (or your customized value).
Zero Line: A gray line at 0 is provided for reference, although BBW values are always positive.
Advantages of Using Double BBW
Comprehensive View of Volatility: By overlaying two BBW indicators with different timeframes, you can gain insights into both short-term and long-term market volatility trends.
Customizable: You can easily adjust the moving average periods and the standard deviation multiplier to match your preferred trading strategy or the characteristics of the asset you are trading.
Easy Visualization: The separate plots of BBW values make it easier to see shifts in market volatility, allowing you to spot potential trading opportunities.
Overview
The Double BBW (Bollinger Band Width) Overlay indicator is a custom script for TradingView that combines two BBW indicators with adjustable settings. It allows traders to compare the volatility of two different periods of Bollinger Bands on the same chart. By default, the first BBW is calculated with a 10-period center line, and the second BBW with a 20-period center line, but these values can be customized.
How It Works
Bollinger Bands consist of an upper band, a lower band, and a middle band (typically a moving average). The Bollinger Band Width (BBW) measures the distance between the upper and lower bands relative to the center line. The width of these bands indicates market volatility:
Narrow Bands: Low volatility, usually preceding a breakout.
Wide Bands: High volatility, often following a strong price movement.
This indicator plots two BBW values on a non-overlay chart, making it easy to visualize and compare different market conditions over different periods.
Indicator Components
BBW 1 (default period: 10)
Calculates the BBW using a center line based on a 10-period moving average.
The width is plotted in blue by default.
BBW 2 (default period: 20)
Calculates the BBW using a center line based on a 20-period moving average.
The width is plotted in red by default.
Zero Line
A gray horizontal line at the value of 0 for reference, helping to understand the scale of BBW values.
Input Parameters
Center Line Period for BBW 1 (length1)
Default: 10
This controls the length of the moving average for the first BBW calculation. It defines how many periods are used to calculate the middle Bollinger Band for BBW 1.
Center Line Period for BBW 2 (length2)
Default: 20
This controls the length of the moving average for the second BBW calculation. It defines how many periods are used to calculate the middle Bollinger Band for BBW 2.
Standard Deviation Multiplier (mult)
Default: 2.0
This controls how far the upper and lower Bollinger Bands are from the center line. The multiplier affects how sensitive the Bollinger Bands are to price changes, with higher values producing wider bands.
How to Use
Adding the Indicator: Once the script is added to your TradingView account, simply apply the indicator to any chart. It will be displayed as a separate pane below the price chart, showing two BBW lines corresponding to the two different periods.
Customizing Periods: Use the settings panel to adjust the center line periods for BBW 1 and BBW 2 to match your desired trading strategy. For instance, you can analyze short-term versus long-term volatility by adjusting the periods.
Volatility Analysis:
When both BBW lines are narrow, it indicates low volatility across both short-term and long-term periods, which could suggest that a breakout is imminent.
If both BBW lines widen simultaneously, it shows that volatility is increasing in both timeframes, possibly indicating a strong trend.
Use Cases
Breakout Strategy: When the BBW lines contract significantly, it may signal that a low-volatility period is about to end, which is often followed by a price breakout in either direction.
Trend Strength: Comparing short-term and long-term BBW values can help determine if recent price movements are supported by broader market volatility or if they are isolated to the short term.
Chart Display
BBW 1: Blue line, representing the Bollinger Band Width calculated with a center line period of 10 (or your customized value).
BBW 2: Red line, representing the Bollinger Band Width calculated with a center line period of 20 (or your customized value).
Zero Line: A gray line at 0 is provided for reference, although BBW values are always positive.
Advantages of Using Double BBW
Comprehensive View of Volatility: By overlaying two BBW indicators with different timeframes, you can gain insights into both short-term and long-term market volatility trends.
Customizable: You can easily adjust the moving average periods and the standard deviation multiplier to match your preferred trading strategy or the characteristics of the asset you are trading.
Easy Visualization: The separate plots of BBW values make it easier to see shifts in market volatility, allowing you to spot potential trading opportunities.
สคริปต์โอเพนซอร์ซ
ด้วยเจตนารมณ์หลักของ TradingView ผู้สร้างสคริปต์นี้ได้ทำให้เป็นโอเพนซอร์ส เพื่อให้เทรดเดอร์สามารถตรวจสอบและยืนยันฟังก์ชันการทำงานของมันได้ ขอชื่นชมผู้เขียน! แม้ว่าคุณจะใช้งานได้ฟรี แต่โปรดจำไว้ว่าการเผยแพร่โค้ดซ้ำจะต้องเป็นไปตาม กฎระเบียบการใช้งาน ของเรา
คำจำกัดสิทธิ์ความรับผิดชอบ
ข้อมูลและบทความไม่ได้มีวัตถุประสงค์เพื่อก่อให้เกิดกิจกรรมทางการเงิน, การลงทุน, การซื้อขาย, ข้อเสนอแนะ หรือคำแนะนำประเภทอื่น ๆ ที่ให้หรือรับรองโดย TradingView อ่านเพิ่มเติมใน ข้อกำหนดการใช้งาน