OPEN-SOURCE SCRIPT
Ultra Strength Index
The Ultra Strength Index is a momentum-based indicator designed to enhance price action analysis. It identifies overbought/oversold levels and generates buy/sell signals based on momentum shifts. With customizable smoothing and dynamic updates, it suits both trend-following and reversal strategies.
Introduction
The Ultra Strength Index is a powerful tool designed to help traders analyze price momentum, identify trends, and recognize potential turning points in the market. By combining advanced smoothing techniques and customizable settings, it provides a clear visual representation of overbought/oversold conditions and momentum signals, making it suitable for all trading styles.
Detailed Description
The Ultra Strength Index works by analyzing price momentum and visualizing it through smoothed calculations.
Here's how it works:
.........
.........
Customizable colors, smoothing periods, and signal settings allow traders to tailor the indicator to their strategy.
Special Thanks
I use the TWMA-Function created from RedKTrader to smooth the values.
Special thanks to him/her for creating and sharing this function!
Introduction
The Ultra Strength Index is a powerful tool designed to help traders analyze price momentum, identify trends, and recognize potential turning points in the market. By combining advanced smoothing techniques and customizable settings, it provides a clear visual representation of overbought/oversold conditions and momentum signals, making it suitable for all trading styles.
Detailed Description
The Ultra Strength Index works by analyzing price momentum and visualizing it through smoothed calculations.
Here's how it works:
.........
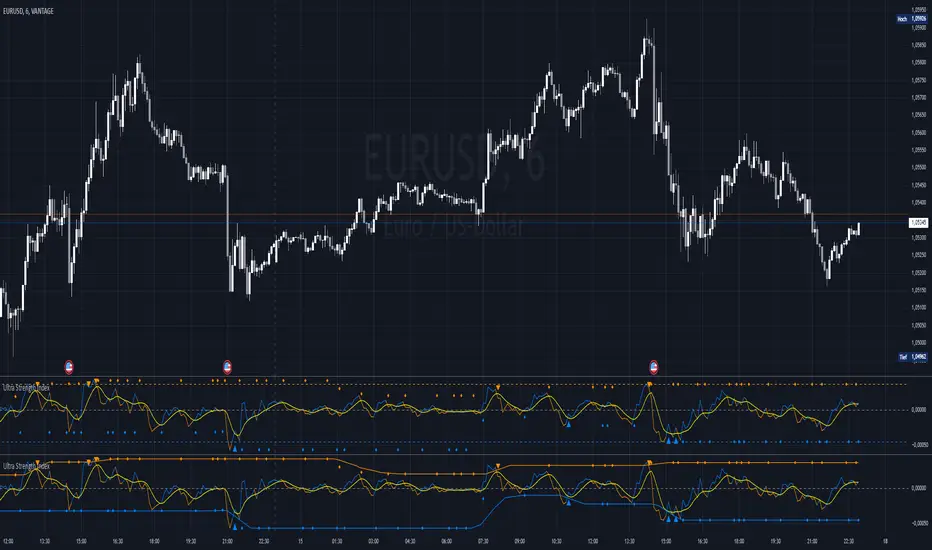
- Impulse Line
Tracks changes in price momentum using a simple moving average (SMA) of the price change. This line reflects the strength and direction of momentum.
..... - Signal Line
A more stable, smoother version of the impulse line, calculated using a Triple Weigthend Moving Average (TWMA) wich created RedKTrader. It acts as a baseline to compare momentum shifts.
..... - Overbought/Oversold Zones
The indicator detects extreme price conditions using historical momentum levels. These levels are dynamically smoothed over a customizable lookback period to minimize noise and ensure reliability.
..... - Repainting Feature
The "Enable Repaint" option offers real-time updating of overbought/oversold levels for more reactive signals, while disabling it provides the actual level for retrospective analysis.
..... - Buy and Sell Signals
The impulse line crosses into or out of overbought/oversold zones. (Triangle)
The impulse line crosses above or below the signal line, indicating potential momentum shifts. (Diamond)
.........
Customizable colors, smoothing periods, and signal settings allow traders to tailor the indicator to their strategy.
Special Thanks
I use the TWMA-Function created from RedKTrader to smooth the values.
Special thanks to him/her for creating and sharing this function!
สคริปต์โอเพนซอร์ซ
ด้วยเจตนารมณ์หลักของ TradingView ผู้สร้างสคริปต์นี้ได้ทำให้เป็นโอเพนซอร์ส เพื่อให้เทรดเดอร์สามารถตรวจสอบและยืนยันฟังก์ชันการทำงานของมันได้ ขอชื่นชมผู้เขียน! แม้ว่าคุณจะใช้งานได้ฟรี แต่โปรดจำไว้ว่าการเผยแพร่โค้ดซ้ำจะต้องเป็นไปตาม กฎระเบียบการใช้งาน ของเรา
คำจำกัดสิทธิ์ความรับผิดชอบ
ข้อมูลและบทความไม่ได้มีวัตถุประสงค์เพื่อก่อให้เกิดกิจกรรมทางการเงิน, การลงทุน, การซื้อขาย, ข้อเสนอแนะ หรือคำแนะนำประเภทอื่น ๆ ที่ให้หรือรับรองโดย TradingView อ่านเพิ่มเติมใน ข้อกำหนดการใช้งาน