PROTECTED SOURCE SCRIPT
Tweak Strat FTFC
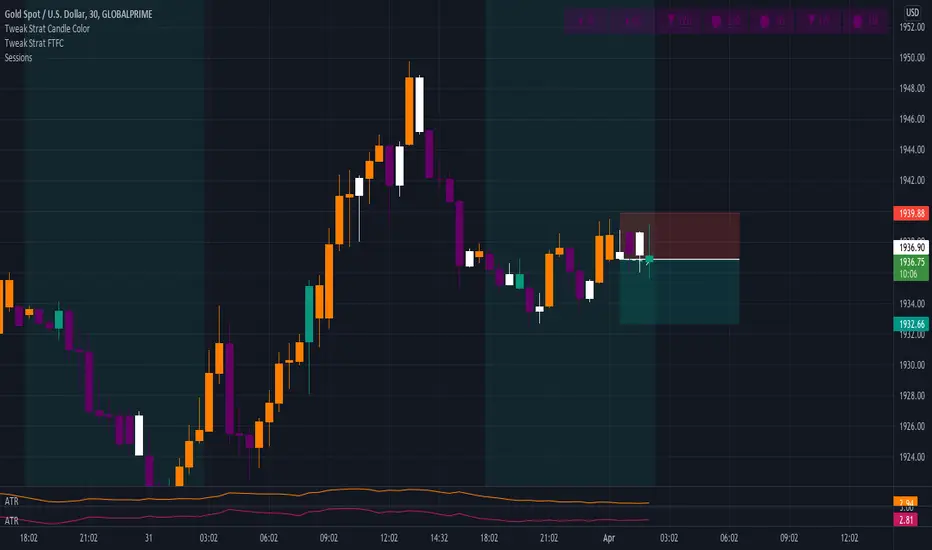
This script allows traders to view timeframe continuity on 7 timeframes at the top of the chart.
The trader selects 7 different timeframes, and the script will reflect whether the current candle for each timeframe is bullish or bearish (current price > the open OR current price < the open).
If a timeframe is currently bearish, the box will be purple.
If a timeframe is currently bullish, the box will be orange.
A circle in the middle of the box indicates that that timeframe is currently an inside bar (1).
An upward arrow indicates that that timeframe is currently a directional up bar (2u).
A downward arrow indicates that that timeframe is currently a directional down bar (2d).
A rectangle indicates that that timeframe is currently an outside bar (3).
NOTE: The color of the boxes is fixed. Traders MUST select a timeframe for EACH OF THE 7 FIELDS.
สคริปต์ที่ได้รับการป้องกัน
สคริปต์นี้ถูกเผยแพร่เป็นแบบ closed-source อย่างไรก็ตาม คุณสามารถใช้ได้อย่างอิสระและไม่มีข้อจำกัดใดๆ – เรียนรู้เพิ่มเติมได้ที่นี่
คำจำกัดสิทธิ์ความรับผิดชอบ
ข้อมูลและบทความไม่ได้มีวัตถุประสงค์เพื่อก่อให้เกิดกิจกรรมทางการเงิน, การลงทุน, การซื้อขาย, ข้อเสนอแนะ หรือคำแนะนำประเภทอื่น ๆ ที่ให้หรือรับรองโดย TradingView อ่านเพิ่มเติมใน ข้อกำหนดการใช้งาน