OPEN-SOURCE SCRIPT
ES S/R Levels
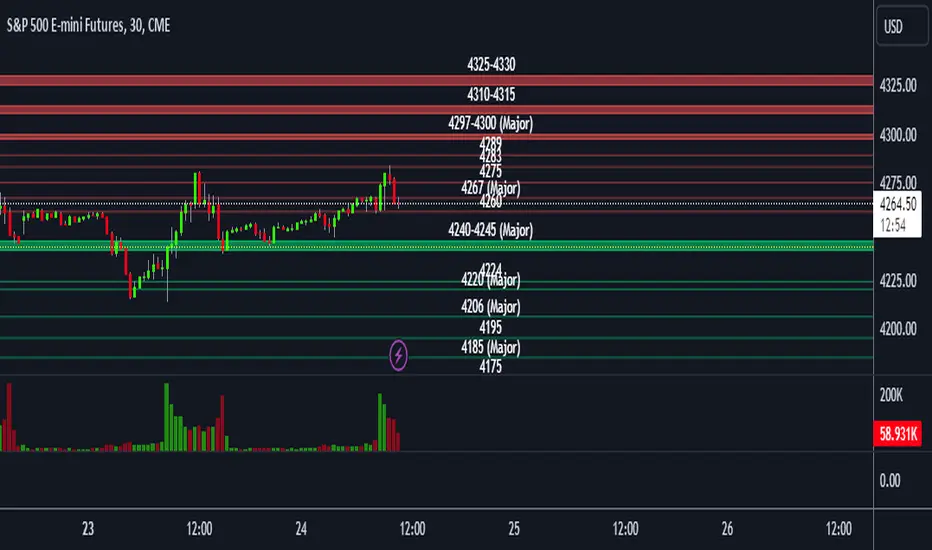
This script plots support and resistance levels for /ES on your chart.
This script only works on the /ES symbol in Tradingview due to the string manipulation of the levels.
You can input support and resistance levels in the inputs.
The example format of S/R levels should be in the following form (comma-separated)
If the level is a single point, it will draw a line. If the level is a range, it will draw a box.
4260, 4267, 4275, 4283, 4289, 4297-4300, 4310-15, 4325-30
You can also add the keyword (major) in your S/R levels input which will add a (Major) label to the drawing
4260, 4267 (major), 4275, 4283, 4289, 4297-4300 (major), 4310-15, 4325-30
สคริปต์โอเพนซอร์ซ
ด้วยเจตนารมณ์หลักของ TradingView ผู้สร้างสคริปต์นี้ได้ทำให้เป็นโอเพนซอร์ส เพื่อให้เทรดเดอร์สามารถตรวจสอบและยืนยันฟังก์ชันการทำงานของมันได้ ขอชื่นชมผู้เขียน! แม้ว่าคุณจะใช้งานได้ฟรี แต่โปรดจำไว้ว่าการเผยแพร่โค้ดซ้ำจะต้องเป็นไปตาม กฎระเบียบการใช้งาน ของเรา
คำจำกัดสิทธิ์ความรับผิดชอบ
ข้อมูลและบทความไม่ได้มีวัตถุประสงค์เพื่อก่อให้เกิดกิจกรรมทางการเงิน, การลงทุน, การซื้อขาย, ข้อเสนอแนะ หรือคำแนะนำประเภทอื่น ๆ ที่ให้หรือรับรองโดย TradingView อ่านเพิ่มเติมใน ข้อกำหนดการใช้งาน