OPEN-SOURCE SCRIPT
William's ProGo indicator
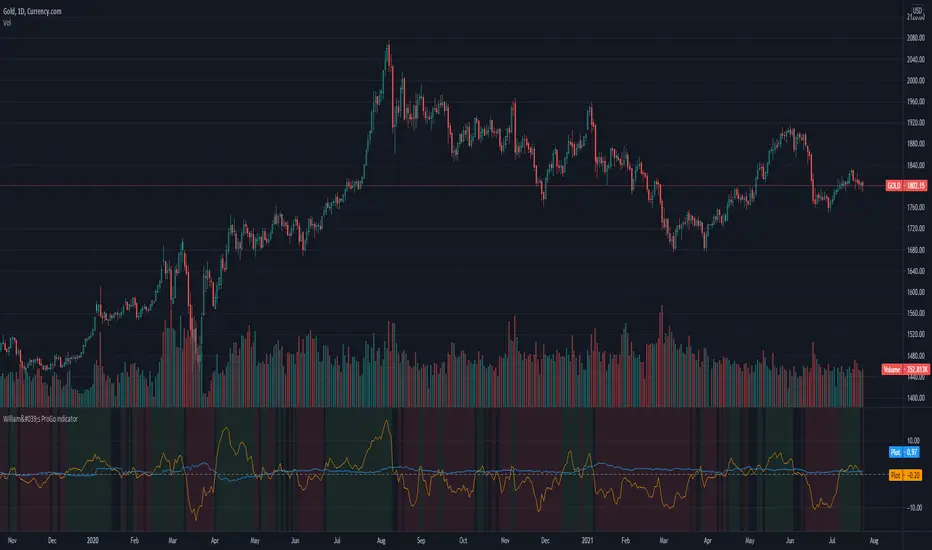
ProGo, created by Larry William, (earlier than 2002), is a 2 line graph using daily data.
1. Professional Line (color orange) is a professional Accumulation/Distribution line is constructed by using the change from today's open to today's close.
2. The Public Line (color blue) is done by creating a public accumulation/distribution line that shows the change from yesterdays close to today's open.
The graph is an index of the previous close to open +/- values (public) and then taking a 14 day average which is plotted against a 14 day average of the +/- values of the open to close(pro).
Background color:
Green colored area is where "pro" line crossover "amatuers" line, and the "pro" line is also positive.
Created this for literature review.
สคริปต์โอเพนซอร์ซ
ด้วยเจตนารมณ์หลักของ TradingView ผู้สร้างสคริปต์นี้ได้ทำให้เป็นโอเพนซอร์ส เพื่อให้เทรดเดอร์สามารถตรวจสอบและยืนยันฟังก์ชันการทำงานของมันได้ ขอชื่นชมผู้เขียน! แม้ว่าคุณจะใช้งานได้ฟรี แต่โปรดจำไว้ว่าการเผยแพร่โค้ดซ้ำจะต้องเป็นไปตาม กฎระเบียบการใช้งาน ของเรา
คำจำกัดสิทธิ์ความรับผิดชอบ
ข้อมูลและบทความไม่ได้มีวัตถุประสงค์เพื่อก่อให้เกิดกิจกรรมทางการเงิน, การลงทุน, การซื้อขาย, ข้อเสนอแนะ หรือคำแนะนำประเภทอื่น ๆ ที่ให้หรือรับรองโดย TradingView อ่านเพิ่มเติมใน ข้อกำหนดการใช้งาน