PROTECTED SOURCE SCRIPT
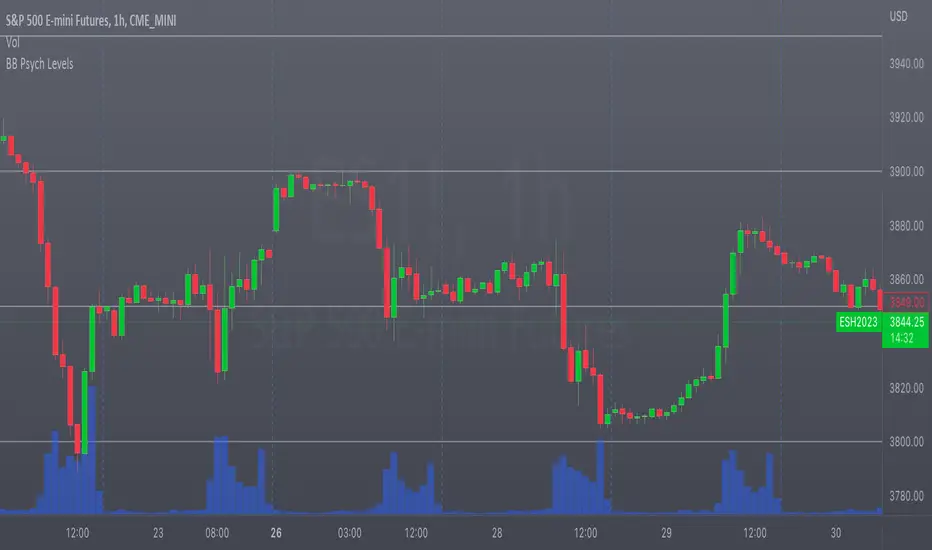
BullBarbie's Automagical Psych Levels v1.1

This indicator does one thing (and it does it extremely well)...
Automatically plot levels at a set a set interval in a set range to create psychological levels on your chart.
There are 3 Options:
1) The price range in which you'd like to plot these level lines
2) The interval (price range) between the levels
3) The color/style you'd like the line to by
No nonsense, just KISS: Keep It Simple, Silly.
I created this script to easily add psychological (psych) levels to my most watched charts, especially the Indexes such as SPX, SPY, QQQ... I hope you enjoy it.
สคริปต์ที่ได้รับการป้องกัน
สคริปต์นี้ถูกเผยแพร่เป็นแบบ closed-source อย่างไรก็ตาม คุณสามารถใช้ได้อย่างอิสระและไม่มีข้อจำกัดใดๆ – เรียนรู้เพิ่มเติมได้ที่นี่
คำจำกัดสิทธิ์ความรับผิดชอบ
ข้อมูลและบทความไม่ได้มีวัตถุประสงค์เพื่อก่อให้เกิดกิจกรรมทางการเงิน, การลงทุน, การซื้อขาย, ข้อเสนอแนะ หรือคำแนะนำประเภทอื่น ๆ ที่ให้หรือรับรองโดย TradingView อ่านเพิ่มเติมใน ข้อกำหนดการใช้งาน