OPEN-SOURCE SCRIPT
ที่อัปเดต: Liquidity Market Seeking SwiftEdge
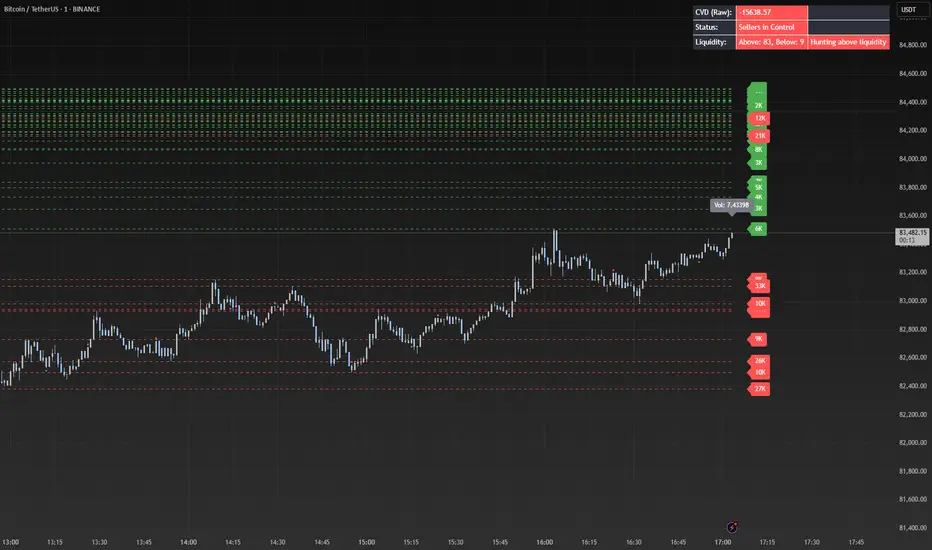
This indicator is designed to identify potential liquidity levels on the chart by detecting swing highs and lows, which are often areas where stop-loss orders or significant orders accumulate. It visualizes these levels with horizontal lines and labels on the right side of the chart, color-coded based on volume to help traders understand where the market might seek liquidity.
How It Works
Swing Highs and Lows: The indicator uses the ta.pivothigh and ta.pivotlow functions to identify significant swing points over a user-defined lookback period (Swing Length). These points are considered potential liquidity levels where stop-loss orders might be placed.
Volume Analysis: The indicator compares the volume at each swing point to the average volume over a specified period (Volume Average Length). Levels with above-average volume are colored red, indicating higher liquidity, while levels with below-average volume are colored green.
Liquidity Visualization: Horizontal dashed lines are drawn at each identified level, extending across the chart. Labels on the right side display the estimated liquidity amount (simulated based on volume and a multiplier, Volume Multiplier for Liquidity).
Sell Signal: A "SELL NOW" label appears when the price approaches a liquidity level after an uptrend (detected using a simple moving average crossover). This suggests a potential reversal as the market may target liquidity at that level.
Strategy Concept: Market Seeking Liquidity
The indicator is based on the concept that markets often move toward areas of high liquidity, such as clusters of stop-loss orders or significant order accumulations. These liquidity pools are typically found around swing highs and lows, where traders place their stop-losses or large orders. By identifying these levels and highlighting those with higher volume (red lines), the indicator aims to show where the market might move to "grab" this liquidity. For example, after an uptrend, the market may reverse at a swing high to take out stop-losses above that level, providing liquidity for larger players to enter or exit positions.
Settings
Swing Length: The number of bars to look back for detecting swing highs and lows. Default is 20.
Liquidity Threshold: The price threshold for merging nearby levels to avoid duplicates. Default is 0.001.
Volume Average Length: The period for calculating the average volume to compare against. Default is 20.
Volume Multiplier for Liquidity: A multiplier to scale the volume into a simulated liquidity amount (displayed as "K"). Default is 1000.
Usage Notes
Use this indicator on any timeframe, though it may be more effective on higher timeframes (e.g., 1H, 4H) where swing points are more significant.
Red lines indicate levels with higher volume, suggesting stronger liquidity pools that the market might target.
Green lines indicate levels with lower volume, which may be less significant.
The "SELL NOW" signal is a basic example of how to use liquidity levels for trading decisions. It appears when the price approaches a liquidity level after an uptrend, but it should be used in conjunction with other analysis.
Adjust the Volume Multiplier for Liquidity to scale the displayed liquidity amounts based on your instrument (e.g., forex pairs may need a higher multiplier than indices).
เอกสารเผยแพร่
New in This Version:Enhanced CVD Sensitivity: The CVD length (cvd_length) is now set to 2 by default (adjustable between 1 and 10), making the analysis more responsive to rapid volume changes—ideal for scalping on 1-minute or 5-minute timeframes.
Raw CVD Visualization: The indicator now displays the raw cumulative delta (cvd) in a table (top-right corner) and as a colored line in a separate panel, allowing you to see unscaled values (e.g., up to 4000 or higher) reflecting the total accumulated difference between buy and sell volume over time.
Manual Adjustments: Users can customize cvd_length, cvd_threshold (threshold for CVD status, default 20), and cvd_reset (none, daily, weekly, monthly) via input parameters to match their trading style.
Color Coding: The table and CVD line now change color based on the raw cvd value: green for buyer dominance (positive cvd), red for seller dominance (negative cvd), and gray for neutral (near 0), with adjustable transparency.
เอกสารเผยแพร่
chart was missingเอกสารเผยแพร่
Added a new column to the top-right table that indicates whether the market is potentially "Jager below liquidity" (hunting liquidity below the current price). This is triggered when there are more liquidity levels below the price than above, combined with a negative raw CVD value, suggesting a possible downward move to target stop-loss orders. The indicator displays "Jager below liquidity" or "No" to assist with scalping and trade timing.เอกสารเผยแพร่
Focused Liquidity Window: Added a new parameter Liquidity Window (Points per Side) (default 500 points), which limits the identification and counting of liquidity levels to a 1000-point range around the current price (500 points above and below). This ensures that only nearby liquidity zones are considered, making the indicator more responsive and relevant for 1-minute charts, especially for volatile instruments like DAX. The "Hunting above liquidity" and "Hunting below liquidity" signals now dynamically adjust based on this focused range.เอกสารเผยแพร่
updatet chart zoom fix.เอกสารเผยแพร่
"Updated the script to correctly draw liquidity zones at all pivot points within the selected timeframe. Added an option to disable the price window filter, adjusted the drawing logic to ensure zones span the entire time period, and allowed users to customize the lookback period. Volume label now only appears above the current candle."เอกสารเผยแพร่
Chart picture updateเอกสารเผยแพร่
Updatet scaling problem สคริปต์โอเพนซอร์ซ
ด้วยเจตนารมณ์หลักของ TradingView ผู้สร้างสคริปต์นี้ได้ทำให้เป็นโอเพนซอร์ส เพื่อให้เทรดเดอร์สามารถตรวจสอบและยืนยันฟังก์ชันการทำงานของมันได้ ขอชื่นชมผู้เขียน! แม้ว่าคุณจะใช้งานได้ฟรี แต่โปรดจำไว้ว่าการเผยแพร่โค้ดซ้ำจะต้องเป็นไปตาม กฎระเบียบการใช้งาน ของเรา
คำจำกัดสิทธิ์ความรับผิดชอบ
ข้อมูลและบทความไม่ได้มีวัตถุประสงค์เพื่อก่อให้เกิดกิจกรรมทางการเงิน, การลงทุน, การซื้อขาย, ข้อเสนอแนะ หรือคำแนะนำประเภทอื่น ๆ ที่ให้หรือรับรองโดย TradingView อ่านเพิ่มเติมใน ข้อกำหนดการใช้งาน
สคริปต์โอเพนซอร์ซ
ด้วยเจตนารมณ์หลักของ TradingView ผู้สร้างสคริปต์นี้ได้ทำให้เป็นโอเพนซอร์ส เพื่อให้เทรดเดอร์สามารถตรวจสอบและยืนยันฟังก์ชันการทำงานของมันได้ ขอชื่นชมผู้เขียน! แม้ว่าคุณจะใช้งานได้ฟรี แต่โปรดจำไว้ว่าการเผยแพร่โค้ดซ้ำจะต้องเป็นไปตาม กฎระเบียบการใช้งาน ของเรา
คำจำกัดสิทธิ์ความรับผิดชอบ
ข้อมูลและบทความไม่ได้มีวัตถุประสงค์เพื่อก่อให้เกิดกิจกรรมทางการเงิน, การลงทุน, การซื้อขาย, ข้อเสนอแนะ หรือคำแนะนำประเภทอื่น ๆ ที่ให้หรือรับรองโดย TradingView อ่านเพิ่มเติมใน ข้อกำหนดการใช้งาน