OPEN-SOURCE SCRIPT
London Breakout by Edwin K
Purpose:
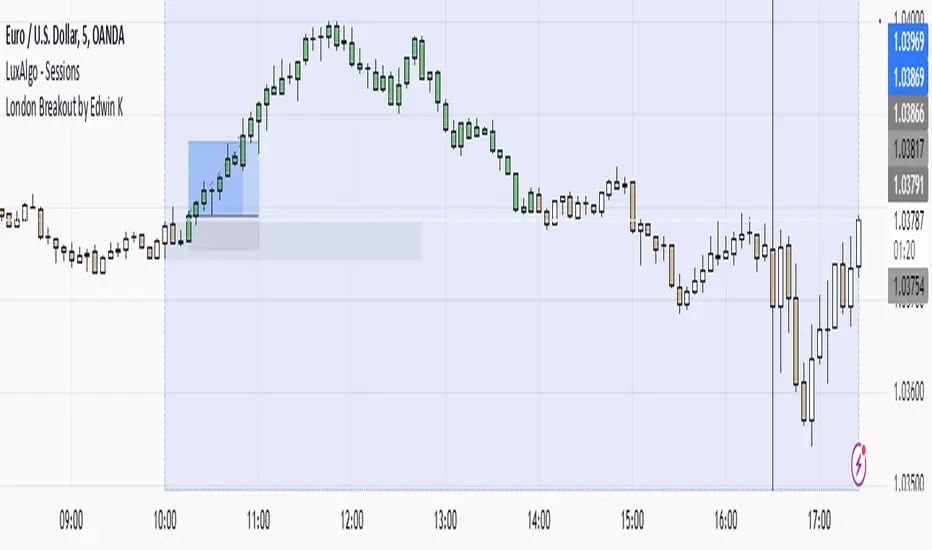
The strategy visualizes breakouts based on price action during the London session. It highlights the candles from 09:59 AM to 01:59 PM UTC+3 with different colors depending on whether the price is above or below the high/low from the 10 AM candle.
Key Parts:
Timestamps:
The code defines specific times for the 09:59 AM candle, 10:00 AM candle, and 01:59 PM UTC+3 times.
The timestamp('UTC+3', ...) function creates the timestamps for those moments.
High and Low of the 10 AM Candle:
The high and low of the 10 AM candle are captured and stored in the ten_am_high and ten_am_low variables.
Bullish and Bearish Conditions:
If the price breaks above (bullish_break) or below (bearish_break) the high or low of the 10 AM candle, respectively.
Bar Coloring:
If the conditions are met (price breaking above or below the 10 AM levels), the script colors the candles during the time frame (09:59 AM to 01:59 PM).
Green color is applied for bullish breakouts.
Red color is applied for bearish breakouts.
สคริปต์โอเพนซอร์ซ
ด้วยเจตนารมณ์หลักของ TradingView ผู้สร้างสคริปต์นี้ได้ทำให้เป็นโอเพนซอร์ส เพื่อให้เทรดเดอร์สามารถตรวจสอบและยืนยันฟังก์ชันการทำงานของมันได้ ขอชื่นชมผู้เขียน! แม้ว่าคุณจะใช้งานได้ฟรี แต่โปรดจำไว้ว่าการเผยแพร่โค้ดซ้ำจะต้องเป็นไปตาม กฎระเบียบการใช้งาน ของเรา
คำจำกัดสิทธิ์ความรับผิดชอบ
ข้อมูลและบทความไม่ได้มีวัตถุประสงค์เพื่อก่อให้เกิดกิจกรรมทางการเงิน, การลงทุน, การซื้อขาย, ข้อเสนอแนะ หรือคำแนะนำประเภทอื่น ๆ ที่ให้หรือรับรองโดย TradingView อ่านเพิ่มเติมใน ข้อกำหนดการใช้งาน