OPEN-SOURCE SCRIPT
Straddle Indicator - Padding Guide

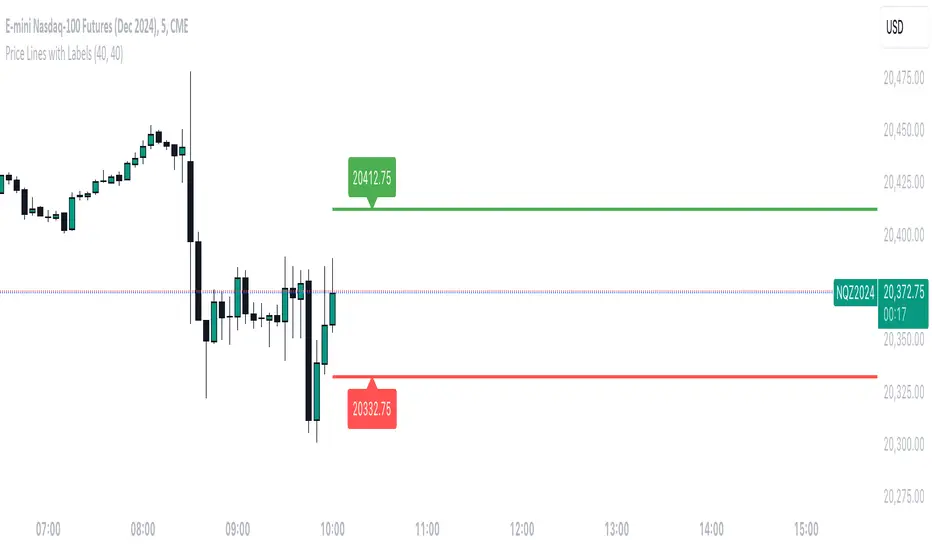
The Straddle Indicator is designed to help traders visualize potential market movements by straddling the current price. This indicator draws two horizontal lines on the chart: one positioned above and one below the current price, based on user-defined offsets.
Key Features:
Dynamic Price Levels: The levels are calculated based on the current closing price, allowing the indicator to adapt to changing market conditions in real time.
Customizable Offsets: Traders can customize the offsets for the lines above and below the current price, providing flexibility to align with their trading strategies or market analysis.
Visual Clarity: The indicator displays the price levels as horizontal lines in distinct colors (green for above and red for below) along with corresponding labels showing the exact price levels, facilitating quick reference.
Current Bar Focus: The lines and labels are updated to only reflect the current bar, minimizing chart clutter and making it easy to focus on the most relevant price action.
This indicator is particularly useful for traders employing straddle strategies, as it helps to anticipate potential price movements and plan entries or exits accordingly.
สคริปต์โอเพนซอร์ซ
ด้วยเจตนารมณ์หลักของ TradingView ผู้สร้างสคริปต์นี้ได้ทำให้เป็นโอเพนซอร์ส เพื่อให้เทรดเดอร์สามารถตรวจสอบและยืนยันฟังก์ชันการทำงานของมันได้ ขอชื่นชมผู้เขียน! แม้ว่าคุณจะใช้งานได้ฟรี แต่โปรดจำไว้ว่าการเผยแพร่โค้ดซ้ำจะต้องเป็นไปตาม กฎระเบียบการใช้งาน ของเรา
คำจำกัดสิทธิ์ความรับผิดชอบ
ข้อมูลและบทความไม่ได้มีวัตถุประสงค์เพื่อก่อให้เกิดกิจกรรมทางการเงิน, การลงทุน, การซื้อขาย, ข้อเสนอแนะ หรือคำแนะนำประเภทอื่น ๆ ที่ให้หรือรับรองโดย TradingView อ่านเพิ่มเติมใน ข้อกำหนดการใช้งาน