OPEN-SOURCE SCRIPT
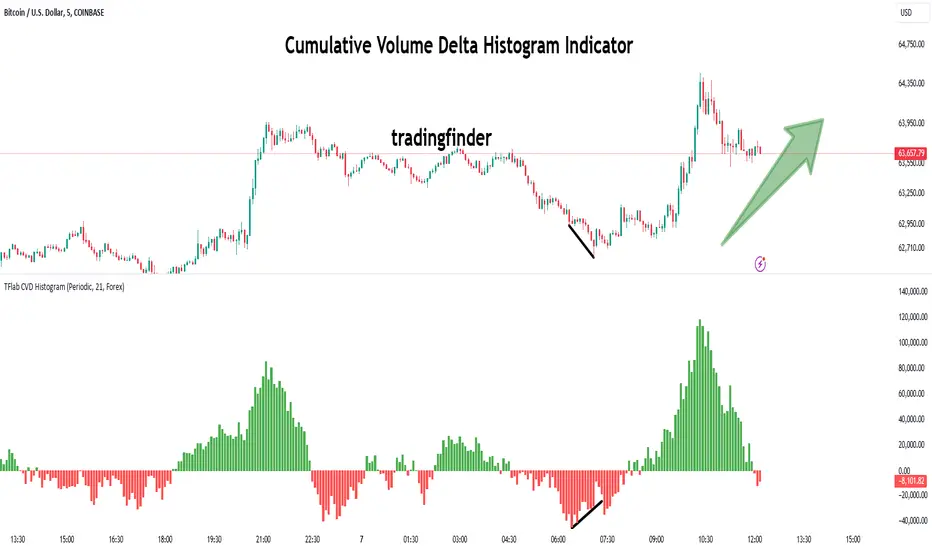
Cumulative Volume Delta Histogram [TradingFinder] CVD Histogram
🔵Introduction
To fully understand Cumulative Volume Delta (CVD), it’s important to start by explaining Volume Delta. In trading, "Delta" refers to the difference between two values or the rate of change between two data points. Volume Delta represents the difference between buying and selling pressure for each candlestick on a chart, and this difference can vary across different time frames.
A positive delta indicates that buying volume exceeds selling volume, while a negative delta shows that selling pressure is stronger. When buying and selling volumes are equal, the volume delta equals zero.
The Cumulative Volume Delta (CVD) indicator tracks the cumulative difference between buying and selling volumes over time, helping traders analyze market dynamics and identify reliable trading signals through CVD divergences.
🔵How to Use
Cumulative Volume Delta (CVD) is an essential technical analysis tool that aggregates delta values for each candlestick, creating a comprehensive indicator. This helps traders evaluate overall buying and selling pressure over market swings.
Unlike standard Volume Delta, which compares the delta on a candle-by-candle basis, CVD provides a broader view of buying and selling pressure during market trends. A downward-trending CVD suggests that selling pressure is dominant, which is typically a bearish signal.
Conversely, an upward-trending CVD indicates bullish sentiment, suggesting buyers are in control. This analysis becomes even more valuable when compared with price action and market structure, helping traders predict the direction of asset prices.
🟣How to Use CVD in Trend Analysis and Market Reversals
Understanding how to detect trend changes using Cumulative Volume Delta is crucial for traders. Typically, CVD aligns with market structure, moving in the same direction as price trends.
However, divergences between CVD and price movements or signs of volume exhaustion can be powerful indicators of potential market reversals. Recognizing these patterns helps traders make more informed decisions and improve their trading strategies.


🟣How to Spot Trend Exhaustion with CVD
CVD is particularly effective for identifying trend exhaustion in the market. For instance, if an asset's price hits a new low, but CVD doesn’t follow, this might indicate a lack of seller interest, signaling potential exhaustion and a possible reversal.
Similarly, if an asset reaches a new high but CVD fails to follow, it can suggest that buyers lack the strength to push the market higher, indicating a possible reversal to the downside.
🟣How to Use CVD Divergence in Price Trend Analysis
Another effective use of CVD is identifying divergences in price trends. For example, if CVD breaks a previous high or low while the price remains stable, this divergence may indicate that buying or selling pressure is being absorbed.
For instance, if CVD rises sharply without a corresponding increase in asset prices, it may suggest that sellers are absorbing the buying pressure, which could lead to a strong sell-off. Conversely, if prices remain stable while CVD declines, it may indicate that buyers are absorbing selling pressure, likely leading to a price increase once the selling subsides.
🟣CVD Display, Candlestick vs. Histogram – What’s the Difference?
CVD can be displayed in two different formats:
Candlestick Display: In this format, the data is shown as green and red candlesticks, each representing the difference in buying and selling pressure over a given time period. This display allows traders to visually analyze market pressure along with price changes.
Histogram Display: Here, the data is represented as vertical green and red bars, where each bar’s height corresponds to the volume delta. This format offers a clearer view of the strengths and weaknesses in market buying and selling pressure.
🟣What are the Key Settings for CVD?
Cumulative Mode: CVD offers three modes: "Total," "Periodic," and "EMA." In "Total" mode, CVD accumulates the delta from the beginning to the end of the session. In "Periodic" mode, it accumulates volume periodically, resetting at specific intervals. In "EMA" mode, the CVD is smoothed using an Exponential Moving Average (EMA) to filter out short-term fluctuations.
Period: The "Period" setting allows you to define the number of bars or intervals for "Periodic" and "EMA" modes. A shorter period captures more short-term movements, while a longer period smooths out the fluctuations and provides a broader view of market trends.
Market Ultra Data: This feature integrates data from 26 major brokers into the volume calculations, providing more reliable volume data. It’s important to specify the type of market you are analyzing (Forex, crypto, etc.) as different brokers contribute to different markets. Enabling this setting ensures the highest accuracy in volume analysis.


🔵Conclusion
Cumulative Volume Delta (CVD) is a powerful technical indicator that helps traders assess buying and selling pressure by aggregating the delta values of each candlestick. Whether displayed as candlesticks or histograms, CVD provides insights into market trends, helping traders make informed decisions.
CVD is particularly useful in identifying divergences and exhaustion in market trends. For example, if CVD does not align with price movements, it can signal a potential trend reversal. Traders use this tool to fine-tune their entry and exit points and better predict future market movements.
In summary, CVD is a versatile tool for analyzing volume data and understanding the balance of buying and selling pressure in the market, making it an invaluable asset in any trader’s toolkit
To fully understand Cumulative Volume Delta (CVD), it’s important to start by explaining Volume Delta. In trading, "Delta" refers to the difference between two values or the rate of change between two data points. Volume Delta represents the difference between buying and selling pressure for each candlestick on a chart, and this difference can vary across different time frames.
A positive delta indicates that buying volume exceeds selling volume, while a negative delta shows that selling pressure is stronger. When buying and selling volumes are equal, the volume delta equals zero.
The Cumulative Volume Delta (CVD) indicator tracks the cumulative difference between buying and selling volumes over time, helping traders analyze market dynamics and identify reliable trading signals through CVD divergences.
🔵How to Use
Cumulative Volume Delta (CVD) is an essential technical analysis tool that aggregates delta values for each candlestick, creating a comprehensive indicator. This helps traders evaluate overall buying and selling pressure over market swings.
Unlike standard Volume Delta, which compares the delta on a candle-by-candle basis, CVD provides a broader view of buying and selling pressure during market trends. A downward-trending CVD suggests that selling pressure is dominant, which is typically a bearish signal.
Conversely, an upward-trending CVD indicates bullish sentiment, suggesting buyers are in control. This analysis becomes even more valuable when compared with price action and market structure, helping traders predict the direction of asset prices.
🟣How to Use CVD in Trend Analysis and Market Reversals
Understanding how to detect trend changes using Cumulative Volume Delta is crucial for traders. Typically, CVD aligns with market structure, moving in the same direction as price trends.
However, divergences between CVD and price movements or signs of volume exhaustion can be powerful indicators of potential market reversals. Recognizing these patterns helps traders make more informed decisions and improve their trading strategies.
🟣How to Spot Trend Exhaustion with CVD
CVD is particularly effective for identifying trend exhaustion in the market. For instance, if an asset's price hits a new low, but CVD doesn’t follow, this might indicate a lack of seller interest, signaling potential exhaustion and a possible reversal.
Similarly, if an asset reaches a new high but CVD fails to follow, it can suggest that buyers lack the strength to push the market higher, indicating a possible reversal to the downside.
🟣How to Use CVD Divergence in Price Trend Analysis
Another effective use of CVD is identifying divergences in price trends. For example, if CVD breaks a previous high or low while the price remains stable, this divergence may indicate that buying or selling pressure is being absorbed.
For instance, if CVD rises sharply without a corresponding increase in asset prices, it may suggest that sellers are absorbing the buying pressure, which could lead to a strong sell-off. Conversely, if prices remain stable while CVD declines, it may indicate that buyers are absorbing selling pressure, likely leading to a price increase once the selling subsides.
🟣CVD Display, Candlestick vs. Histogram – What’s the Difference?
CVD can be displayed in two different formats:
Candlestick Display: In this format, the data is shown as green and red candlesticks, each representing the difference in buying and selling pressure over a given time period. This display allows traders to visually analyze market pressure along with price changes.
Histogram Display: Here, the data is represented as vertical green and red bars, where each bar’s height corresponds to the volume delta. This format offers a clearer view of the strengths and weaknesses in market buying and selling pressure.
🟣What are the Key Settings for CVD?
Cumulative Mode: CVD offers three modes: "Total," "Periodic," and "EMA." In "Total" mode, CVD accumulates the delta from the beginning to the end of the session. In "Periodic" mode, it accumulates volume periodically, resetting at specific intervals. In "EMA" mode, the CVD is smoothed using an Exponential Moving Average (EMA) to filter out short-term fluctuations.
Period: The "Period" setting allows you to define the number of bars or intervals for "Periodic" and "EMA" modes. A shorter period captures more short-term movements, while a longer period smooths out the fluctuations and provides a broader view of market trends.
Market Ultra Data: This feature integrates data from 26 major brokers into the volume calculations, providing more reliable volume data. It’s important to specify the type of market you are analyzing (Forex, crypto, etc.) as different brokers contribute to different markets. Enabling this setting ensures the highest accuracy in volume analysis.
🔵Conclusion
Cumulative Volume Delta (CVD) is a powerful technical indicator that helps traders assess buying and selling pressure by aggregating the delta values of each candlestick. Whether displayed as candlesticks or histograms, CVD provides insights into market trends, helping traders make informed decisions.
CVD is particularly useful in identifying divergences and exhaustion in market trends. For example, if CVD does not align with price movements, it can signal a potential trend reversal. Traders use this tool to fine-tune their entry and exit points and better predict future market movements.
In summary, CVD is a versatile tool for analyzing volume data and understanding the balance of buying and selling pressure in the market, making it an invaluable asset in any trader’s toolkit
สคริปต์โอเพนซอร์ซ
ด้วยเจตนารมณ์หลักของ TradingView ผู้สร้างสคริปต์นี้ได้ทำให้เป็นโอเพนซอร์ส เพื่อให้เทรดเดอร์สามารถตรวจสอบและยืนยันฟังก์ชันการทำงานของมันได้ ขอชื่นชมผู้เขียน! แม้ว่าคุณจะใช้งานได้ฟรี แต่โปรดจำไว้ว่าการเผยแพร่โค้ดซ้ำจะต้องเป็นไปตาม กฎระเบียบการใช้งาน ของเรา
💎Get instant (Demo/Vip) access here: tradingFinder.com/
✅Get access to our support team: t.me/TFLABS
🧠Free Forex, Crypto & Stock Trading tutorial, same as ICT, Smart Money & Price Action:
tradingfinder.com/education/forex/
✅Get access to our support team: t.me/TFLABS
🧠Free Forex, Crypto & Stock Trading tutorial, same as ICT, Smart Money & Price Action:
tradingfinder.com/education/forex/
คำจำกัดสิทธิ์ความรับผิดชอบ
ข้อมูลและบทความไม่ได้มีวัตถุประสงค์เพื่อก่อให้เกิดกิจกรรมทางการเงิน, การลงทุน, การซื้อขาย, ข้อเสนอแนะ หรือคำแนะนำประเภทอื่น ๆ ที่ให้หรือรับรองโดย TradingView อ่านเพิ่มเติมใน ข้อกำหนดการใช้งาน