OA - Volume FlowVolume Flow
Volume Flow is a powerful technical analysis tool that identifies and visualizes weekly and monthly Point of Control (POC) levels based on volume distribution. This indicator helps traders spot potential support and resistance areas by tracking where the highest trading volume occurs.
Key Features:
Weekly and Monthly POC Tracking: Visualizes Points of Control for both weekly and monthly timeframes, with customizable display options for each.
Dynamic POC Extensions: POC zones extend horizontally until price interacts with them, providing clear visual signals of potential support and resistance levels.
Price Interaction Markers: Diamond-shaped markers appear at the exact point where price touches a POC zone, highlighting these critical moments.
Color-Coded Visualization: Distinct colors for weekly (default: red) and monthly (default: blue) POC zones make identification easy and intuitive.
Alert Conditions: Built-in alerts for when price touches either weekly or monthly POC levels, allowing for automated trade notifications.
How It Works:
Volume Flow divides each week or month's price range into bins and calculates the volume distribution across these levels. The price level with the highest volume becomes the POC. This level is then extended as a horizontal zone that remains active until price either touches it (creating a diamond marker) or until a predetermined number of newer POCs have formed.
Trading Applications:
Identify potential support and resistance levels based on historical volume
Anticipate price reactions at key volume levels
Confirm breakouts and reversals with volume context
Plan entries and exits around high-volume price zones
The Volume Flow indicator provides valuable insight into market structure by highlighting where the most significant volume has occurred, helping you make more informed trading decisions based on actual market participation rather than price action alone.
อินดิเคเตอร์และกลยุทธ์

Trend Classifier [ChartPrime]Trend Classifier
This is a multi-level trend classification tool that detects bullish, bearish, and ranging conditions using an adaptive smoothing method. It highlights trend strength through color-coded candles and layered bands, making it easy to interpret market momentum visually.
⯁ KEY FEATURES
Classifies trend strength using 3 bullish and 3 bearish levels relative to an adaptive trend line.
Neutral (range) zones are marked when price stays between key bands, often signaling low volatility or consolidation.
Automatically filters band visibility based on current trend direction:
In uptrends, only levels below the price are displayed.
In downtrends, only levels above the price are shown.
Color-coded candles:
Aqua candles for bullish conditions.
Red candles for bearish conditions.
Orange candles during neutral or ranging conditions.
Includes a trend direction change marker (diamond), plotted when a shift in trend is detected.
Plots a central smoothed trend line to anchor the trend bands dynamically.
Displays a trend strength dashboard in the top-right corner with real-time bull and bear scores (0 to 3).
Labels with arrows (▲/▼) show current trend direction and strength on the chart.
⯁ HOW TO USE
Use bull and bear levels (1–3) to assess the momentum of the current trend.
When bull = 0 and bear = 0 , market is considered ranging or consolidating – consider fading or waiting for breakout confirmation.
Trend bands can be used as dynamic support/resistance during trending phases.
Monitor the trend change diamonds to spot potential early reversals.
Combine with volume or oscillator tools for confirmation of strength shifts.
⯁ CONCLUSION
Trend Classifier helps traders stay aligned with the dominant trend while visually breaking down market momentum into levels. Its clean color-coded design and strength dashboard make it ideal for both trend following and range trading strategies.

Multitimeframe Order Block Finder (Zeiierman)█ Overview
The Multitimeframe Order Block Finder (Zeiierman) is a powerful tool designed to identify potential institutional zones of interest — Order Blocks — across any timeframe, regardless of what chart you're viewing.
Order Blocks are critical supply and demand zones formed by the last opposing candle before an impulsive move. These areas often act as magnets for price and serve as smart-money footprints — ideal for anticipating reversals, retests, or breakouts.
This indicator not only detects such zones in real-time, but also visualizes their mitigation, bull/bear volume pressure, and a smoothed directional trendline based on Order Block behavior.
█ How It Works
The script fetches OHLCV data from your chosen timeframe using request.security() and processes it using strict pattern logic and volume-derived strength conditions. It detects Order Blocks only when the structure aligns with dominant pressure and visually extends valid zones forward for as long as they remain unmitigated.
⚪ Bull/Bear Volume Power Visualization
Each OB includes proportional bars representing estimated buy/sell effort:
Buy Power: % of volume attributed to buyers
Sell Power: % of volume attributed to sellers
This adds a visual, intuitive layer of intent — showing who controlled the price before the OB formed.
⚪ Order Block Trendline (Butterworth Filtered)
A smoothed trendline is derived from the average OB value over time using a two-pole Butterworth low-pass filter. This helps you understand the broader directional pressure:
Trendline up → favor bullish OBs
Trendline down → favor bearish OBs
█ How to Use
⚪ Trade From Order Blocks Like Institutions
Use this tool to find institutional footprints and reaction zones:
Enter at unmitigated OBs
⚪ Volume Power
Volume Pressure Bars inside each OB help you:
Confirm strong buyer/seller dominance
Detect possible traps or exhaustion
Understand how each zone formed
⚪ Find Trend & Pullbacks
The trendline not only helps traders detect the current trend direction, but the built-in trend coloring also highlights potential pullback areas within these trends.
█ Settings
Timeframe – Selects which timeframe to scan for Order Blocks.
Lookback Period – Defines how many bars back are used to detect bullish or bearish momentum shifts.
Sensitivity – When enabled, the indicator uses smoothed price (RMA) with rising/falling logic instead of raw candle closes. This allows more flexible detection of trend shifts and results in more Order Blocks being identified.
Minimum Percent Move – Filters out weak moves. Higher = only strong price shifts.
Mitigated on Mid – OB is removed when price touches its midpoint.
Show OB Table – Displays a panel listing all active (unmitigated) Order Blocks.
Extend Boxes – Controls how far OB boxes stretch into the future.
Show OB Trend – Toggles the trendline derived from Order Block strength.
Passband Ripple (dB) – Controls trendline reactivity. Higher = more sensitive.
Cutoff Frequency – Controls smoothness of trendline (0–0.5). Lower = smoother.
-----------------
Disclaimer
The content provided in my scripts, indicators, ideas, algorithms, and systems is for educational and informational purposes only. It does not constitute financial advice, investment recommendations, or a solicitation to buy or sell any financial instruments. I will not accept liability for any loss or damage, including without limitation any loss of profit, which may arise directly or indirectly from the use of or reliance on such information.
All investments involve risk, and the past performance of a security, industry, sector, market, financial product, trading strategy, backtest, or individual's trading does not guarantee future results or returns. Investors are fully responsible for any investment decisions they make. Such decisions should be based solely on an evaluation of their financial circumstances, investment objectives, risk tolerance, and liquidity needs.

MSS, BOS, and FVG Trend ConfirmationSwing High and Swing Low Detection:
We're identifying the swing high and swing low using a length parameter that helps us find significant peaks and troughs. This is essential for both the MSS and BOS checks.
Market Structure Shift (MSS):
We check if the recent swing high is greater than the previous swing high (for an uptrend) and if the recent swing low is higher than the previous swing low. The same logic applies for a downtrend.
Break of Structure (BOS):
The script checks if the current price breaks above the last swing high for an uptrend or below the last swing low for a downtrend.
Fair Value Gap (FVG):
A FVG is detected when there's a significant imbalance. The script looks for cases where the price has moved sharply, and there might be a gap to fill.
Candle Color:
If MSS, BOS, and FVG all align to confirm an uptrend, the candle will turn blue.
If all three indicators align to confirm a downtrend, the candle will turn grey.
Signals:
For visual confirmation, we plot shapes above or below bars indicating when the uptrend or downtrend is confirmed.

Dynamic Liquidity Depth [BigBeluga]
Dynamic Liquidity Depth
A liquidity mapping engine that reveals hidden zones of market vulnerability. This tool simulates where potential large concentrations of stop-losses may exist — above recent highs (sell-side) and below recent lows (buy-side) — by analyzing real price behavior and directional volume. The result is a dynamic two-sided volume profile that highlights where price is most likely to gravitate during liquidation events, reversals, or engineered stop hunts.
🔵 KEY FEATURES
Two-Sided Liquidity Profiles:
Plots two separate profiles on the chart — one above price for potential sell-side liquidity , and one below price for potential buy-side liquidity . Each profile reflects the volume distribution across binned zones derived from historical highs and lows.
Real Stop Zone Simulation:
Each profile is offset from the current high or low using an ATR-based buffer. This simulates where traders might cluster their stop-losses above swing highs (short stops) or below swing lows (long stops).
Directional Volume Analysis:
Buy-side volume is accumulated only from bullish candles (close > open), while sell-side volume is accumulated only from bearish candles (close < open). This directional filtering enhances accuracy by capturing genuine pressure zones.
Dynamic Volume Heatmap:
Each liquidity bin is rendered as a horizontal box with a color gradient based on volume intensity:
- Low activity bins are shaded lightly.
- High-volume zones appear more vividly in red (sell) or lime (buy).
- The maximum volume bin in each profile is emphasized with a brighter fill and a volume label.
Extended POC Zones:
The Point of Control (PoC) — the bin with the most volume — is extended backwards across the entire lookback period to mark critical resistance (sell-side) or support (buy-side) levels.
Total Volume Summary Labels:
At the center of each profile, a summary label displays Total Buy Liquidity and Total Sell Liquidity volume.
This metric helps assess directional imbalance — when buy liquidity is dominant, the market may favor upward continuation, and vice versa.
Customizable Profile Granularity:
You can fine-tune both Resolution (Bins) and Offset Distance to adjust how far profiles are displaced from price and how many levels are calculated within the ATR range.
🔵 HOW IT WORKS
The indicator calculates an ATR-based buffer above highs and below lows to define the top and bottom of the liquidity zones.
Using a user-defined lookback period, it scans historical candles and divides the buffered zones into bins.
Each bin checks if bullish (or bearish) candles pass through it based on price wicks and body.
Volume from valid candles is summed into the corresponding bin.
When volume exists in a bin, a horizontal box is drawn with a width scaled by relative volume strength.
The bin with the highest volume is highlighted and optionally extended backward as a zone of importance.
Total buy/sell liquidity is displayed with a summary label at the side of the profile.
🔵 USAGE/b]
Identify Stop Hunt Zones: High-volume clusters near swing highs/lows are likely liquidation zones targeted during fakeouts.
Fade or Follow Reactions: Price hitting a high-volume bin may reverse (fade opportunity) or break with strength (confirmation breakout).
Layer with Other Tools: Combine with market structure, order blocks, or trend filters to validate entries near liquidity.
Adjust Offset for Sensitivity: Use higher offset to simulate wider stop placement; use lower for tighter scalping zones.
🔵 CONCLUSION
Dynamic Liquidity Depth transforms raw price and volume into a spatial map of liquidity. By revealing areas where stop orders are likely hidden, it gives traders insight into price manipulation zones, potential reversal levels, and breakout traps. Whether you're hunting for traps or trading with the flow, this tool equips you to navigate liquidity with precision.

Equal High/Low (EQH/EQL) [AlgoAlpha]OVERVIEW
This script detects and visualizes Equal High (EQH) and Equal Low (EQL) zones—key liquidity areas where price has previously stalled or reversed. These levels often attract institutional interest due to the liquidity buildup around them. The indicator is built to highlight such zones using dynamic thresholding, overbought/oversold RSI filtering, and adaptive mitigation logic to manage zone relevance over time.
CONCEPTS
Equal Highs/Lows are price points where the market has repeatedly failed to break past a certain high or low, hinting at areas where stop orders and pending interest may be concentrated. These areas are often prime targets for liquidity grabs or reversals. By combining this with RSI filtering, the script avoids false signals during neutral conditions and instead focuses on zones where market pressure is more directional.
FEATURES
Detection Logic: The script identifies EQH and EQL zones by comparing the similarity between recent highs or lows with a dynamic volatility threshold. The `tolerance` input allows users to control how strict this comparison is.
RSI Filtering: If enabled, it only creates zones when RSI is significantly overbought or oversold (based on the `state_thresh` input). This helps ensure zones form only in meaningful market conditions.
Zone Display: Bullish (EQL) zones are shown in grey, while bearish (EQH) zones are in blue. Two horizontal lines mark the zone using wick and body extremes, and a filled area visualizes the zone between them.
Zone Management: Zones automatically extend with price until they’re invalidated. You can choose whether a zone is removed based on wick or body sweeps and whether it requires one or two candle confirmations. Zones also expire after a customizable number of bars.
Alerts: Four alert conditions are built in—when a new EQH/EQL is formed and when one is mitigated—making it easy to integrate into alert-based workflows.
USAGE
Equal highs/lows can be used as liquidity markers, either as entry points or as take-profit targets.
This tool is ideal for liquidity-based strategies and helps traders map out possible reversal or sweep zones that often precede aggressive moves.

[blackcat] L3 Smart Money FlowCOMPREHENSIVE ANALYSIS OF THE L3 SMART MONEY FLOW INDICATOR
🌐 OVERVIEW:
The L3 Smart Money Flow indicator represents a sophisticated multi-dimensional analytics tool combining traditional momentum measurements with advanced institutional investor tracking capabilities. It's particularly effective at identifying large-scale capital movement dynamics that often precede significant price shifts.
Core Objectives:
• Detect subtle but meaningful price action anomalies indicating major player involvement
• Provide clear entry/exit markers based on multiple validated criteria
• Offer risk-managed positioning strategies suitable for various account sizes
• Maintain operational efficiency even during high volatility regimes
THEORETICAL BACKDROP AND METHODOLOGY
🎓 Conceptual Foundation Principles:
Utilizes Time-Varying Moving Averages (TVMA) responding adaptively to changing market states
Implements Extended Smoothing Algorithm (XSA) providing enhanced filtration characteristics
Employs asymmetric weight distribution favoring recent price observations over historical ones
→ Analyzes price-weighted closing prices incorporating volume influence indirectly
← Applies Asymmetric Local Maximum (ALMA) filters generating institution-specific trends
⟸ Combines multiple temporal perspectives producing robust directional assessments
✓ Calculates normalized momentum ratios comparing current state against extended range extremes
✗ Filters out insignificant fluctuations via double-stage verification process
⤾ Generates actionable alerts upon exceeding predefined significance boundaries
CONFIGURABLE PARAMETERS IN DEPTH
⚙️ Input Customization Options Detailed Explanation:
Temporal Resolution Control:
→ TVMA Length Setting:
Minimum value constraint ensuring mathematical validity
Higher numbers increase smoothing effect reducing reaction velocity
Lower intervals enhance responsiveness potentially increasing noise exposure
Validation Threshold Definition:
↓ Bull-Bear Boundary Level:
Establishes fundamental acceptance/rejection zones
Typically set near extreme values reflecting rare occurrence probability
Can be adjusted per instrument liquidity profiles if necessary
ADVANCED ALGORITHMIC PROCEDURES BREAKDOWN
💻 Internal Operation Architecture:
Base Calculations Infrastructure:
☑ Raw Data Preparation and Normalization
☐ High/Low/Closing Aggregation Processes
☒ Range Estimation Algorithms
Intermediate Transform Engine:
📈 Momentum Ratio Computation Workflow
↔ First Pass XSA Application Details
➖ Second Stage Refinement Mechanics
Final Output Synthesis Framework:
➢ Composite Reading Compilation Logic
➣ Validation Status Determination Process
➤ Alert Trigger Decision Making Structure
INTERACTIVE VISUAL INTERFACE COMPONENTS
🎨 User Experience Interface Elements:
🔵 Plotting Series Hierarchy:
→ Primary FundFlow Signal: White trace marking core oscillator progression
↑ Secondary Confirmation Overlay: Orange/Yellow highlighting validation status
🟥 Risk/Reward Boundaries: Aqua line delineating strategic areas requiring attention
🏷️ Interactive Marker System:
✔ "BUY": Green upward-pointing labels denoting confirmed long entries
❌ "SELL": Red downward-facing badges signaling short setups
PRACTICAL APPLICATION STRATEGY GUIDE
📋 Operational Deployment Instructions:
Strategic Planning Initiatives:
• Define precise profit targets considering realistic reward/risk scenarios
→ Set maximum acceptable loss thresholds protecting available resources adequately
↓ Develop contingency plans addressing unexpected adverse developments promptly
Live Trading Engagement Protocols:
→ Maintaining vigilant monitoring of label placement activities continuously
↓ Tracking order fill success rates across implemented grids regularly
↑ Evaluating system effectiveness compared alternative methodologies periodically
Performance Optimization Techniques:
✔ Implement incremental improvements iteratively throughout lifecycle
❌ Eliminate ineffective component variations systematically
⟹ Ensure proportional growth capability matching user needs appropriately
EFFICIENCY ENHANCEMENT APPROACHES
🚀 Ongoing Development Strategy:
Resource Management Focus Areas:
→ Minimizing redundant computation cycles through intelligent caching mechanisms
↓ Leveraging parallel processing capabilities where feasible efficiently
↑ Optimizing storage access patterns improving response times substantially
Scalability Consideration Factors:
✔ Adapting to varying account sizes/market capitalizations seamlessly
❌ Preventing bottlenecks limiting concurrent operation capacity
⟹ Ensuring balanced growth capability matching evolving requirements accurately
Maintenance Routine Establishment:
✓ Regular codebase updates incorporation keeping functionality current
↓ Periodic performance audits conducting verifying continued effectiveness
↑ Documentation refinement updating explaining any material modifications made
SYSTEMATIC RISK CONTROL MECHANISMS
🛡️ Comprehensive Protection Systems:
Position Sizing Governance:
∅ Never exceed predetermined exposure limitations strictly observed
± Scale entries proportionally according to available resources carefully
× Include slippage allowances within planning stages realistically
Emergency Response Procedures:
↩ Well-defined exit strategies including trailing stops activation logic
🌀 Contingency plan formulation covering worst-case scenario contingencies
⇄ Recovery procedure documentation outlining restoration steps methodically

Machine Learning: ARIMA + SARIMADescription
The ARIMA (Autoregressive Integrated Moving Average) and SARIMA (Seasonal ARIMA) are advanced statistical models that use machine learning to forecast future price movements. It uses autoregression to find the relationship between observed data and its lagged observations. The data is differenced to make it more predictable. The MA component creates a dependency between observations and residual errors. The parameters are automatically adjusted to market conditions.
Differences
ARIMA - This excels at identifying trends in the form of directions
SARIMA - Incorporates seasonality. It's better at capturing patterns previously seen
How To Use
1. Model: Determine if you want to use ARIMA (better for direction) or SARIMA (better for overall prediction). You can click on the 'Show Historic Prediction' to see the direction of the previous candles. Green = forecast ending up, red = forecast ending down
2. Metrics: The RMSE% and MAPE are 10 day moving averages of the first 10 predictions made at candle close. They're error metrics that compare the observed data with the predicted data. It is better to use them when they're below 8%. Higher timeframes will be higher, as these models are partly mean-reverting and higher TFs tend to trend more. Better to compare RMSE% and MAPE with similar timeframes. They naturally lag as data is being collected
3. Parameter selection: The simpler, the better. Both are used for ARIMA(1,1,1) and SARIMA(1,1,1)(1,1,1)5. Increasing may cause overfitting
4. Training period: Keep at 50. Because of limitations in pine, higher values do not make for more powerful forecasts. They will only criminally lag. So best to keep between 20 and 80

[blackcat] L2 Trend Guard OscillatorOVERVIEW
📊 The L2 Trend Guard Oscillator is a comprehensive technical analysis framework designed specifically to identify market trend reversals using adaptive filtering algorithms that combine price action dynamics with statistical measures of volatility and momentum.
Key Purpose:
Generate reliable early warning signals before major trend changes occur
Provide clear directional bias indicators aligned with institutional investor behavior patterns
Offer risk-managed entry/exit opportunities suitable for various timeframes
TECHNICAL FOUNDATION EXPLAINED
🎓 Core Mechanism Breakdown:
→ Advanced smoothing technique emphasizing recent data points more heavily than older ones
↓ Reduces lag while maintaining signal integrity compared to traditional MA approaches
• Short-term Momentum Assessment:
🔶 Relative strength between closing prices vs lower bounds
• Long-term Directional Bias Analysis:
📈 Extended timeframe comparison generating structural context
• Defense Level Generation:
➜ Protective boundary calculation incorporating EMAs for stability enhancement
PARAMETER CONFIGURATION GUIDE
🔧 Adjustable Settings Explained In Detail:
Timeframe Selection:**
↔ Controls lookback period sensitivity affecting responsiveness
↕ Adjusts reaction speed vs accuracy trade-off dynamically
Weight Factor Specification:**
⚡ Influences emphasis on newer versus historical observations
🎯 Defines key decision-making thresholds clearly
ALGORITHM EXECUTION FLOW
💻 Processing Sequence Overview:
:
→ Gather raw pricing inputs across required periods
↓ Normalize values preparing them for subsequent processing stages
:
✔ Calculate relative strength positions against established ranges
❌ Filter outliers maintaining signal integrity consistently
⟶ Apply dual-pass filtering reducing false signals effectively
➡ Generate actionable trading opportunities systematically
VISUALIZATION ARCHITECTURE
🎨 Display Elements Designated Purpose:
🔵 Primary Indicator Traces:
→ Aqua Trace: Buy/Sell Signal Progression
↑ Red Line: Opposing Force Boundary
🟥 Gray Dashed: Zero Reference Point
🏷️ Label System For Critical Events:
✅ BUY: Bullish Opportunity Markers
❌ SELL: Bearish Setup Validations
STRATEGIC IMPLEMENTATION FRAMEWORK
📋 Practical Deployment Steps:
Initial Integration Protocol:
• Select appropriate timeframe matching strategy objectives
• Configure input parameters aligning with target asset behavior traits
• Conduct thorough backtesting under simulated environments initially
Active Monitoring Procedures:
→ Regular observation of labeled event placements versus actual movements
↓ Track confirmation patterns leading up to signaled opportunities carefully
↑ Evaluate overall framework reliability across different regime types regularly
Execution Guidelines Formulation:
✔ Enter positions only after achieving minimum number of confirming inputs
❌ Avoid isolated occurrences lacking adequate supporting evidence always
➞ Look for convergent factors strengthening conviction before acting decisively
PERFORMANCE OPTIMIZATION TECHNIQUES
🚀 Continuous Improvement Strategies:
Parameter Calibration Approach:
✓ Start testing default suggested configurations thoroughly
↕ Gradually adjust individual components observing outcome changes methodically
✨ Document findings building personalized version profile incrementally
Context Adaptability Methods:
🔄 Add supplementary indicators enhancing overall reliability when needed
🔧 Remove unnecessary complexity layers avoiding confusion/distracted decisions
💫 Incorporate custom rules adapting specific security behaviors effectively
Efficiency Improvement Tactics:
⚙️ Streamline redundant computational routines wherever possible efficiently
♻️ Leverage shared data streams minimizing resource utilization significantly
⏳ Optimize refresh frequencies balancing update speed vs overhead properly

The Echo System🔊 The Echo System – Trend + Momentum Trading Strategy
Overview:
The Echo System is a trend-following and momentum-based trading tool designed to identify high-probability buy and sell signals through a combination of market trend analysis, price movement strength, and candlestick validation.
Key Features:
📈 Trend Detection:
Uses a 30 EMA vs. 200 EMA crossover to confirm bullish or bearish trends.
Visual trend strength meter powered by percentile ranking of EMA distance.
🔄 Momentum Check:
Detects significant price moves over the past 6 bars, enhanced by ATR-based scaling to filter weak signals.
🕯️ Candle Confirmation:
Validates recent price action using the previous and current candle body direction.
✅ Smart Conditions Table:
A live dashboard showing all trade condition checks (Trend, Recent Price Move, Candlestick confirmations) in real-time with visual feedback.
📊 Backtesting & Stats:
Auto-calculates average win, average loss, risk-reward ratio (RRR), and win rate across historical signals.
Clean performance dashboard with color-coded metrics for easy reading.
🔔 Alerts:
Set alerts for trade signals or significant price movements to stay updated without monitoring the chart 24/7.
Visuals:
Trend markers and price movement flags plotted directly on the chart.
Dual tables:
📈 Conditions table (top-right): breaks down trade criteria status.
📊 Performance table (bottom-right): shows real-time stats on win/loss and RRR.🔊 The Echo System – Trend + Momentum Trading Strategy
Overview:
The Echo System is a trend-following and momentum-based trading tool designed to identify high-probability buy and sell signals through a combination of market trend analysis, price movement strength, and candlestick validation.
Key Features:
📈 Trend Detection:
Uses a 30 EMA vs. 200 EMA crossover to confirm bullish or bearish trends.
Visual trend strength meter powered by percentile ranking of EMA distance.
🔄 Momentum Check:
Detects significant price moves over the past 6 bars, enhanced by ATR-based scaling to filter weak signals.
🕯️ Candle Confirmation:
Validates recent price action using the previous and current candle body direction.
✅ Smart Conditions Table:
A live dashboard showing all trade condition checks (Trend, Recent Price Move, Candlestick confirmations) in real-time with visual feedback.
📊 Backtesting & Stats:
Auto-calculates average win, average loss, risk-reward ratio (RRR), and win rate across historical signals.
Clean performance dashboard with color-coded metrics for easy reading.
🔔 Alerts:
Set alerts for trade signals or significant price movements to stay updated without monitoring the chart 24/7.
Visuals:
Trend markers and price movement flags plotted directly on the chart.
Dual tables:
📈 Conditions table (top-right): breaks down trade criteria status.
📊 Performance table (bottom-right): shows real-time stats on win/loss and RRR.


MomentumBreak AI SwiftEdgeMomentumbreak AI SwiftEdge
Overview
This indicator combines two powerful concepts: Pivot Trendlines by HoanGhetti and the Squeeze Momentum Oscillator by AlgoAlpha. The goal of this mashup is to provide traders with a tool that identifies key trendline breakouts while simultaneously gauging market momentum through a dynamic gradient overlay. By integrating these two elements, the indicator offers a unique perspective on price action, helping traders spot high-probability breakout opportunities that align with momentum shifts.
How It Works
Pivot Trendlines:
The indicator uses HoanGhetti's Pivot Trendlines to identify pivot highs and lows based on user-defined settings (Pivot Length and Pivot Type).
Trendlines are drawn between these pivots, and breakouts are detected when the price crosses above (bullish) or below (bearish) the trendline.
Breakouts are visually highlighted with gradient boxes and an "AI: BREAK ⚡" label for clarity.
Squeeze Momentum Oscillator:
The Squeeze Momentum Oscillator calculates market momentum using a combination of volatility and price movement.
A dynamic midline (price_mid) is plotted, with its color indicating squeeze conditions (yellow for hypersqueeze, orange for normal squeeze, gray otherwise).
A gradient overlay is added above or below the midline to reflect momentum:
Green gradient for bullish momentum (vf > 0), placed below candles in an uptrend (close > price_mid) or above in a downtrend (close < price_mid).
Red gradient for bearish momentum (vf < 0), placed above candles in an uptrend or below in a downtrend.
The gradient's intensity increases as the price moves further from the midline, visually emphasizing momentum strength.
Breakout Confirmation:
Breakout signals are only generated when the momentum aligns with the breakout direction:
Bullish breakouts require bullish momentum (vf > 0).
Bearish breakouts require bearish momentum (vf < 0).
This alignment ensures that breakouts are more reliable and reduces false signals.
Default Settings
Pivot Length: 20 (determines the lookback period for identifying pivot points)
Pivot Type: Normal (can be set to "Fast" for more frequent pivots)
Repainting: True (trendlines may repaint as new pivots form; can be disabled)
Target Levels: False (optional horizontal levels at pivot points; can be enabled)
Extend: None (trendline extension; options: none, right, left, both)
Trendline Style: Dotted (options: dotted, dashed, solid)
Underlying Momentum Oscillator Length: 10
Swing Momentum Oscillator Length: 20
Squeeze Calculation Period: 14
Squeeze Smoothing Length: 7
Squeeze Detection Length: 14
Hyper Squeeze Detection Length: 5
Usage
This indicator is ideal for traders who want to combine trendline breakouts with momentum analysis:
Trendline Breakouts: Look for gradient boxes and "AI: BREAK ⚡" labels to identify confirmed breakouts. Bullish breakouts are marked with green boxes, and bearish breakouts with red boxes.
Momentum Confirmation: The gradient overlay (green for bullish, red for bearish) helps confirm the strength of the trend. Stronger gradients (less transparent) indicate stronger momentum.
Midline Crosses: Small triangles below (bullish) or above (bearish) candles indicate when the price crosses the dynamic midline, providing additional entry/exit signals.
Why This Combination?
The integration of Pivot Trendlines and Squeeze Momentum Oscillator creates a synergy that enhances trade decision-making:
Pivot Trendlines identify key structural levels in the market, making breakouts significant events.
The Squeeze Momentum Oscillator adds a momentum filter, ensuring that breakouts are supported by underlying market strength.
Together, they provide a more holistic view of price action, filtering out low-probability breakouts and highlighting opportunities where trendline breaks align with strong momentum.
Notes
This indicator does not use request.security() or barmerge.lookahead_on, so there is no risk of lookahead bias.
The script is designed to provide clear visual cues without making unrealistic claims about performance. It is intended as a tool for analysis, not a guaranteed trading system.

ICT Killzones & Pivots [TFO]adjusted the script to fit my needs. I mainly use it to identify the FVG and OB, as well as D/W/M HH/LL

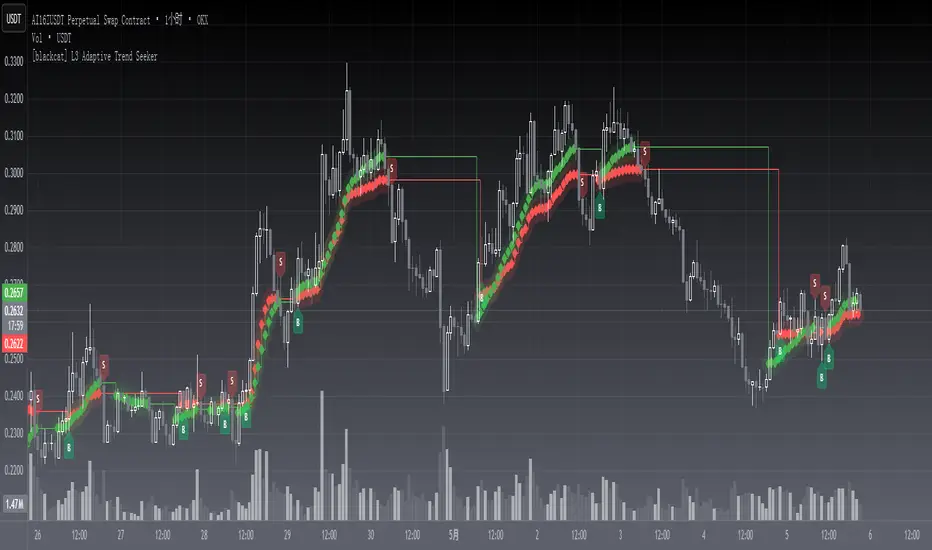
[blackcat] L3 Adaptive Trend SeekerOVERVIEW
The indicator is designed to help traders identify dynamic trends in various markets efficiently. It employs advanced calculations including Dynamic Moving Averages (DMAs) and multiple moving averages to filter out noise and provide clear buy/sell signals 📈✨. By utilizing innovative algorithms that adapt to changing market conditions, this tool enables users to make informed decisions across different timeframes and asset classes.
This versatile indicator serves both novice and experienced traders seeking reliable ways to navigate volatile environments. Its primary objective is to simplify complex trend analysis into actionable insights, making it an indispensable addition to any trader’s arsenal ⚙️🎯.
FEATURES
Customizable Dynamic Moving Average: Calculates an adaptive moving average tailored to specific needs using customizable coefficients.
Trend Identification: Utilizes multi-period moving averages (e.g., short-term, medium-term, long-term) to discern prevailing trends accurately.
Crossover Alerts: Provides visual cues via labels when significant crossover events occur between key indicators.
Adjusted MA Plots: Displays steplines colored according to the current trend direction (green for bullish, red for bearish).
Historical Price Analysis: Analyzes historical highs and lows over specified periods, ensuring robust trend identification.
Conditional Signals: Generates bullish/bearish conditions based on predefined rules enhancing decision-making efficiency.
HOW TO USE
Script Installation:
Copy the provided code and add it under Indicators > Add Custom Indicator within TradingView.
Choose an appropriate name and enable it on your desired charts.
Parameter Configuration:
Adjust the is_trend_seeker_active flag to activate/deactivate the core functionality as needed.
Modify other parameters such as smoothing factors if more customized behavior is required.
Interpreting Trends:
Observe the steppled lines representing the long-term/trend-adjusted moving averages:
Green indicates a bullish trend where prices are above the dynamically calculated threshold.
Red signifies a bearish environment with prices below respective levels.
Pay attention to labels marked "B" (for Bullish Crossover) and "S" (for Bearish Crossover).
Signal Integration:
Incorporate these generated signals within broader strategies involving support/resistance zones, volume data, and complementary indicators for stronger validity.
Use crossover alerts responsibly by validating them against recent market movements before execution.
Setting Up Alerts:
Configure alert notifications through TradingView’s interface corresponding to crucial crossover events ensuring timely responses.
Backtesting & Optimization:
Conduct extensive backtests applying diverse datasets spanning varied assets/types verifying robustness amidst differing conditions.
Refine parameters iteratively improving overall effectiveness and minimizing false positives/negatives.
EXAMPLE SCENARIOS
Swing Trading: Employ the stepline crossovers coupled with momentum oscillators like RSI to capitalize on intermediate trend reversals.
Day Trading: Leverage rapid adjustments offered by short-medium term MAs aligning entries/exits alongside intraday volatility metrics.
LIMITATIONS
The performance hinges upon accurate inputs; hence regular recalibration aligning shifting dynamics proves essential.
Excessive reliance solely on this indicator might lead to missed opportunities especially during sideways/choppy phases necessitating additional filters.
Always consider combining outputs with fundamental analyses ensuring holistic perspectives while managing risks effectively.
NOTES
Educational Resources: Delve deeper into principles behind dynamic moving averages and their significance in technical analysis bolstering comprehension.
Risk Management: Maintain stringent risk management protocols integrating stop-loss/profit targets safeguarding capital preservation.
Continuous Learning: Stay updated exploring evolving financial landscapes incorporating new methodologies enhancing script utility and relevance.
THANKS
Thanks to all contributors who have played vital roles refining and optimizing this script. Your valuable feedback drives continual enhancements paving way towards superior trading experiences!
Happy charting, and here's wishing you successful ventures ahead! 🌐💰!
stracturre.x// This source code is subject to the terms of the Mozilla Public License 2.0 at mozilla.org
// © @mr_khan_smc
////////////////////////////////////////
// Commercial Use Protection Notice:
// This code is protected for commercial use. Any unauthorized reproduction, distribution, or modification
// of this code for commercial purposes is strictly prohibited and may result in legal actions.
////////////////////////////////////////
//@version=5
indicator("stracturre.x", "KHAN SMC", true,
max_bars_back = 5000, max_labels_count = 500, max_lines_count = 500)
//#region variable declaration
var bool mnUp = na
var bool mnDn = na
float mnStrc = na
var top = high
var bot = low
var puUp = high
var puDn = low
var L = low
var H = high
var idmB = low
var idmS = high
var lastH = high
var lastL = low
var lastHH = high
var lastLL = low
//bar indexes
var int puUpbar = na
var int puDnbar = na
var int idmB_bar = na
var int idmS_bar = na
var int Hbar = bar_index
var int Lbar = bar_index
var int lastHbar = bar_index
var int lastLbar = bar_index
var int lastHHbar = bar_index
var int lastLLbar = bar_index
//structure confirmaions
lastHL = math.max(Hbar, Lbar)
var bool isBosUp = 0
var bool isBosDn = 0
var bool isCocUp = 1
var bool isCocDn = 1
//color
color transp = color.new(#59ff62, 5)
//drawing options
equalHL = input.bool(0,"Use equal H/L", "To calculate valid pullbacks and minor structure", group = "Calculation method")
showHL = input.bool(1, "Mark H/L", group = "H/L marking options")
HLcolor = input.color(color.rgb(0, 0, 0), "H/L color", group = "H/L marking options")
showMn = input.bool(0, "Mark out internal structure", group = "Internal structue")
puUpco = input.color(color.rgb(255, 82, 82) , "High pivots", inline = "mnco", group = "Internal structue")
puDnco = input.color(color.green, "Low pivots" , inline = "mnco", group = "Internal structue")
showBC = input.bool(1, "Mark BoS/ChoCH", group = "BoS/Choch")
bull = input.color(color.green, "Bull color", inline = "BSclor" ,group = "BoS/Choch")
bear = input.color(color.red , "Bear color", inline = "BSclor" ,group = "BoS/Choch")
showbarcolor = input.bool(0,"Bar color", group = "Bar color")
showSCOB = input.bool(1, "Show SCOB pattern", group = "Bar color")
scobUp = input.color(color.aqua , "Bullish SCOB", inline = "scob" , group = "Bar color")
scobDn = input.color(color.fuchsia, "Bearish SCOB", inline = "scob" , group = "Bar color")
showIDM = input.bool(1,"Mark previous IDM", group = "IDM")
showliveIDM = input.bool(1,"Mark live IDM", group = "IDM")
idmColor = input.color(color.rgb(21, 6, 230), "IDM color", group = "IDM")
var label lv_lbl = na
var line lv_line = na
showSw = input.bool(1, "Show H/L sweeping lines", group = "H/L sweeps")
markX = input.bool(1, 'Mark "X"', group = "H/L sweeps")
swColor = input.color(color.white, "Sweeping line color", group = "H/L sweeps")
//max line length
maxlen = bar_index - 500
//#endregion
//#region drawing functions
mnMark(bool UD) =>
if showMn
label.new(
x = UD ? puUpbar : puDnbar,
y = UD ? puUp : puDn,
yloc = UD ? yloc.abovebar : yloc.belowbar,
text = "",
color = UD ? puUpco : puDnco,
style = UD ? label.style_arrowdown : label.style_arrowup,
size = size.tiny
)
BoS_ChoCh(bool B_C, bool UpDn) =>
= switch
B_C == 1 and UpDn == 1 =>
B_C == 0 and UpDn == 1 =>
B_C == 0 and UpDn == 0 =>
B_C == 1 and UpDn == 0 =>
HLbarid := HLbarid < maxlen ? maxlen : HLbarid
if showBC
line.new(HLbarid, BCprc, bar_index, BCprc, color = BCcolor, style = line.style_dashed)
label.new(
int( math.avg(bar_index,HLbarid) ), BCprc
,BCtxt
,color = transp
,style = BCstyle
,textcolor = BCcolor
)
cfHL(bool ifHL) =>
= switch
ifHL =>
if high > H
else
=>
if low < L
else
ifHL_txt = if ifHL
if H == lastHH
"HH"
else
"LH"
else
if L == lastLL
"LL"
else
"HL"
cfHLStyle = ifHL ? label.style_label_down : label.style_label_up
if showHL
label.new(ifHLbarid,HLprc,ifHL_txt, color = transp, textcolor = HLcolor, style = cfHLStyle)
sweep(bool swHL, bool swHrLr) =>
swStyle = swHL ? label.style_label_down : label.style_label_up
= switch
swHL == 1 and swHrLr == 1 =>
swHL == 1 and swHrLr == 0 =>
swHL == 0 and swHrLr == 1 =>
swHL == 0 and swHrLr == 0 =>
swHLbarid := swHLbarid < maxlen ? maxlen : swHLbarid
//draw sweeping line
if showSw
line.new(swHLbarid,swprc,bar_index,swprc,color = swColor,style = line.style_dotted)
if markX
label.new(int(math.avg(bar_index,swHLbarid)),swprc, "X", color = transp, textcolor = swColor, style = swStyle, size = size.small)
IDM(bool BS) =>
IDMid = BS ? idmB_bar : idmS_bar
idmprc = BS ? idmB : idmS
idmStyle = BS ? label.style_label_up : label.style_label_down
IDMid := IDMid < maxlen ? maxlen : IDMid
//draw idm takeout line
if showIDM
line.new(IDMid,idmprc,bar_index,idmprc,color = idmColor,style = line.style_dotted)
label.new(int(math.avg(bar_index,IDMid)),idmprc, "IDM", color = transp, textcolor = idmColor, style = idmStyle,size = size.small)
//Bar color
ba_color = if showSCOB
if low == puDn and low >= low and close > high and close > low
scobUp
else if high == puUp and high <= high and close < low and close < high
scobDn
else if showbarcolor
isCocUp?bull:bear
else
na
barcolor(ba_color,-1)
//#endregion
//#region structure mapping
//update IDM
if (high > H or (high == H and equalHL)) and low > idmB
if low <= puDn
idmB := low
idmB_bar := bar_index
else
idmB := puDn
idmB_bar := puDnbar
if (low < L or (low == L and equalHL)) and high < idmS
if high >= puUp
idmS := high
idmS_bar := bar_index
else
idmS := puUp
idmS_bar := puUpbar
//Check for IDM and ChoCh
if isCocUp and lastHL != Lbar
if low < idmB
if idmB != lastL
IDM(1)
isBosUp := 0
lastH := H
lastHbar := Hbar
lastHH := H
lastHHbar := Hbar
cfHL(1)
L := low
Lbar := bar_index
else if lastH != lastHH and high > lastH
cfHL(0)
isCocDn := 0
isBosDn := 0
if close > lastH
BoS_ChoCh(0,1)
isCocUp := 1
else
sweep(1,0)
if isCocDn and lastHL != Hbar
if high > idmS
if idmS != lastH
IDM(0)
isBosDn := 0
lastL := L
lastLbar := Lbar
lastLL := L
lastLLbar := Lbar
cfHL(0)
H := high
Hbar := bar_index
else if low < lastL and lastL != lastLL
if close < lastL
BoS_ChoCh(0,0)
cfHL(1)
isCocDn := 1
isCocUp := 0
isBosUp := 0
else
sweep(0,1)
//Check for BoS
if isBosUp == 0
if high > lastHH
if close > lastHH
BoS_ChoCh(1,1)
cfHL(0)
lastL := L
lastLbar := Lbar
isCocUp := 1
isBosUp := 1
isCocDn := 0
isBosDn := 0
else
sweep(1,1)
if isBosDn == 0
if low < lastLL
if close < lastLL
BoS_ChoCh(1,0)
cfHL(1)
lastH := H
lastHbar := Hbar
isCocUp := 0
isBosUp := 0
isCocDn := 1
isBosDn := 1
else
sweep(0,0)
//#endregion
//#region internal structure
if equalHL
if high >= top
if low > bot
mnDn :=0
mnUp := 1
if low <= bot
if high < top
mnUp := 0
mnDn := 1
if mnUp and not mnUp
mnMark(1)
if mnDn and not mnDn
mnMark(0)
else
if high > top
if low > bot
mnDn :=0
mnUp := 1
if low < bot
if high < top
mnUp := 0
mnDn := 1
if mnUp and not mnUp
mnMark(1)
if mnDn and not mnDn
mnMark(0)
if equalHL
if high >= top
puUp := high
puUpbar := bar_index
if low <= bot
puDn := low
puDnbar := bar_index
top := high
bot := low
if high >= top
top := high
bot := low
else
if high > top
puUp := high
puUpbar := bar_index
if low < bot
puDn := low
puDnbar := bar_index
top := high
bot := low
if high > top
top := high
bot := low
//#endregion
//#region auto update High and Low vars
if high > H or (high == H and equalHL)
H := high
Hbar := bar_index
if high > idmS
idmS := high
idmS_bar := bar_index
if high > lastH or (high == lastH and equalHL)
lastH := high
lastHbar := bar_index
if high > lastHH or (high == lastHH and equalHL)
lastHH := high
lastHHbar := bar_index
if low < L or (low == L and equalHL)
L := low
Lbar := bar_index
if low < idmB
idmB := low
idmB_bar := bar_index
if low < lastL or (low == lastL and equalHL)
lastL := low
lastLbar := bar_index
if low < lastLL or (low == lastLL and equalHL)
lastLL := low
lastLLbar := bar_index
//#endregion
//#region live IDM
if showliveIDM and barstate.islast
= if isCocUp and lastHL == Hbar
else if isCocDn and lastHL == Lbar
lv_line := line.new(liveIDMbar, liveIDM, bar_index + 20, liveIDM, color = idmColor, style = line.style_dotted),
lv_lbl := label.new(bar_index + 20, liveIDM, "IDM", color = transp, textcolor = idmColor, style = isCocUp ? label.style_label_down : label.style_label_up, size = size.small)
else
lv_line := na
lv_lbl := na
line.delete(lv_line )
label.delete(lv_lbl )
//#endregion
//#region fixing bugs
// plot(H,"H")
// plot(lastH, "lastH")
// plot(lastHH, "lastHH")
// plot(idmS, "idmS")
// plot(puUp, "puUp")
// plot(L,"L")
// plot(lastL, "lastL")
// plot(lastLL, "lastLL")
// plot(idmB, "idmB")
// plot(puDn, "puDn")
//#endregion

Dskyz (DAFE) GENESIS Dskyz (DAFE) GENESIS: Adaptive Quant, Real Regime Power
Let’s be honest: Most published strategies on TradingView look nearly identical—copy-paste “open-source quant,” generic “adaptive” buzzwords, the same shallow explanations. I’ve even fallen into this trap with my own previously posted strategies. Not this time.
What Makes This Unique
GENESIS is not a black-box mashup or a pre-built template. It’s the culmination of DAFE’s own adaptive, multi-factor, regime-aware quant engine—built to outperform, survive, and visualize live edge in anything from NQ/MNQ to stocks and crypto.
True multi-factor core: Volume/price imbalances, trend shifts, volatility compression/expansion, and RSI all interlock for signal creation.
Adaptive regime logic: Trades only in healthy, actionable conditions—no “one-size-fits-all” signals.
Momentum normalization: Uses rolling, percentile-based fast/slow EMA differentials, ALWAYS normalized, ALWAYS relevant—no “is it working?” ambiguity.
Position sizing that adapts: Not fixed-lot, not naive—not a loophole for revenge trading.
No hidden DCA or pyramiding—what you see is what you trade.
Dashboard and visual system: Directly connected to internal logic. If it’s shown, it’s used—and nothing cosmetic is presented on your chart that isn’t quantifiable.
Inputs and What They Mean (Read Carefully)
📊 Main Signal Inputs
Maximum Raw Score: How many distinct factors can contribute to regime/trade confidence (default 4). If you extend the quant logic, increase this.
RSI Length / Min RSI for Shorts / Max RSI for Longs: Fine-tunes how “overbought/oversold” matters; increase the length for smoother swings, tighten floors/ceilings for more extreme signals.
⚡ Regime & Momentum Gates
Min Normed Momentum/Score (Conf): Raise to demand only the strongest trends—your filter to avoid algorithmic chop.
🕒 Volatility & Session
ATR Lookback, ATR Low/High Percentile: These control your system’s awareness of when the market is dead or ultra-volatile. All sizing and filter logic adapts in real time.
Trading Session (hours): Easy filter for when entries are allowed; default is regular trading hours—no surprise overnight fills.
📊 Sizing & Risk
Max Dollar Risk / Base-Max Contracts: All sizing is adaptive, based on live regime and volatility state—never static or “just 1 contract.” Control your max exposures and real $ risk.
🔄 Exits & Scaling
Stop/Trail/Scale multipliers: You choose how dynamic/flexible risk controls and profit-taking need to be. ATR-based, so everything auto-adjusts to the current market mode.
Visuals That Actually Matter
Dashboard (Top Right): Shows only live, relevant stats: scoring, status, position size, win %, win streak, total wins—all from actual trade engine state (not “simulated”).
Watermark (Bottom Right): Momentum bar visual is always-on, regime-aware, reflecting live regime confidence and momentum normalization. If the bar is empty, you’re truly in no-momentum. If it glows lime, you’re riding the strongest possible edge.
*No cosmetics, no hidden code distractions.
Why It Wins
While others put out “AI-powered” strategies with little logic or soul, GENESIS is ruthlessly practical. It is built around what keeps traders alive:
- Context-aware signals, not just patterns
- Tight, transparent risk
- Inputs that adapt, not confuse
- Visuals that clarify, not distract
- Code that runs clean, efficient, and with minimal overfitting risk (try it on QQQ, AMD, SOL, etc. out of the box)
Disclaimer (for TradingView compliance):
Trading is risky. Futures, stocks, and crypto can result in significant losses. Do not trade with funds you cannot afford to lose. This is for educational and informational purposes only. Use in simulation/backtest mode before live trading. No past performance is indicative of future results. Always understand your risk and ownership of your trades.
Personal Note to Mods and Traders:
Yes, this statement is DIFFERENT, because this script IS different. If you see this taken down for some technicality (charting labels etc.), know I will fix, adapt, and repost until the system and its truth are visible to the community.
This will not be my last—my goal is to keep raising the bar until DAFE is a brand or I’m forced to take this private.
Use with discipline, use with clarity, and always trade smarter.
— Dskyz, powered by DAFE Trading Systems.

₿ober XM v1.3# ₿ober XM v1.3 Trading Bot Documentation
## Overview
The ₿ober XM v1.3 is an advanced dual-channel trading bot. It integrates multiple technical indicators, customizable risk management, and advanced order execution via webhook for automated trading. The bot's distinctive feature is its separate channel systems for long and short positions, allowing for asymmetric trade strategies that adapt to different market conditions.
### Key Features
- **Dual-Channel System**: Independent indicator settings for long and short positions
- **Multiple Entry Strategies**: Breakout, Pullback, and Mean Reversion options
- **Machine Learning Integration**: Predictive MLMA (Machine Learning Moving Average) for enhanced trend detection
- **Comprehensive Filtering**: Combines momentum, volatility, volume, and trend filters
- **Advanced Risk Management**: Dynamic position sizing, multiple stop-loss types, and trailing stops
- **Webhook Integration**: Direct connectivity to exchanges or third-party platforms
- **Configurable OBV MA Types**: Choose from multiple moving average types for OBV calculations
### General Settings
| Setting | Description | Default Value |
|---------|-------------|---------------|
| **Long Positions** | Enable or disable long trades | Enabled |
| **Short Positions** | Enable or disable short trades | Enabled |
| **Risk/Reward Area** | Visual display of stop-loss and take-profit zones | Enabled |
| **Long Entry Source** | Price data used for long entry signals | hl2 (High+Low/2) |
| **Short Entry Source** | Price data used for short entry signals | hl2 (High+Low/2) |
The bot allows you to trade long positions, short positions, or both simultaneously. Each direction has its own set of parameters, allowing for fine-tuned strategies that recognize the asymmetric nature of market movements.
### Webhook Configuration
| Setting | Description | Default Value |
|---------|-------------|---------------|
| **Long Entry Comment** | Webhook message for long entries | "ENTER-LONG" |
| **Short Entry Comment** | Webhook message for short entries | "ENTER-SHORT" |
| **Exit Comment** | Webhook message for position exits | "EXIT-ALL" |
| **Leverage** | Position size multiplier | 1.0 |
| **Reduce Only** | Restrict orders to reducing positions | Enabled |
| **Exchange Conditional Orders** | Place SL/TP directly on exchange | Disabled |
The webhook system allows for seamless integration with exchanges or third-party platforms:
- **Benefits**:
- Automated trade execution without manual intervention
- Immediate response to market conditions
- Consistent execution of your strategy
- **Implementation Notes**:
- Requires proper webhook configuration on your exchange or platform
- Test thoroughly with small position sizes before full deployment
- Consider latency between signal generation and execution
### Backtesting Period
Define a specific historical period to evaluate the bot's performance:
| Setting | Description | Default Value |
|---------|-------------|---------------|
| **Start Date** | Beginning of backtest period | January 1, 2025 |
| **End Date** | End of backtest period | December 31, 2026 |
- **Best Practice**: Test across different market conditions (bull markets, bear markets, sideways markets)
- **Limitation**: Past performance doesn't guarantee future results
## Entry and Exit Strategies
### Dual-Channel System
A key innovation of the Bober XM is its dual-channel approach:
- **Independent Parameters**: Each trade direction has its own channel settings
- **Asymmetric Trading**: Recognizes that markets often behave differently in uptrends versus downtrends
- **Optimized Performance**: Fine-tune settings for both bullish and bearish conditions
This approach allows the bot to adapt to the natural asymmetry of markets, where uptrends often develop gradually while downtrends can be sharp and sudden.
### Channel Types
#### 1. Keltner Channels
Traditional volatility-based channels using EMA and ATR:
| Setting | Long Default | Short Default |
|---------|--------------|---------------|
| **EMA Length** | 37 | 20 |
| **ATR Length** | 13 | 17 |
| **Multiplier** | 1.4 | 1.9 |
| **Source** | low | high |
- **Strengths**:
- Reliable in trending markets
- Less prone to whipsaws than Bollinger Bands
- Clear visual representation of volatility
- **Weaknesses**:
- Can lag during rapid market changes
- Less effective in choppy, non-trending markets
#### 2. Machine Learning Moving Average (MLMA)
Advanced predictive model using kernel regression (RBF kernel):
| Setting | Long Default | Short Default |
|---------|--------------|---------------|
| **Window Size** | 16 | 16 |
| **Forecast Length** | 3 | 3 |
| **Noise Parameter** | 0.43 | 0.44 |
| **Band Multiplier** | 0.6 | 0.5 |
| **Source** | low | high |
- **Strengths**:
- Predictive rather than reactive
- Adapts quickly to changing market conditions
- Better at identifying trend reversals early
- **Weaknesses**:
- More computationally intensive
- Requires careful parameter tuning
- Can be sensitive to input data quality
### Entry Strategies
| Strategy | Description | Ideal Market Conditions |
|----------|-------------|-------------------------|
| **Breakout** | Enters when price breaks through channel bands, indicating strong momentum | High volatility, emerging trends |
| **Pullback** | Enters when price retraces to the middle band after testing extremes | Established trends with regular pullbacks |
| **Mean Reversion** | Enters at channel extremes, betting on a return to the mean | Range-bound or oscillating markets |
#### Breakout Strategy (Default)
- **Implementation**: Enters long when price crosses above the upper band, short when price crosses below the lower band
- **Strengths**: Captures strong momentum moves, performs well in trending markets
- **Weaknesses**: Can lead to late entries, higher risk of false breakouts
- **Optimization Tips**:
- Increase channel multiplier for fewer but more reliable signals
- Combine with volume confirmation for better accuracy
#### Pullback Strategy
- **Implementation**: Enters long when price pulls back to middle band during uptrend, short during downtrend pullbacks
- **Strengths**: Better entry prices, lower risk, higher probability setups
- **Weaknesses**: Misses some strong moves, requires clear trend identification
- **Optimization Tips**:
- Use with trend filters to confirm overall direction
- Adjust middle band calculation for market volatility
#### Mean Reversion Strategy
- **Implementation**: Enters long at lower band, short at upper band, expecting price to revert to the mean
- **Strengths**: Excellent entry prices, works well in ranging markets
- **Weaknesses**: Dangerous in strong trends, can lead to fighting the trend
- **Optimization Tips**:
- Implement strong trend filters to avoid counter-trend trades
- Use smaller position sizes due to higher risk nature
### Confirmation Indicators
#### Pivot Point SuperTrend
Combines pivot points with ATR-based SuperTrend for trend confirmation:
| Setting | Default Value |
|---------|---------------|
| **Pivot Period** | 25 |
| **ATR Factor** | 2.2 |
| **ATR Period** | 41 |
- **Function**: Identifies significant market turning points and confirms trend direction
- **Implementation**: Requires price to respect the SuperTrend line for trade confirmation
#### Weighted Moving Average (WMA)
Provides additional confirmation layer for entries:
| Setting | Default Value |
|---------|---------------|
| **Period** | 15 |
| **Source** | ohlc4 (average of Open, High, Low, Close) |
- **Function**: Confirms trend direction and filters out low-quality signals
- **Implementation**: Price must be above WMA for longs, below for shorts
### Exit Strategies
#### On-Balance Volume (OBV) Based Exits
Uses volume flow to identify potential reversals:
| Setting | Default Value |
|---------|---------------|
| **Source** | ohlc4 |
| **MA Type** | HMA (Options: SMA, EMA, WMA, RMA, VWMA, HMA) |
| **Period** | 22 |
- **Function**: Identifies divergences between price and volume to exit before reversals
- **Implementation**: Exits when OBV crosses its moving average in the opposite direction
- **Customizable MA Type**: Different MA types provide varying sensitivity to OBV changes:
- **SMA**: Traditional simple average, equal weight to all periods
- **EMA**: More weight to recent data, responds faster to price changes
- **WMA**: Weighted by recency, smoother than EMA
- **RMA**: Similar to EMA but smoother, reduces noise
- **VWMA**: Factors in volume, helpful for OBV confirmation
- **HMA**: Reduces lag while maintaining smoothness (default)
#### ADX Exit Confirmation
Uses Average Directional Index to confirm trend exhaustion:
| Setting | Default Value |
|---------|---------------|
| **ADX Threshold** | 35 |
| **ADX Smoothing** | 60 |
| **DI Length** | 60 |
- **Function**: Confirms trend weakness before exiting positions
- **Implementation**: Requires ADX to drop below threshold or DI lines to cross
## Risk Management System
### Position Sizing
Automatically calculates position size based on account equity and risk parameters:
| Setting | Default Value |
|---------|---------------|
| **Risk % of Equity** | 50% |
- **Implementation**:
- Position size = (Account equity × Risk %) ÷ (Entry price × Stop loss distance)
- Adjusts automatically based on volatility and stop placement
- **Best Practices**:
- Start with lower risk percentages (1-2%) until strategy is proven
- Consider reducing risk during high volatility periods
### Stop-Loss Methods
Multiple stop-loss calculation methods with separate configurations for long and short positions:
| Method | Description | Configuration |
|--------|-------------|---------------|
| **ATR-Based** | Dynamic stops based on volatility | ATR Period: 14, Multiplier: 2.0 |
| **Percentage** | Fixed percentage from entry | Long: 1.5%, Short: 1.5% |
| **PIP-Based** | Fixed currency unit distance | 10.0 pips |
- **Implementation Notes**:
- ATR-based stops adapt to changing market volatility
- Percentage stops maintain consistent risk exposure
- PIP-based stops provide precise control in stable markets
### Trailing Stops
Locks in profits by adjusting stop-loss levels as price moves favorably:
| Setting | Default Value |
|---------|---------------|
| **Stop-Loss %** | 1.5% |
| **Activation Threshold** | 2.1% |
| **Trailing Distance** | 1.4% |
- **Implementation**:
- Initial stop remains fixed until profit reaches activation threshold
- Once activated, stop follows price at specified distance
- Locks in profit while allowing room for normal price fluctuations
### Risk-Reward Parameters
Defines the relationship between risk and potential reward:
| Setting | Default Value |
|---------|---------------|
| **Risk-Reward Ratio** | 1.4 |
| **Take Profit %** | 2.4% |
| **Stop-Loss %** | 1.5% |
- **Implementation**:
- Take profit distance = Stop loss distance × Risk-reward ratio
- Higher ratios require fewer winning trades for profitability
- Lower ratios increase win rate but reduce average profit
## Advanced Filtering System
### Momentum & Trend Filters
#### ADX Based Momentum Filter
| Setting | Default Value |
|---------|---------------|
| **Use Filter** | Enabled |
| **Apply D+/D- Check** | Enabled |
| **ADX Smoothing** | 34 |
| **DI Length** | 28 |
| **ADX Threshold** | 19 |
- **Function**: Ensures trades are taken only in strong trending conditions
- **Implementation**: Requires ADX above threshold for trade entry
#### RSI Filter
Uses Relative Strength Index to avoid overbought/oversold conditions:
| Setting | Default Value | Status |
|---------|---------------|--------|
| **RSI Period** | 14 | Disabled |
| **Overbought Level** | 70 | |
| **Oversold Level** | 30 | |
- **Function**: Prevents entries in potentially exhausted market conditions
- **Implementation**: Blocks long entries when RSI > 70, short entries when RSI < 30
### Volatility Filter
Controls trading during excessive market volatility:
| Setting | Default Value |
|---------|---------------|
| **Measure** | ATR |
| **Period** | 8 |
| **Threshold** | 1.3 |
| **Source** | ohlc4 |
- **Function**: Prevents trading during unpredictable market conditions
- **Implementation**: Blocks trades when current volatility exceeds threshold × average volatility
### Volume Filter
Ensures adequate market liquidity for trades:
| Setting | Default Value |
|---------|---------------|
| **Threshold** | 1.1× average |
| **Average Period** | 4 |
| **Smoothing Period** | 18 |
- **Function**: Prevents trading during low liquidity conditions
- **Implementation**: Requires current volume to exceed threshold × average volume
### Filter Combinations
The bot allows for simultaneous application of multiple filters:
- **Recommended Combinations**:
- Trending markets: ADX + Volume filters
- Ranging markets: Volatility + RSI filters
- All markets: Volume filter as minimum requirement
- **Performance Impact**:
- Each additional filter reduces the number of trades
- Quality of remaining trades typically improves
- Optimal combination depends on market conditions and timeframe
## Visual Indicators and Chart Analysis
The bot provides comprehensive visual feedback on the chart:
- **Channel Bands**: Keltner or MLMA bands showing potential support/resistance
- **Pivot SuperTrend**: Colored line showing trend direction and potential reversal points
- **Entry/Exit Markers**: Annotations showing actual trade entries and exits
- **Risk/Reward Zones**: Visual representation of stop-loss and take-profit levels
These visual elements allow for:
- Real-time strategy assessment
- Post-trade analysis and optimization
- Educational understanding of the strategy logic
## Implementation Guide
### TradingView Setup
1. Load the script in TradingView Pine Editor
2. Apply to your preferred chart and timeframe
3. Adjust parameters based on your trading preferences
4. Enable alerts for webhook integration
### Webhook Integration
1. Configure webhook URL in TradingView alerts
2. Set up receiving endpoint on your trading platform
3. Define message format matching the bot's output
4. Test with small position sizes before full deployment
### Optimization Process
1. Backtest across different market conditions
2. Identify parameter sensitivity through multiple tests
3. Focus on risk management parameters first
4. Fine-tune entry/exit conditions based on performance metrics
5. Validate with out-of-sample testing
## Performance Considerations
### Strengths
- Adaptability to different market conditions through dual channels
- Multiple layers of confirmation reducing false signals
- Comprehensive risk management protecting capital
- Machine learning integration for predictive edge
### Limitations
- Complex parameter set requiring careful optimization
- Potential over-optimization risk with so many variables
- Computational intensity of MLMA calculations
- Dependency on proper webhook configuration for execution
### Best Practices
- Start with conservative risk settings (1-2% of equity)
- Test thoroughly in demo environment before live trading
- Monitor performance regularly and adjust parameters
- Consider market regime changes when evaluating results
## Conclusion
The ₿ober XM v1.3 represents a sophisticated trading system combining traditional technical analysis with machine learning elements. Its dual-channel approach and comprehensive filtering system make it adaptable to various market conditions, while its risk management features help protect capital during adverse movements.
The addition of selectable OBV MA types in v1.3 provides further customization, allowing traders to fine-tune the exit strategy sensitivity according to market conditions and personal preferences. This enhancement offers more control over exit signals, potentially improving trade outcome profitability.
The bot is designed for traders who understand that no system is perfect, but that edge can be found through careful optimization and disciplined execution. With proper setup and realistic expectations, it provides a framework for systematic cryptocurrency trading across various market conditions.
2025 - Licensed under Creative Commons Attribution-NonCommercial-ShareAlike 4.0 International

Expected Move Manual EditVisualize key weekly support and resistance levels based on manually entered Previous Week
Close (PWC) and Expected Move (EM) values.
This script plots:
Your entered PWC (Black, Solid Line).
Expected Move Top (+1 SD based on your EM input) (Green, Solid Line).
Expected Move Bottom (-1 SD based on your EM input) (Red, Solid Line).
Intermediate quadrant levels (+/- 0.25, 0.50, 0.75 SD) (Green/Red, Dotted Lines).
Features:
Manual PWC & Expected Move inputs.
Clear visual styling for levels.
Toggleable labels on the price axis.
Toggleable labels directly on the chart (right-aligned).
How to Use:
Add to chart.
Go to Settings -> Inputs.
Enter your calculated/sourced PWC value.
Enter your calculated/sourced Expected Move value (treated as 1 Standard Deviation).
Adjust label visibility if desired.
Note: This indicator requires manual input for PWC and EM; it does not calculate them automatically. The Ticker Symbol input is for reference only.

Adaptive RSI | Lyro RSThe Adaptive RSI | 𝓛𝔂𝓻𝓸 𝓡𝓢 indicator enhances the traditional Relative Strength Index (RSI) by integrating adaptive smoothing techniques and dynamic bands. This design aims to provide traders with a nuanced view of market momentum, highlighting potential trend shifts and overbought or oversold conditions.
Key Features
Adaptive RSI Calculation: Combines fast and slow Exponential Moving Averages (EMAs) of the RSI to capture momentum shifts effectively.
Dynamic Bands: Utilizes a smoothed standard deviation approach to create upper and lower bands around the adaptive RSI, aiding in identifying extreme market conditions.
Signal Line: An additional EMA of the adaptive RSI serves as a signal line, assisting in confirming trend directions.
Customizable Color Schemes: Offers multiple predefined color palettes, including "Classic," "Mystic," "Accented," and "Royal," with an option for users to define custom colors for bullish and bearish signals.
How It Works
Adaptive RSI Computation: Calculates the difference between fast and slow EMAs of the RSI, producing a responsive oscillator that adapts to market momentum.
Band Formation: Applies a smoothing factor to the standard deviation of the adaptive RSI, generating dynamic upper and lower bands that adjust to market volatility.
Signal Line Generation: Computes an EMA of the adaptive RSI to act as a signal line, providing additional confirmation for potential entries or exits.
Visualization: Plots the adaptive RSI as color-coded columns, with colors indicating bullish or bearish momentum. The dynamic bands are filled to visually represent overbought and oversold zones.
How to Use
Identify Momentum Shifts: Observe crossovers between the adaptive RSI and the signal line to detect potential changes in trend direction.
Spot Overbought/Oversold Conditions: Monitor when the adaptive RSI approaches or breaches the dynamic bands, signaling possible market extremes.
Customize Visuals: Select from predefined color palettes or define custom colors to align the indicator's appearance with personal preferences or chart themes.
Customization Options
RSI and EMA Lengths: Adjust the lengths of the RSI, fast EMA, slow EMA, and signal EMA to fine-tune the indicator's sensitivity.
Band Settings: Modify the band length, multiplier, and smoothing factor to control the responsiveness and width of the dynamic bands.
Color Schemes: Choose from predefined color modes or enable custom color settings to personalize the indicator's appearance.
⚠️ DISCLAIMER ⚠️: This indicator alone is not reliable and should be combined with other indicator(s) for a stronger signal.

Candilang RalpinoyWala lang..
Hirap kasi identify ng mga candlesticks
eto ay para sa mas madaling pag identify testing lang credits kay algomax original script writter
but simply effective

Really Key Levels█ OVERVIEW
This indicator shows the most useful and universally used key trading levels (and only those) in a visually appealing way. Its originality lies in the fact that it was developed due to being unable to find an indicator that wasn't cluttered with other features or far less relevant levels, or one that would indicate the bar causing the level (i.e., not just using a horizontal line over the whole chart), or one that was well-programmed and didn’t frequently refresh for many seconds for no obvious reason, taking far too long to do so for such a seemingly simple indicator.
█ FEATURES
Shows the most frequently used key levels in a visually appealing way
Indicates the bar that causes the level, with the line starting at that bar
Works correctly and consistently on both RTH and ETH charts
Lines can be optionally extended both left and right, if the user prefers
Works with US/European stocks and US futures (at least)
Configurable futures regular session (default time is for CME futures, e.g., ES/NQ, etc.)
Users can configure line colour, style, and thickness
Adjustable label locations to prevent overlap with other indicator labels
Nice defaults that look good, and a well-contrasting label text colour
Well-documented, high-quality, open-source code for those who are interested
█ CONCEPTS
The indicator shows the following levels by a line starting at the bar that causes them:
Current Day RTH High/Low (visible and updated only during RTH; visible with no further updates in the post-market)
Current Day RTH Open (only after the RTH open)
Pre-Market High/Low (as it develops in the pre-market and fixed after RTH open)
Previous Day RTH Close
Previous Day RTH High/Low
Previous Day Pre-Market High-Low
Two Days Ago RTH Close
Other levels may be added in future versions, if requested and if they are Really Key Levels.
Regarding futures: despite being a 23-hour market (for CME futures, 5 p.m. the previous day to 4 p.m. the current day), most trading activity takes place together with the RTH on stock exchanges in New York, 08:30 to 3 p.m. Central (Chicago) time. Therefore, a user-configurable regular market is defined at those times, with times before this (from 5 p.m. the previous day) being considered pre-market, and times after this (until 4 p.m.) being considered post-market.
Care was taken so that the code uses no hard-coded time zones, exchanges, or session times. For this reason, it can in principle work globally. However, it very much depends on the information provided by the exchange, which is reflected in built-in Pine Script variables (see Limitations below).
█ LIMITATIONS
Pre-market levels are not shown when viewing an RTH chart.
The indicator was developed and tested on US/European stocks and US futures. It may or may not work for stocks and futures in other countries (depending on their pre- and post-market definitions and what information the exchange provides to TradingView via the relevant built-in Pine Script variable). It does not work on other security types, especially those with a 24-hour market that don't have a uniquely defined daily close, implicit H/L time window, or a pre-market.


[NIC] Volatility Anomaly Indicator (Inspired by Jeff Augen)Volatility Anomaly Indicator (Inspired by Jeff Augen)
The Volatility Anomaly Indicator, inspired by Jeff Augen’s The Volatility Edge in Options Trading, helps traders spot price distortions by analyzing volatility imbalances. It compares short-term (10-day) and long-term (30-day) historical volatility (HV), plotting the ratio in a subgraph with clusters of dots to highlight anomalies—red for volatility spikes (potential sells) and green for calm periods (potential buys).
Originality: This indicator uniquely adapts Augen’s volatility concepts into a visual tool, focusing on relative volatility distortions rather than absolute levels, making it ideal for volatile assets like $TQQQ.
Features:
Calculates the ratio of short-term to long-term volatility.
Detects spikes (ratio > 1.5) and calm periods (ratio < 0.67) with customizable thresholds.
Plots volatility ratio as a blue line, with red/green dots for anomalies.
Includes optional buy/sell signals on the main chart (if overlay is enabled).
How It Works
The indicator computes historical volatility using log returns, then calculates the short-term to long-term volatility ratio. Spikes and calm periods are marked with dots in the subgraph, and threshold lines (1.5 and 0.67) provide context. Buy signals (green triangles) trigger during calm periods, and sell signals (red triangles) during spikes.
How to Use
Apply to any chart (e.g., NASDAQ:TQQQ daily).
Adjust inputs: Short Volatility Period (10), Long Volatility Period (30), Volatility Spike Threshold (1.5).
Watch for red dot clusters (spikes, potential sells) and green dot clusters (calm, potential buys).
Combine with price action or RSI for confirmation.
Why Use This Indicator?
Focuses on volatility-driven price inefficiencies.
Clear visualization with dot clusters.
Customizable for different assets and timeframes.
Limitations
Not a standalone system; requires confirmation.
May give false signals in choppy markets.

